Molecular insights into sex-specific metabolic alterations in Alzheimer's mouse brain using multi-omics approach
- PMID: 36624525
- PMCID: PMC9827669
- DOI: 10.1186/s13195-023-01162-4
Molecular insights into sex-specific metabolic alterations in Alzheimer's mouse brain using multi-omics approach
Abstract
Background: Alzheimer's disease (AD) is a progressive neurodegenerative disorder that is characterized by altered cellular metabolism in the brain. Several of these alterations have been found to be exacerbated in females, known to be disproportionately affected by AD. We aimed to unravel metabolic alterations in AD at the metabolic pathway level and evaluate whether they are sex-specific through integrative metabolomic, lipidomic, and proteomic analysis of mouse brain tissue.
Methods: We analyzed male and female triple-transgenic mouse whole brain tissue by untargeted mass spectrometry-based methods to obtain a molecular signature consisting of polar metabolite, complex lipid, and protein data. These data were analyzed using multi-omics factor analysis. Pathway-level alterations were identified through joint pathway enrichment analysis or by separately evaluating lipid ontology and known proteins related to lipid metabolism.
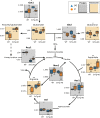
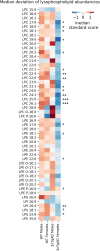
Results: Our analysis revealed significant AD-associated and in part sex-specific alterations across the molecular signature. Sex-dependent alterations were identified in GABA synthesis, arginine biosynthesis, and in alanine, aspartate, and glutamate metabolism. AD-associated alterations involving lipids were also found in the fatty acid elongation pathway and lysophospholipid metabolism, with a significant sex-specific effect for the latter.
Conclusions: Through multi-omics analysis, we report AD-associated and sex-specific metabolic alterations in the AD brain involving lysophospholipid and amino acid metabolism. These findings contribute to the characterization of the AD phenotype at the molecular level while considering the effect of sex, an overlooked yet determinant metabolic variable.
Keywords: 3xTg AD mouse; Alzheimer’s disease; Amino acids; Lipidomics; Lysophospholipids; Metabolomics; Multi-omics; Proteomics; Sex differences.
© 2023. The Author(s).
Conflict of interest statement
The authors declare that they have no competing interests.
Figures


Similar articles
-
Pathway-based integration of multi-omics data reveals lipidomics alterations validated in an Alzheimer's disease mouse model and risk loci carriers.J Neurochem. 2023 Jan;164(1):57-76. doi: 10.1111/jnc.15719. Epub 2022 Dec 12. J Neurochem. 2023. PMID: 36326588 Free PMC article.
-
An integrative multi-omics approach reveals new central nervous system pathway alterations in Alzheimer's disease.Alzheimers Res Ther. 2021 Apr 1;13(1):71. doi: 10.1186/s13195-021-00814-7. Alzheimers Res Ther. 2021. PMID: 33794997 Free PMC article.
-
Systematic review of brain and blood lipidomics in Alzheimer's disease mouse models.Prog Lipid Res. 2023 Apr;90:101223. doi: 10.1016/j.plipres.2023.101223. Epub 2023 Mar 5. Prog Lipid Res. 2023. PMID: 36871907 Review.
-
Hippocampus Proteomics and Brain Lipidomics Reveal Network Dysfunction and Lipid Molecular Abnormalities in APP/PS1 Mouse Model of Alzheimer's Disease.J Proteome Res. 2020 Aug 7;19(8):3427-3437. doi: 10.1021/acs.jproteome.0c00255. Epub 2020 Jun 19. J Proteome Res. 2020. PMID: 32510958
-
Sexual Dimorphism in the 3xTg-AD Mouse Model and Its Impact on Pre-Clinical Research.J Alzheimers Dis. 2021;80(1):41-52. doi: 10.3233/JAD-201014. J Alzheimers Dis. 2021. PMID: 33459720 Free PMC article. Review.
Cited by
-
Multi Omics Applications in Biological Systems.Curr Issues Mol Biol. 2024 Jun 11;46(6):5777-5793. doi: 10.3390/cimb46060345. Curr Issues Mol Biol. 2024. PMID: 38921016 Free PMC article. Review.
-
A case for seeking sex-specific treatments in Alzheimer's disease.Front Aging Neurosci. 2024 Feb 13;16:1346621. doi: 10.3389/fnagi.2024.1346621. eCollection 2024. Front Aging Neurosci. 2024. PMID: 38414633 Free PMC article. Review.
-
Metabolic Regulations of Smilax china L. against β-Amyloid Toxicity in Caenorhabditis elegans.Metabolites. 2024 Jan 13;14(1):49. doi: 10.3390/metabo14010049. Metabolites. 2024. PMID: 38248852 Free PMC article.
References
-
- Alzheimer's Association 2021 Alzheimer's Disease Facts and Figures. Alzheimer's Dement. 2021;17(3):327–406. - PubMed
-
- Alzheimer Europe . Dementia in Europe yearbook 2019: Estimating the prevalence of dementia in Europe, in Dementia in Europe yearbook, A. Europe, Editior. Alzheimer Europe; 2019.
-
- Budd Haeberlein S, et al. Two Randomized Phase 3 Studies of Aducanumab in Early Alzheimer’s Disease. J Prev Alzheimer's Dis. 2022;9(2):197–210. - PubMed
Publication types
MeSH terms
Substances
LinkOut - more resources
Full Text Sources
Medical
Molecular Biology Databases

