. 2022 Dec 19:21:401-417.
doi: 10.1016/j.csbj.2022.12.020. eCollection 2023.

Quantification of substoichiometric modification reveals global tsRNA hypomodification, preferences for angiogenin-mediated tRNA cleavage, and idiosyncratic epitranscriptomes of human neuronal cell-lines

Affiliations

Quantification of substoichiometric modification reveals global tsRNA hypomodification, preferences for angiogenin-mediated tRNA cleavage, and idiosyncratic epitranscriptomes of human neuronal cell-lines

Florian Pichot et al. Comput Struct Biotechnol J. .

Abstract

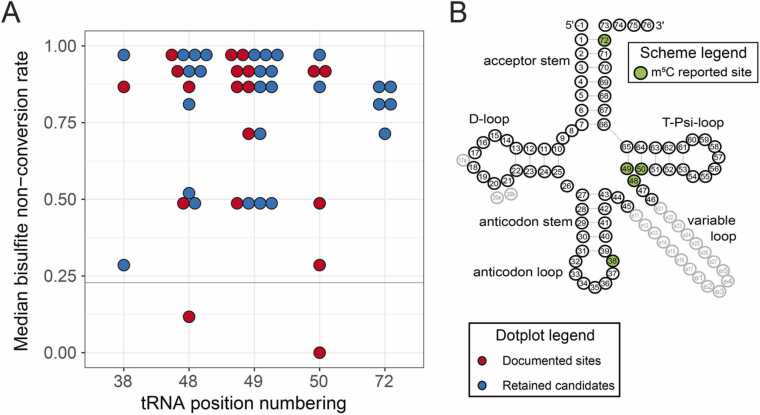
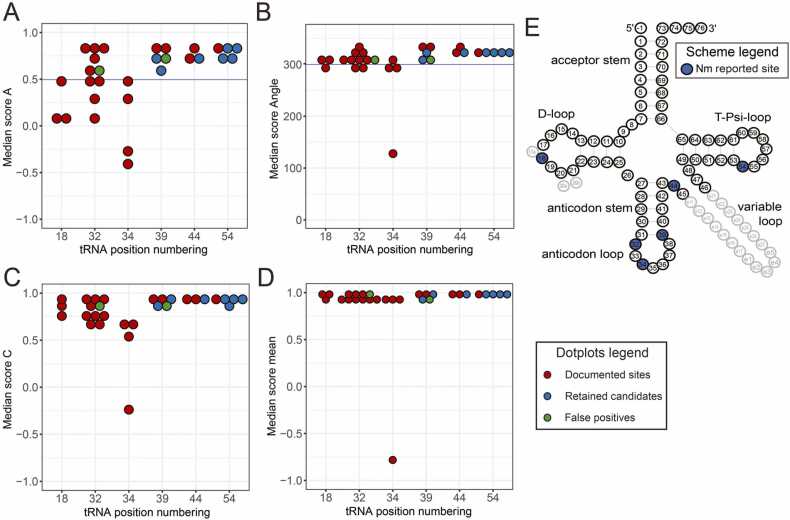
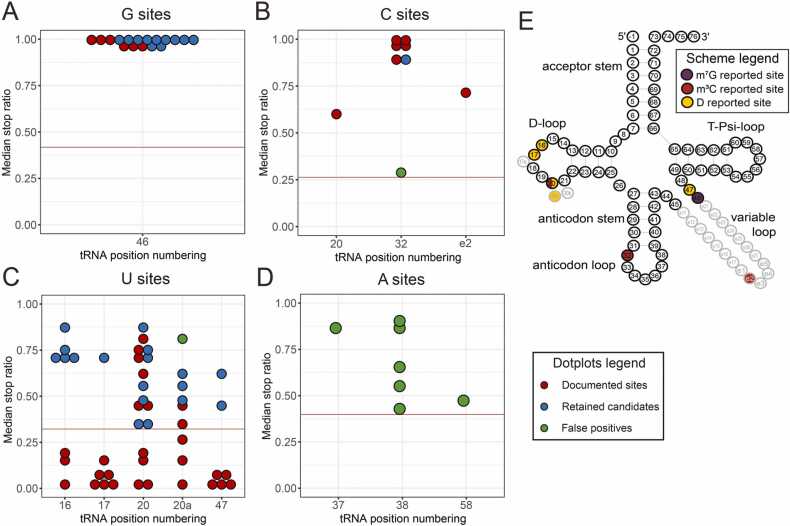
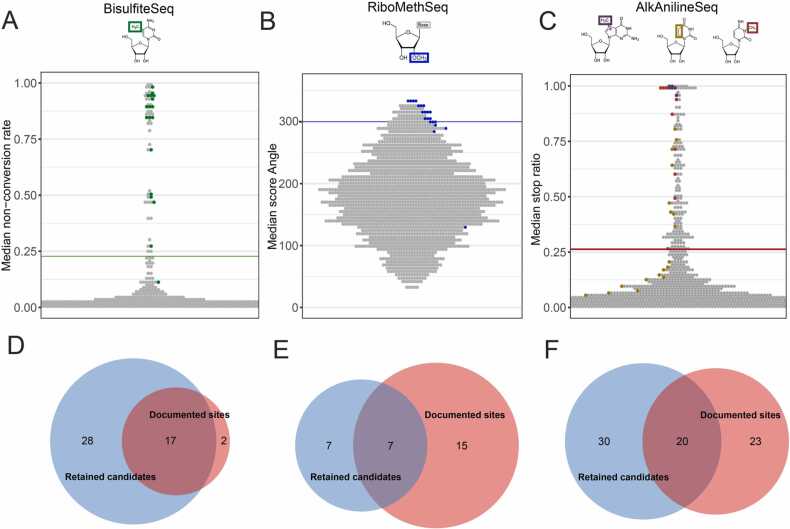
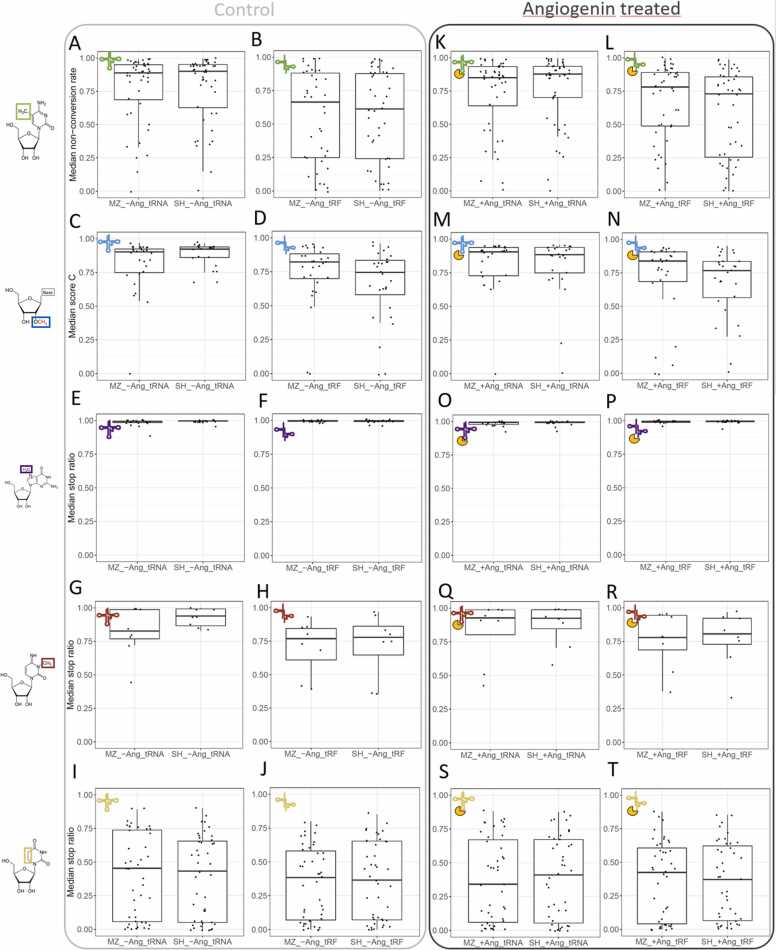
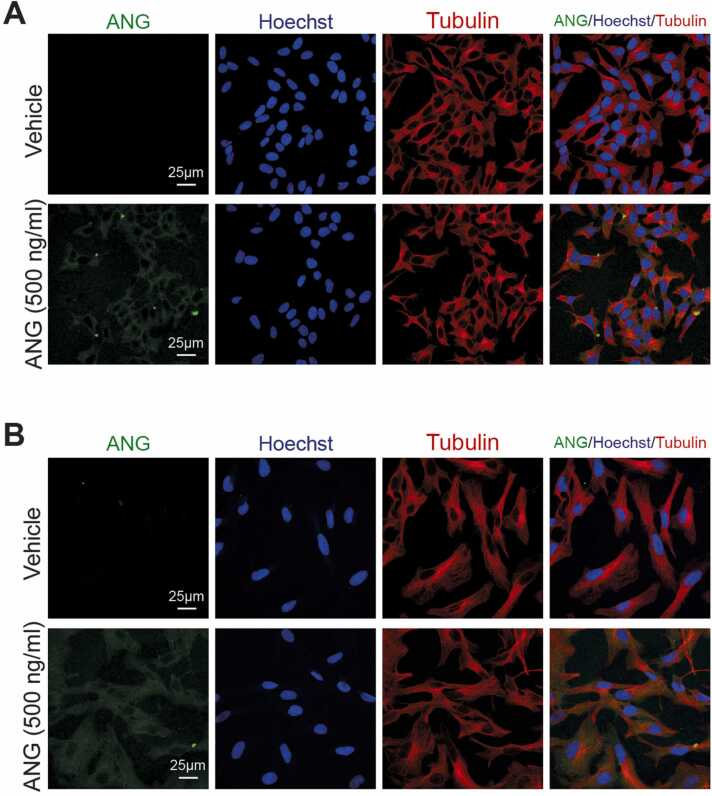
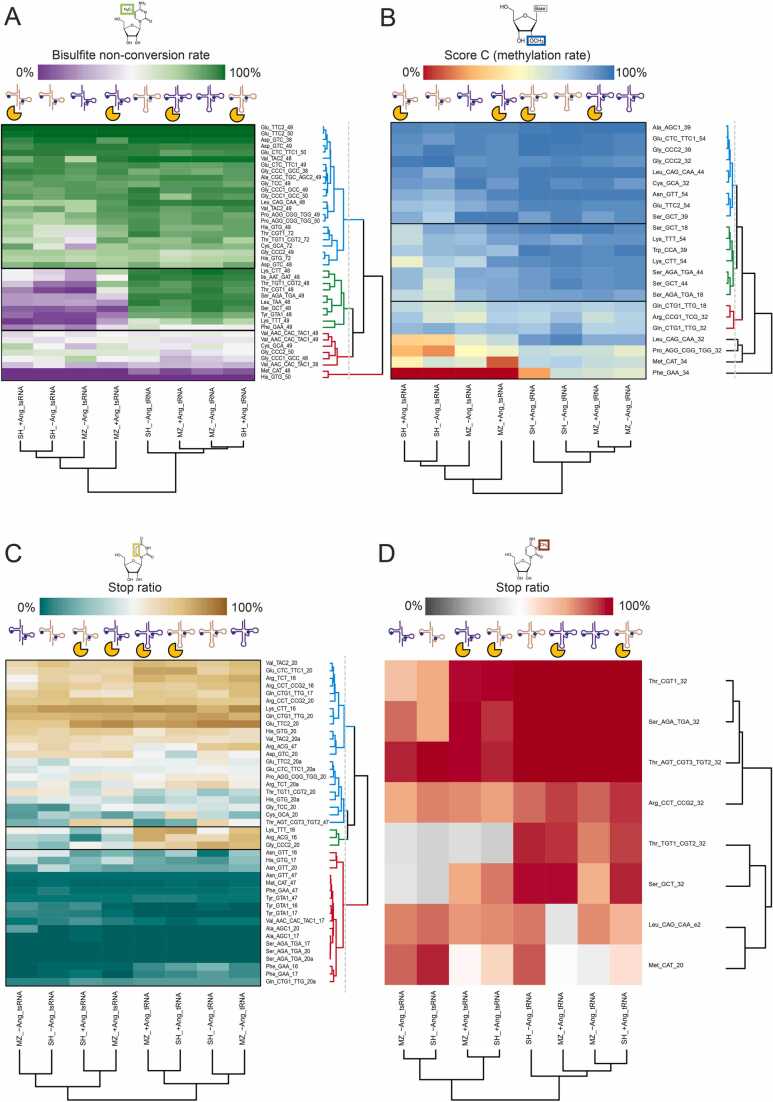
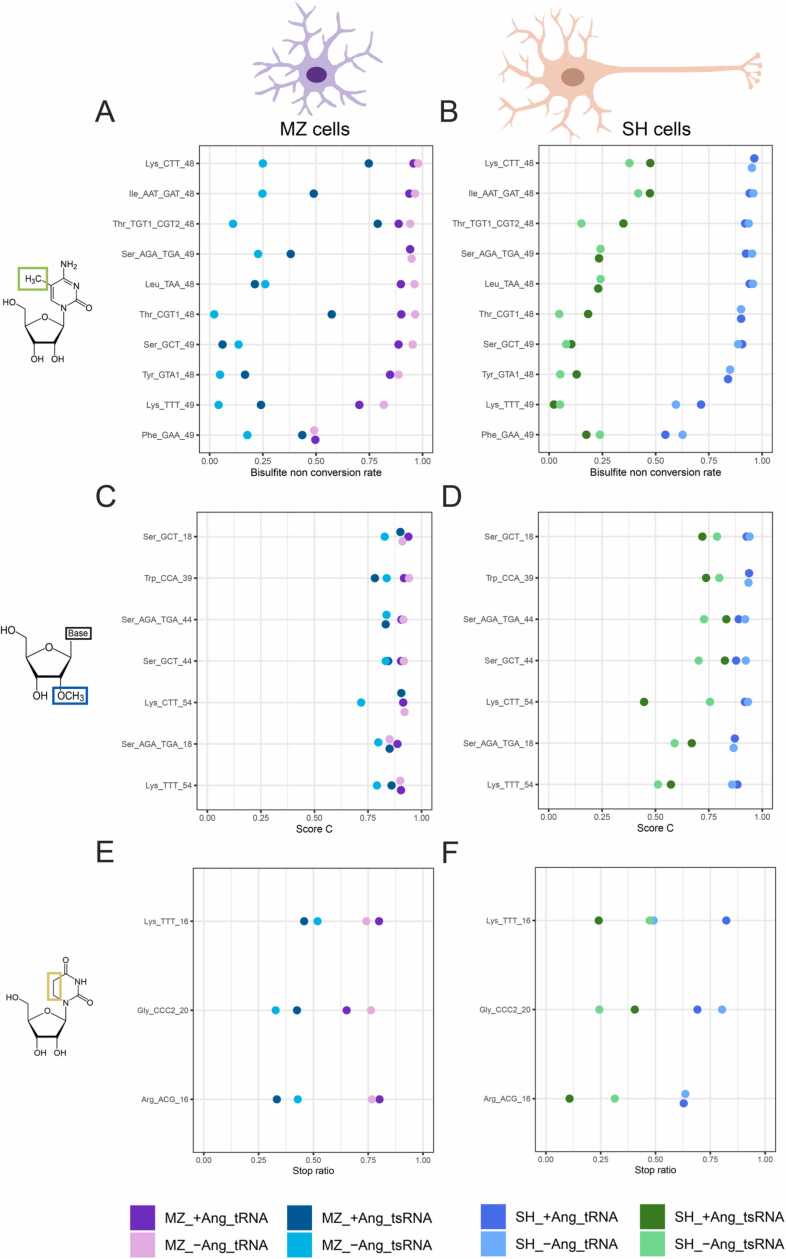
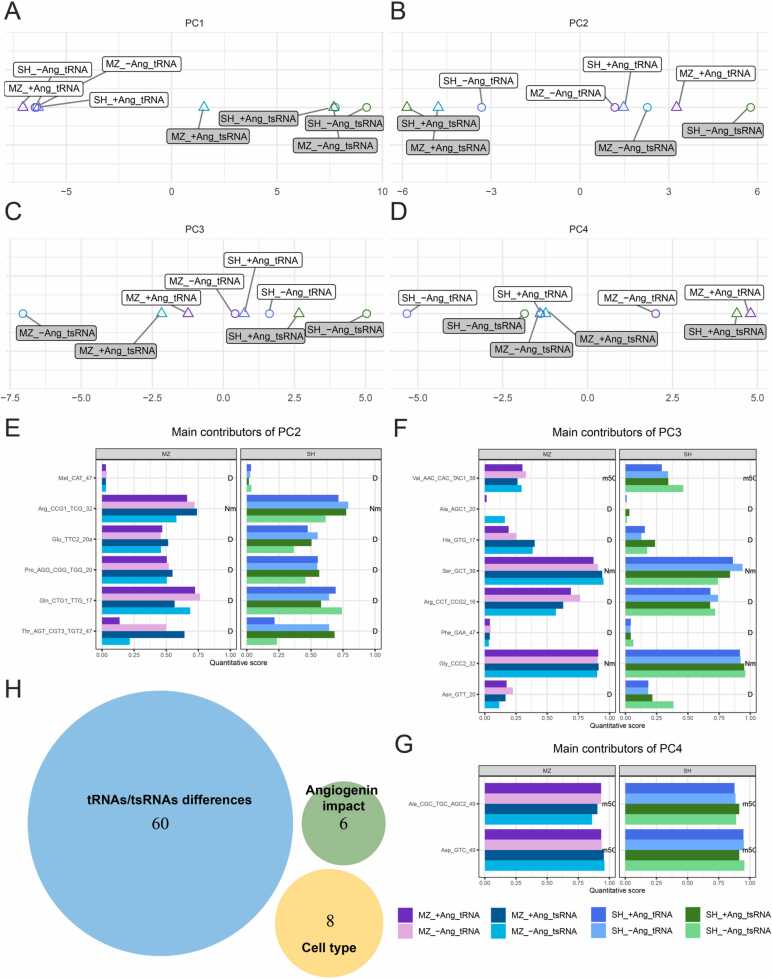
Modification of tRNA is an integral part of the epitranscriptome with a particularly pronounced potential to generate diversity in RNA expression. Eukaryotic tRNA contains modifications in up to 20% of their nucleotides, but not all sites are always fully modified. Combinations and permutations of partially modified sites in tRNAs can generate a plethora of tRNA isoforms, termed modivariants. Here, we investigate the stoichiometry of incompletely modified sites in tRNAs from human cell lines for their information content. Using a panel of RNA modification mapping methods, we assess the stoichiometry of sites that contain the modifications 5-methylcytidine (m5C), 2'-O-ribose methylation (Nm), 3-methylcytidine (m3C), 7-methylguanosine (m7G), and Dihydrouridine (D). We discovered that up to 75% of sites can be incompletely modified and that the differential modification status of a cellular tRNA population holds information that allows to discriminate e.g. different cell lines. As a further aspect, we investigated potential causal connectivity between tRNA modification and its processing into tRNA fragments (tiRNAs and tRFs). Upon exposure of cultured living cells to cell-penetrating angiogenin, the modification patterns of the corresponding RNA populations was changed. Importantly, we also found that tsRNAs were significantly less modified than their parent tRNAs at numerous sites, suggesting that tsRNAs might derive chiefly from hypomodified tRNAs.

Keywords: Angiogenin; Modification; Modification mapping; RNAseq; TRNA; TRNA fragments.


Conflict of interest statement

Mark Helm is a consultant for Moderna Inc.

Figures

ga1
Graphical abstract
Fig. 1
Fig. 1
BisulfiteSeq mapping of m5C sites in tRNAs. m5C modification level was measured here as bisulfite NonConversion level C-to-U (NonConv) and plotted on the Y-axis for tRNA positions (x-axis) reported to be modified in at least one isoacceptor in any species. The threshold of average + 3 *standard deviation = 0.228 is highlighted by a green horizontal line. Each dot represents a site in a different tRNA sequence. The red dots represent the m5C sites known from the literature [, , blue dots are plausible additional m5C sites identified in other tRNAs according to their NonConv score. The cloverleaf to the right shows the canonical secondary tRNA structure along with tRNA-specific nucleotide position numbering, including extra (optional) residues 17a, 20a/20b in the D-loop as well as nucleotides e1-e27 in the variable tRNA loop/region. Positions relevant for m5C are shown as green dots (pos 38, 48_49_50 and 72).
Fig. 2
Fig. 2
RiboMethSeq mapping of Nm sites in tRNAs. The upper panels A and B show results according to Score A and Score Angle, both of which were used for selection based on thresholds (blue lines). The lower panels show plots of Score mean and Score C, which were not applied for selection, but allow multiple types of assessment for any given residue. Red dots indicate known modification sites from the literature. Green dots indicate positions featuring high RiboMethSeq scores, despite being described as unmodified in the literature. These were therefore discarded. Blue dots indicate positions with scores above threshold values that represent plausible Nm modification sites. The cloverleaf to the right shows the canonical secondary tRNA structure along with tRNA-specific nucleotide position numbering, including extra (optional) residues 17a, 20a/20b in the D-loop as well as nucleotides e1-e27 in the variable tRNA loop/region. Positions relevant for Nm modification are shown as blue dots (pos 18, 32, 34, 39, 44 and 54).
Fig. 3
Fig. 3
AlkAnilineSeq mapping of m7G, m3C, and D sites in tRNAs. Panels A-D show plots of stop ratio scores with corresponding thresholds indicated by horizontal pink lines. Red and green dots indicate, known modified and unmodified sites, respectively, from the literature. Known unmodified sites were therefore discarded. Blue dots indicate sites having scores above threshold values that represent plausible m7G/m3C/D modification sites. The cloverleaf in panel E shows the canonical secondary tRNA structure along with tRNA-specific nucleotide position numbering, including extra (optional) residues 17a, 20a/20b in the D-loop as well as nucleotides e1-e27 in the variable tRNA loop/region. Positions relevant to m7G-modification violet dots (pos 46), m3C sites are in red (pos 20, 32 and e2), D sites are in yellow (pos 16, 17, 20, 20a and 47).
Fig. 4
Fig. 4
Experimentally mapped sites for m5C, 2’-O-methylation and m7G/m3C/D compared to data from the literature. (A-C) Relevance of applied threshold for detection of putatively modified sites (each dot represents one site) compared to known modified sites represented by green dots for BisulfiteSeq (A), blue dots for RiboMethSeq (B) and purple (m7G), gold (D) and orange (m3C) dots for AlkAnilineSeq (C). The respective thresholds are shown by colored horizontal lines: 0.228 for bisulfite non-conversion rate, 300 for the score Angle and 0.263 for stop ratio. Values correspond to score medians from 12 tRNA samples, 3 untreated and 3 treated with angiogenin for both cell lines. (D - F) Overlapping and exclusivity between tRNA sites known from the literature (“documented sites”, red circle) and tRNA sites detected through our workflow (“retained candidates”, blue circle). Panels represent data from BisulfiteSeq (D), RiboMethSeq (E) and AlkAnilineSeq (F), respectively.
Fig. 5
Fig. 5
Box plots showing modification levels for tRNAs and tsRNAs extracted from untreated and ANG-treated samples. Panels (A-J) correspond to untreated samples, while panels (K-T) show the results for ANG-treated cells. Modification levels for m5C (A, B, K, L), Nm (2’-O-Me) (C, D, M, N), m7G (E, F, O, P), m3C (G, H, Q, R) and dihydrouridine D (I, J, S, T) are shown. The values shown here are modification level medians of the respective detection scores obtained for three biological replicates.
Fig. 6
Fig. 6
Uptake and subcellular localization of ANG in MZ and SH cell lines. (A-B) Confocal images of the intracellular distribution of ANG in (A) SH-SY5Y cells and (B) MZ-294 cells following 3 h treatment with recombinant human ANG (500 ng/ml) or vehicle. The cytoplasm is stained with tubulin (red) and nucleus is stained with Hoechst (blue). Scale bars, 25 µm. Images are representative of n = 3 experiments.
Fig. 7
Fig. 7
Heatmaps for the assessment of modification changes in individual modified sites in tRNAs/tsRNAs. Each heatmap displays one specific modification’s stoichiometry across the different samples (in X-axis) and the different sites retained for analysis (in Y-axis). Panel A displays m5C stoichiometry through bisulfite non-conversion rate (NonConv) from BisulfiteSeq, Panel B is for 2’-O-methylation through MethScore (also known as Score C) from RiboMethSeq and Panels C, D, and E are respectively for m7G, m3C and D though stop ratio from AlkAnilineSeq (see Material and Methods for further details). This stoichiometry is color-coded depending on the detection method used. Each sample and each site are hierarchically clustered based on the Euclidean distances between each subset, represented by dendrograms at the bottom for samples and on the right for sites. Dendrograms have been colored based on 3 main cluster properties: blue for sites with high stoichiometry and low variation, red for sites with low stoichiometry and low variation and green for sites with high stoichiometry variability. 4 sites remained unclassified for RiboMethSeq due to their unique behavior.
Fig. 8
Fig. 8
Dot plots of the various sites labeled as category (iii) from the heatmaps. Left panels (A, C, E) for MZ cells, right panels (B, D, F) for SH cells. The nature of modified nucleotide is shown on the left, and the identity of tRNA/tsRNA site on the left of each panel. Color code indicates the identity of the sample (tRNA/tsRNA) and treatment with ANG.
Fig. 9
Fig. 9
(A-D) Positions of datasets in 4 orthogonal vectors resulting from a PCA of all data points. Each principal component consists of linear combinations of modification data. The numbering PC1 through PC4 is according to the share of data that accounts for data variability: PC1 48.5%, PC2 15.4%, PC3 11.7% PC4 10.7%. (E-G) Barplots of the main contributors (eigenvectors) strongly correlating (absolute correlation coefficient > 0.70) with principal components 2, 3 and 4, respectively. (H) Venn diagram of the different contributors of the principal components and their interpretation. All PC1 main contributors have been labeled as “tRNAs/tsRNAs differences”, PC2 as “Angiogenin impact” and PC3 as “Cell type”. Main contributors to PC4 show negligible data variability and their information content is therefore negligible for the case at hand.

Similar articles

Cited by

References

    1. Kishikawa H., Wu D., Hu G.F. Targeting angiogenin in therapy of amyotropic lateral sclerosis. Expert Opin Ther Targets. 2008;12(10):1229–1242. - PMC - PubMed
    1. Li G., et al. Distinct stress-dependent signatures of cellular and extracellular tRNA-derived small RNAs. Adv Sci. 2022;9(17) - PMC - PubMed
    1. Sanadgol N., et al. Experimental paradigms revisited: oxidative stress-induced tRNA fragmentation does not correlate with stress granule formation but is associated with delayed cell death. Nucleic Acids Res. 2022;50(12):6919–6937. - PMC - PubMed
    1. Rashad S., Tominaga T., Niizuma K. The cell and stress-specific canonical and noncanonical tRNA cleavage. J Cell Physiol. 2021;236(5):3710–3724. - PubMed
    1. Schaefer M., et al. RNA methylation by Dnmt2 protects transfer RNAs against stress-induced cleavage. Genes Dev. 2010;24(15):1590–1595. - PMC - PubMed