. 2023 Jan 3;12(1):201.
doi: 10.3390/cells12010201.

The E3 Ligase TRIM25 Impairs Apoptotic Cell Death in Colon Carcinoma Cells via Destabilization of Caspase-7 mRNA: A Possible Role of hnRNPH1

Affiliations

The E3 Ligase TRIM25 Impairs Apoptotic Cell Death in Colon Carcinoma Cells via Destabilization of Caspase-7 mRNA: A Possible Role of hnRNPH1

Usman Nasrullah et al. Cells. .

Abstract

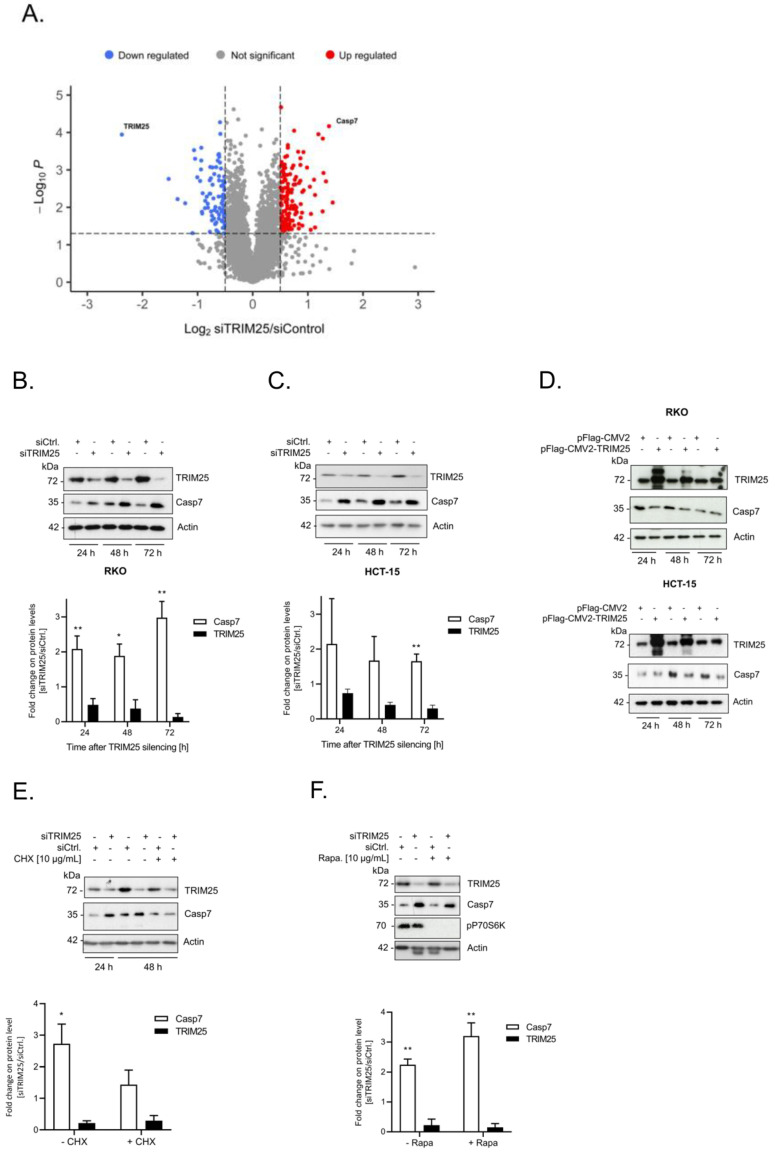
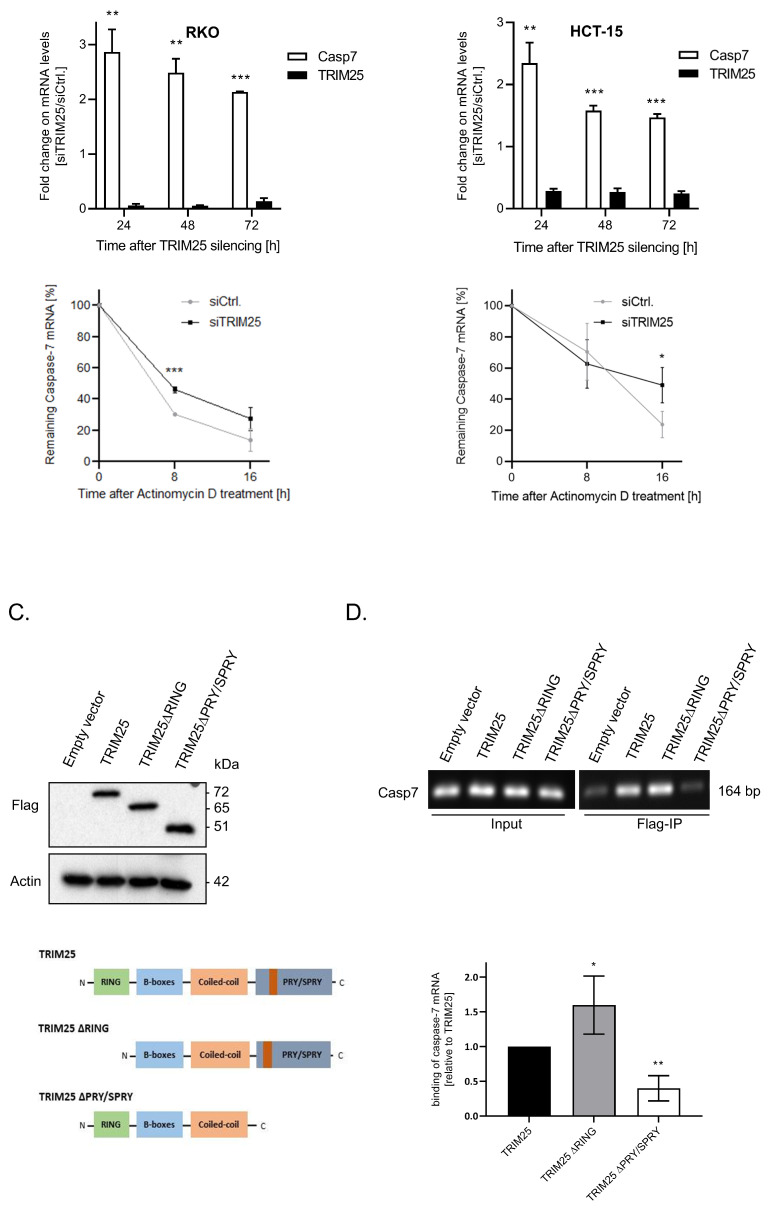
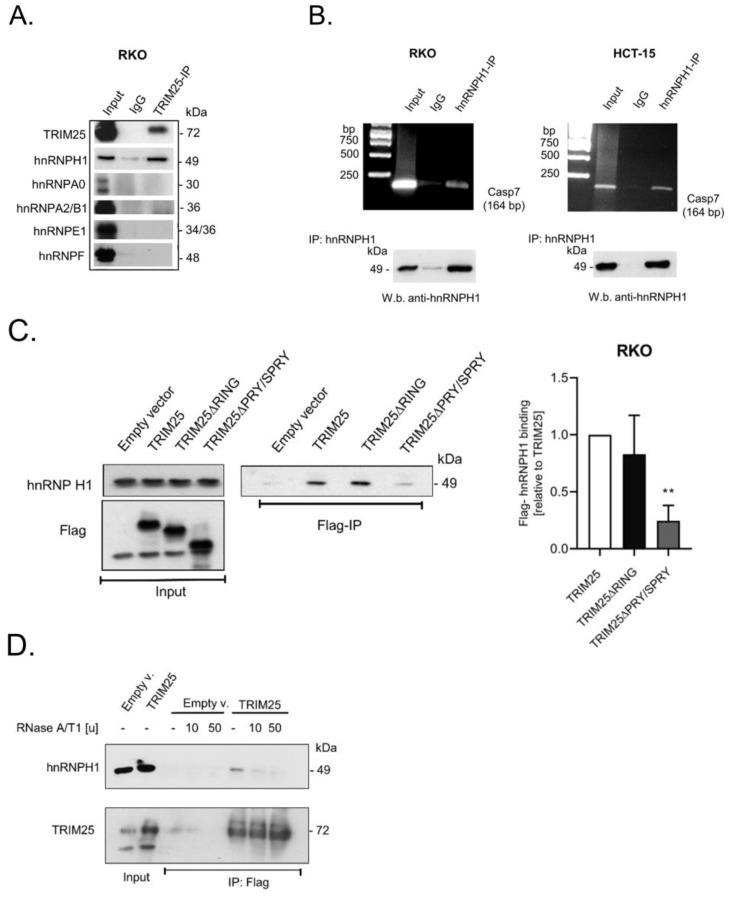
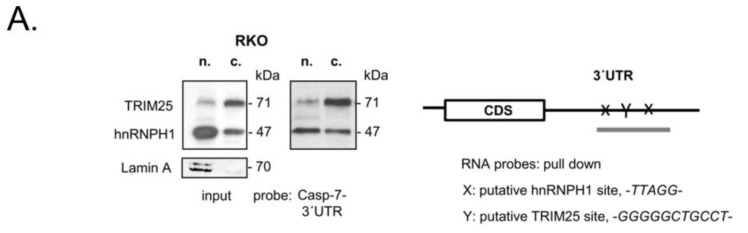
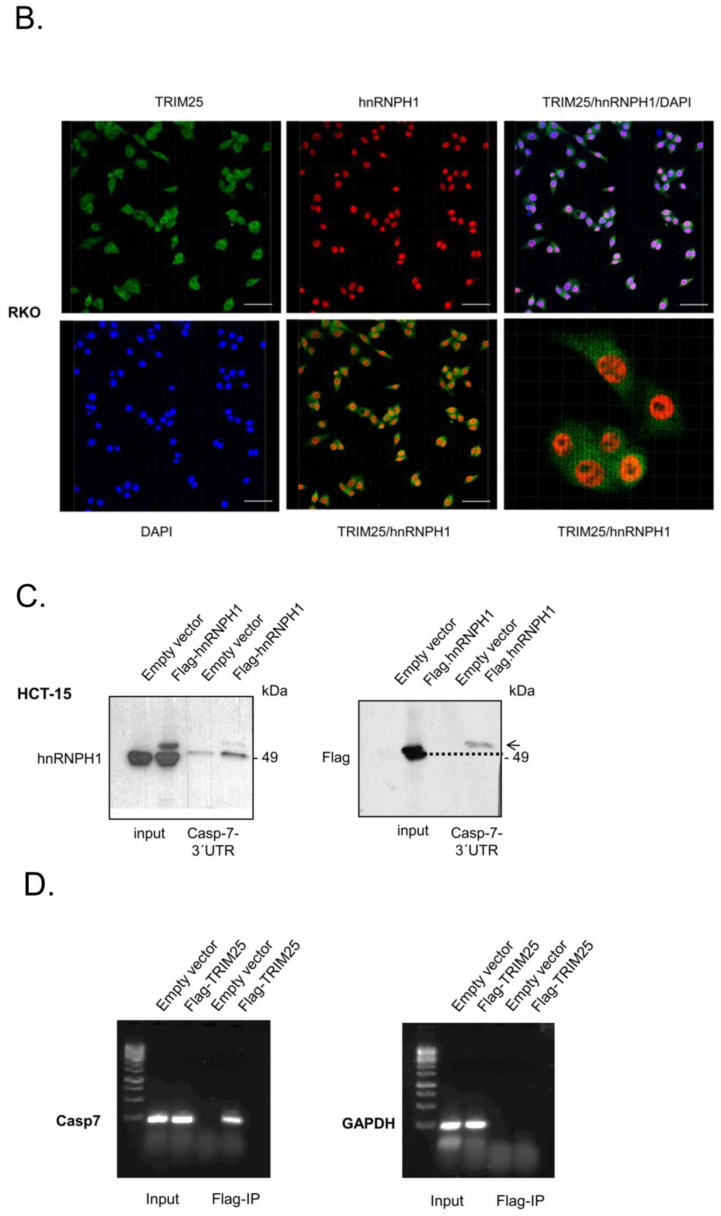
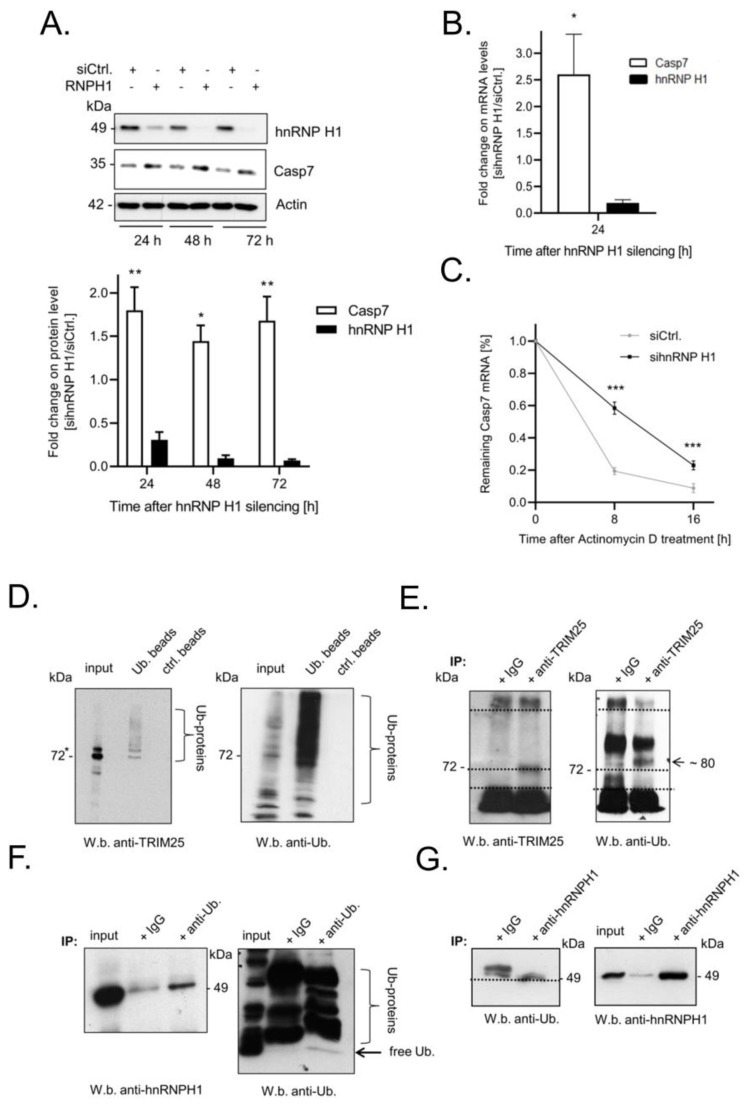
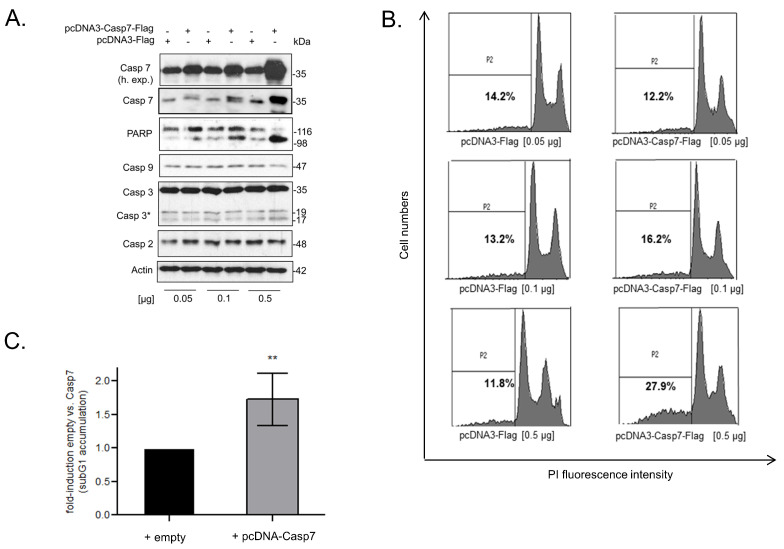
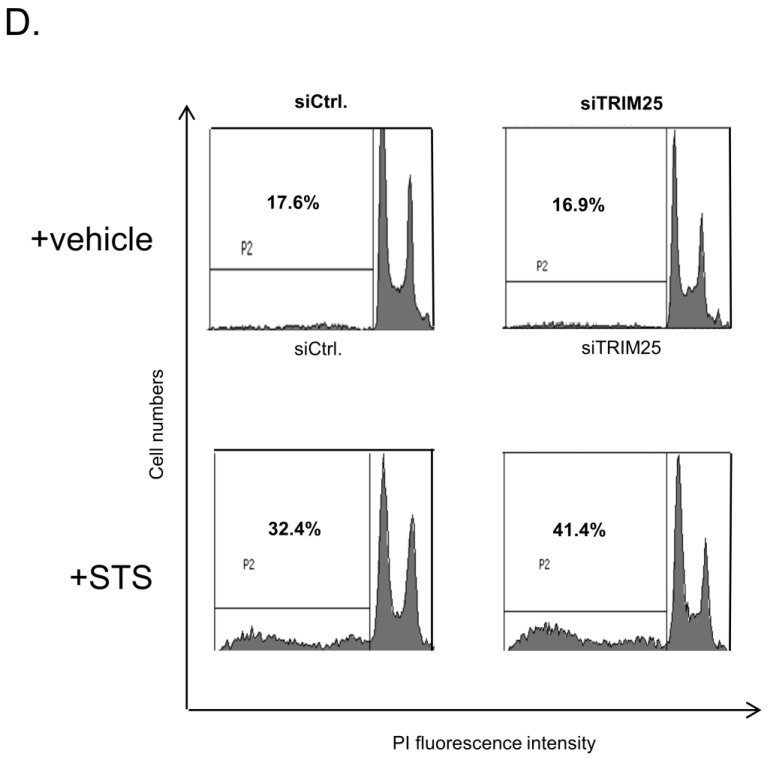
Therapy resistance is still a major reason for treatment failure in colorectal cancer (CRC). Previously, we identified the E3 ubiquitin ligase TRIM25 as a novel suppressor of caspase-2 translation which contributes to the apoptosis resistance of CRC cells towards chemotherapeutic drugs. Here, we report the executioner caspase-7 as being a further target of TRIM25. The results from the gain- and loss-of-function approaches and the actinomycin D experiments indicate that TRIM25 attenuates caspase-7 expression mainly through a decrease in mRNA stability. The data from the RNA pulldown assays with immunoprecipitated TRIM25 truncations indicate a direct TRIM25 binding to caspase-7 mRNA, which is mediated by the PRY/SPRY domain, which is also known to be highly relevant for protein-protein interactions. By employing TRIM25 immunoprecipitation, we identified the heterogeneous nuclear ribonucleoprotein H1 (hnRNPH1) as a novel TRIM25 binding protein with a functional impact on caspase-7 mRNA stability. Notably, the interaction of both proteins was highly sensitive to RNase A treatment and again depended on the PRY/SPRY domain, thus indicating an indirect interaction of both proteins which is achieved through a common RNA binding. Ubiquitin affinity chromatography showed that both proteins are targets of ubiquitin modification. Functionally, the ectopic expression of caspase-7 in CRC cells caused an increase in poly ADP-ribose polymerase (PARP) cleavage concomitant with a significant increase in apoptosis. Collectively, the negative regulation of caspase-7 by TRIM25, which is possibly executed by hnRNPH1, implies a novel survival mechanism underlying the chemotherapeutic drug resistance of CRC cells. The targeting of TRIM25 could therefore offer a promising strategy for the reduction in therapy resistance in CRC patients.

Keywords: RNA-binding proteins; TRIM25; apoptosis; caspase-7; colon carcinoma cells; hnRNPH1.


Conflict of interest statement

The authors declare no conflict of interest.

Figures

Figure 1
Figure 1
(AD). Silencing of TRIM25 is concomitant with elevated caspase-7 protein level. (A) Volcano plot diagram showing LC/MS data from the analysis of RKO cells transfected for 48 h with control siRNA duplexes (siCtrl.) versus cells transfected with siRNA duplexes of TRIM25 (n = 4). Colored dots depict significantly (p ≤ 0.01) upregulated (red) and downregulated (blue) proteins (fold changes ≥ or ≤ 0.5-fold). For clarity, only the positions of TRIM25 and caspase-7 are shown. (B,C). Time-dependent changes in caspase-7 protein level after TRIM25 knockdown. Subconfluent RKO (B) or HCT-15 (C) cells were transfected with control siRNA duplexes (siCtrl.) or with siRNA duplexes of TRIM25 (siTRIM25) for the indicated time periods before the content of caspase-7 (Casp7) was monitored by Western blot analysis with β-actin (Actin) as a loading control. Data in the lower panels represent means ± SD (n = 3) * p ≤ 0.05, ** p ≤ 0.01 caspase-7 contents in siTRIM25 vs. control siRNA transfectants, which were set as one-fold. (D) Time-dependent changes in caspase-7 protein levels after ectopic TRIM25 expression. Subconfluent RKO (upper panel) or HCT-15 (lower panel) cells were transfected either with 6 µg of empty pCMV-Flag vector (pFlag-CMV2) or, alternatively, with the same amount of Flag-tagged human TRIM25 (pFlag-CMV2-TRIM25) for the indicated time periods before the content of caspase-7 was monitored by Western blot analysis. (E,F). The increase in caspase-7 upon TRIM25 knockdown does not result from increased caspase-7 protein stability. Subconfluent RKO cells were transfected with siRNA duplexes of TRIM25 (siTRIM25) or control siRNA duplexes (siCtrl.) for 24 h before translation was blocked by the addition of (E) 10 µg/mL cycloheximide (+CHX) or, alternatively, with (F) 100 ng/mL of rapamycin (Rapa.) for a further 24 h. Thereafter, the cells were harvested and extracted for total protein lysates for analysis of TRIM25, caspase-7, or, additionally, for phospho-p70S6 kinase (F). Graphs show means ± SD (n = 3) * p ≤ 0.05, ** p ≤ 0.01 and depict fold changes in caspase-7 protein level in siTRIM25 versus control siRNA transfectants, which were set as one-fold.
Figure 2
Figure 2
(A,B), upper panels. Time course of steady-state mRNA levels of TRIM25 and caspase-7 after siRNA-mediated TRIM25 knockdown. Steady-state TRIM25 mRNA (black bars) and caspase-7 (Casp7) mRNA levels (open bars) in RKO (A) or HCT-15 (B) cells were measured by qPCR in relation to 18S RNA and are shown as a ratio of the mRNA contents in siTRIM25 vs. control siRNA transfectants, which were set as one-fold. Data represent means ± SD (n = 3), ** p ≤ 0.01 and *** p ≤ 0.005. (A,B), lower panels. Increased stability of caspase-7 mRNA after silencing of TRIM25 in RKO (A) and HCT-15 (B) cells. Twenty-four hours after siRNA transfection, the cells were washed and subsequently treated with actinomycin D (5.0 µg/mL). Remaining mRNA contents normalized to 18S RNA at the indicated time points and compared with the levels of normalized mRNA species measured immediately before the addition of actinomycin D (0 h) and which were set as 100% are depicted for both siRNA transfectants. Data represent means ± SD (n = 3), * p ≤ 0.05, *** p ≤ 0.005. (C,D). Twenty-four hours after transfection, cells were harvested for total protein lysates, and the expression level of different Flag-TRIM25 chimeric proteins (Flag) was controlled by Western blot analysis, and β-actin was used for a control of loading equal amount of protein (D). RNP-IP assays from total cell lysates of RKO cells ectopically expressing TRIM25 or different TRIM25 truncations depicted in (C). TRIM25-bound mRNA from total cell homogenates was isolated by using anti-Flag-M2 magnetic beads followed by RT-PCR. For PCR, primer pairs, complementary and specific to the coding region of caspase-7, were used. Caspase-7 mRNA was isolated before the IP and assessed by RT-PCR using the same primer pairs (input). The lower panel summarizes data from qPCR analysis from the same RT reactions (n = 3). * p ≤ 0.05, ** p ≤ 0.01 vs. wild-type TRIM25 (TRIM25) set as one-fold. Data represent means ± SD (n = 3).
Figure 3
Figure 3
HnRNPH1 is a TRIM25-interacting and caspase-7 mRNA-binding protein. (A) The physical interaction of endogenous TRIM25 with the indicated members of the hnRNP family was tested after immunoprecipitation (IP) of TRIM25 (TRIM25-IP) from RKO cells or, alternatively, after treatment with isotype specific control IgG (IgG). Input levels (input) were ascertained by Western blot analysis. (B) RNP-IP assays from total cell lysates of RKO (left panel) or HCT-15 (right panel) cells. HnRNPH1-bound mRNA was precipitated by the addition of hnRNPH1-specific antibodies (hnRNPH1-IP) or, alternatively, the same amount of isotype specific IgG (IgG) as a negative control. RNA samples were subsequently analyzed by semiquantitative RT-PCR using primer sets encompassing the coding region of caspase-7 (Casp7) and subsequent agarose gel electrophoretic detection. The specific IP of hnRNPH1 was validated by Western blot analysis (W.b.). (C) shTRIM25 RKO cells were transfected with pFlag-CMV2 vector (empty), pFlag-CMV2 encoding for TRIM25 (TRIM25), or the respective deletion mutant depicted in Figure 2C. Twenty-four hours after transfection, cells were harvested for total protein lysates and the expression levels of the Flag-tagged TRIM25 mutants were monitored by Western blotting. Equal hnRNPH1 levels were also confirmed by Western blot analysis. Flag-bound hnRNPH1 from total cell homogenates was isolated by using anti-Flag-M2 magnetic beads followed by Western blot analysis with anti-hnRNPH1 antibodies. The graph shown on the right panel summarizes data from independent co-IP experiments (n = 3). ** p ≤ 0.01 vs. wild-type TRIM25 (TRIM25) set as one-fold. (D). Treatment of cell lysates with the indicated amounts of RNase A/T1 prior to the IP reaction strongly impaired the interaction of endogenous hnRNPH1 with ectopically expressed Flag-TRIM25 (TRIM25). Flag-bound hnRNPH1 from total cell homogenates was isolated by using anti-Flag-M2 magnetic beads followed by Western blot analysis with anti-hnRNPH1 antibodies. Endogenous hnRNPH1 levels were assessed by Western blot analysis (input). The IP of equal TRIM25 levels and input levels of TRIM25 were also monitored by Western blot analysis.
Figure 4
Figure 4
Binding of TRIM25 and hnRNPH1 to the 3′UTR of caspase-7 mRNA. (A) Biotin pulldown assay demonstrating different binding affinities of TRIM25 and hnRNPH1 to the 3′UTR of caspase-7. Biotinylated transcripts (20 µg) encompassing putative binding sites for hnRNPH1 (x) and TRIM25 (Y) within the 3′UTR of caspase-7 as depicted on the right panel were incubated with 300 µg of nuclear (n.) or cytoplasmic (c.) cell extracts from RKO cells. Subsequently, TRIM25 and hnRNPH1 binding to the pulldown material as well as input levels (input) was monitored by immunoblotting. Lamin A was used as a marker for cell nuclei. (B) Intracellular TRIM25 (green) and hnRNPH1 (red) in RKO cells were visualized by confocal microscopy. Nuclei of RKO cells were visualized with DAPI (blue). Bar: 20 µm. (C) Total cell homogenates derived from RKO cells either transfected with empty (empty vector) or with Flag-tagged hnRNPH1 (Flag-hnRNPH1) were analyzed for caspase-7-3′UTR binding by biotin pulldown assay. Binding of hnRNPH1 in the pulldown material and the amount of input protein were monitored by Western blot analysis using hnRNPH1-specific (left panel) or anti-Flag antibodies (right panel), respectively. (D) Total cell lysates derived from the same lysates were analyzed for casp-7-3′UTR binding by RNP-IP assay. Flag-bound mRNAs were precipitated by using anti-Flag antibodies (Flag-IP). Subsequently, RNA samples were analyzed by semiquantitative RT-PCR using primers encompassing the coding region of caspase-7 mRNA (left panel) or GAPDH mRNA (right panel), the latter of which was used as a negative control. Input levels of both mRNAs were monitored by RT-PCR (input).
Figure 4
Figure 4
Binding of TRIM25 and hnRNPH1 to the 3′UTR of caspase-7 mRNA. (A) Biotin pulldown assay demonstrating different binding affinities of TRIM25 and hnRNPH1 to the 3′UTR of caspase-7. Biotinylated transcripts (20 µg) encompassing putative binding sites for hnRNPH1 (x) and TRIM25 (Y) within the 3′UTR of caspase-7 as depicted on the right panel were incubated with 300 µg of nuclear (n.) or cytoplasmic (c.) cell extracts from RKO cells. Subsequently, TRIM25 and hnRNPH1 binding to the pulldown material as well as input levels (input) was monitored by immunoblotting. Lamin A was used as a marker for cell nuclei. (B) Intracellular TRIM25 (green) and hnRNPH1 (red) in RKO cells were visualized by confocal microscopy. Nuclei of RKO cells were visualized with DAPI (blue). Bar: 20 µm. (C) Total cell homogenates derived from RKO cells either transfected with empty (empty vector) or with Flag-tagged hnRNPH1 (Flag-hnRNPH1) were analyzed for caspase-7-3′UTR binding by biotin pulldown assay. Binding of hnRNPH1 in the pulldown material and the amount of input protein were monitored by Western blot analysis using hnRNPH1-specific (left panel) or anti-Flag antibodies (right panel), respectively. (D) Total cell lysates derived from the same lysates were analyzed for casp-7-3′UTR binding by RNP-IP assay. Flag-bound mRNAs were precipitated by using anti-Flag antibodies (Flag-IP). Subsequently, RNA samples were analyzed by semiquantitative RT-PCR using primers encompassing the coding region of caspase-7 mRNA (left panel) or GAPDH mRNA (right panel), the latter of which was used as a negative control. Input levels of both mRNAs were monitored by RT-PCR (input).
Figure 5
Figure 5
(AC) Silencing of hnRNPH1 enhances caspase-7 expression via increasing the stability of caspase-7 mRNA. (A) Time-dependent changes in caspase-7 protein levels after hnRNPH1 knockdown. Subconfluent RKO cells were transfected with control siRNA duplexes (open bars) or with siRNA duplexes of hnRNPH1 (black bars) for the indicated time periods before the content of caspase-7 (open bars) was monitored by Western blot analysis. β-actin was used as a loading control. Data in the lower panel represent means ± SD (n = 3) * p ≤ 0.05, ** p ≤ 0.01 caspase-7 contents in sihnRNPH1 vs. control siRNA transfectants set as one-fold. (B) Steady-state mRNA levels of caspase-7 (open bar) after siRNA-mediated hnRNPH1 (black bar) knockdown were measured by quantitative real-time PCR in relation to 18S RNA levels and are shown as a ratio of the mRNA contents in sihnRNPH1 vs. control siRNA transfectants, which were set as one-fold. Data represent means ± SD (n = 3), * p ≤ 0.05. (C) Increased stability of caspase-7 mRNA after silencing of hnRNPH1 in RKO cells. Twenty-four hours after siRNA transfection, cells were washed before being treated with actinomycin D (5.0 µg/mL). The remaining mRNA contents were normalized to 18S RNA at the indicated time points and compared with the levels of normalized mRNA species measured immediately before the addition of actinomycin D (0 h) and which were set as 100%. Data represent means ± SD (n = 3), *** p ≤ 0.005. (DG) Detection of ubiquitinated proteins in RKO cells by using anti-ubiquitin antibody-linked beads (Ub beads) in comparison with control beads without linked antibodies (ctrl. beads). The co-immunoprecipitation of TRIM25 was analyzed by Western blot analysis (W.b.) using a TRIM25-specific antibody. Accordingly, precipitation of ubiquitinated proteins was confirmed by immunoblotting with a monoclonal Ub-specific antibody. Input level of TRIM25 and ubiquitinated proteins were also monitored by Western blot analysis. An immunopositive TRIM25 band migrating slightly above TRIM25 is indicated by an asterisk. (E) Reciprocally, immunoprecipitation (IP) of TRIM25 and subsequent Western blot analysis with a polyclonal anti-Ub-specific antibody showed a concise band at 80 kDa. Dotted lines indicate the different migration properties of TRIM25 vs. ubiquitinated TRIM25. (F) Detection of ubiquitinated hnRNPH1 was again analyzed by using a polyclonal ubiquitin-specific antibody (anti-Ub.) in comparison with isotypic IgG (IgG). A co-IP of hnRNPH1 was confirmed by Western blot analysis using an hnRNPH1-specific antibody. IP of ubiquitinated proteins (Ub-proteins) was confirmed by Western blot with an Ub-specific antibody. Input level of hnRNPH1 and ubiquitinated proteins were monitored by immunoblotting. (G) Supplementarily, the IP of hnRNPH1 and subsequent immunoblotting with anti-Ub-specific antibodies revealed a concise band at 49 kDa.
Figure 6
Figure 6
(AD) Functional consequences of caspase-7 for apoptotic cell death. (A) RKO cells were either transfected with the indicated amounts of cDNA coding for human caspase-7 (pcDNA3-Casp7-Flag) or, alternatively, with the same amount of empty vector (pcDNA3-Flag). Forty-eight hours after transfection, PARP-1 cleavage and the levels of the indicated precursor caspases were monitored by Western blot analysis, and β-actin was used as a loading control. Levels of pro-caspase-7 are additionally shown at a higher exposure (h. exp.), * p ≤ 0.05. (B) Accordingly, cells were transfected with increasing amounts of pcDNA3-Casp7 (grey bar) or with the same amount of empty vector (black bar), as indicated for 48 h before being subjected to flow cytometric analysis for determination of sub-G1 accumulation (P2) by propidium iodide (PI) staining. (C) Values represent means ± SD (n = 3). ** p ≤ 0.01 from transfections with 0.5 µg pcDNA3-Casp7-Flag (+ pcDNA-Casp7) vs. empty vector (+ empty) transfectants set as one-fold. (D) Silencing of TRIM25 increases staurosporine (STS)-induced accumulation of colon carcinoma cells in sub-G1 phase. RKO cells were transfected with control siRNA duplexes (siCtrl.) or with siRNA duplexes of TRIM25 (siTRIM25) for 48 h before being treated for 6 h with 250 nM of STS (+STS) or with vehicle (+vehicle). Sub-G1 arrest was analyzed by flow cytometry after PI staining. Values represent means % of sub-G1 accumulation ± SD (n = 3) siTRIM25 vs. siCtrl. (E,F) Impaired expression of casaspe-7 in CRC patients correlates with reduced survival. Kaplan–Meier overall survival curves of human CRC patients with low (blue lines, n = 410) vs. high (red lines, n = 187) caspase-7 based on data from the Human Protein Atlas [40]. (F) Comparison of expression levels of caspase-7 and hnRNPH1 in colorectal cancer tissues (n = 288) compared with solid normal colon tissues (n = 48), analyzed with the UCSC Xena browser (htpps://xena.ucsc.edu); accessed on 22 december 2022) [41] and based on TCGA data. Non-parametric Mann–Whitney U test was used to confirm statistical significance. **** p ≤ 0.0001.
Figure 6
Figure 6
(AD) Functional consequences of caspase-7 for apoptotic cell death. (A) RKO cells were either transfected with the indicated amounts of cDNA coding for human caspase-7 (pcDNA3-Casp7-Flag) or, alternatively, with the same amount of empty vector (pcDNA3-Flag). Forty-eight hours after transfection, PARP-1 cleavage and the levels of the indicated precursor caspases were monitored by Western blot analysis, and β-actin was used as a loading control. Levels of pro-caspase-7 are additionally shown at a higher exposure (h. exp.), * p ≤ 0.05. (B) Accordingly, cells were transfected with increasing amounts of pcDNA3-Casp7 (grey bar) or with the same amount of empty vector (black bar), as indicated for 48 h before being subjected to flow cytometric analysis for determination of sub-G1 accumulation (P2) by propidium iodide (PI) staining. (C) Values represent means ± SD (n = 3). ** p ≤ 0.01 from transfections with 0.5 µg pcDNA3-Casp7-Flag (+ pcDNA-Casp7) vs. empty vector (+ empty) transfectants set as one-fold. (D) Silencing of TRIM25 increases staurosporine (STS)-induced accumulation of colon carcinoma cells in sub-G1 phase. RKO cells were transfected with control siRNA duplexes (siCtrl.) or with siRNA duplexes of TRIM25 (siTRIM25) for 48 h before being treated for 6 h with 250 nM of STS (+STS) or with vehicle (+vehicle). Sub-G1 arrest was analyzed by flow cytometry after PI staining. Values represent means % of sub-G1 accumulation ± SD (n = 3) siTRIM25 vs. siCtrl. (E,F) Impaired expression of casaspe-7 in CRC patients correlates with reduced survival. Kaplan–Meier overall survival curves of human CRC patients with low (blue lines, n = 410) vs. high (red lines, n = 187) caspase-7 based on data from the Human Protein Atlas [40]. (F) Comparison of expression levels of caspase-7 and hnRNPH1 in colorectal cancer tissues (n = 288) compared with solid normal colon tissues (n = 48), analyzed with the UCSC Xena browser (htpps://xena.ucsc.edu); accessed on 22 december 2022) [41] and based on TCGA data. Non-parametric Mann–Whitney U test was used to confirm statistical significance. **** p ≤ 0.0001.

Similar articles

Cited by

References

    1. Lech G., Słotwiński R., Słodkowski M., Krasnodębski I.W. Colorectal cancer tumour markers and biomarkers: Recent therapeutic advances. World J. Gastroenterol. 2016;22:1745–1755. doi: 10.3748/wjg.v22.i5.1745. - DOI - PMC - PubMed
    1. Marley A.R., Nan H. Epidemiology of colorectal cancer. Int. J. Mol. Epidemiol. Genet. 2016;7:105–114. - PMC - PubMed
    1. Papamichael D., Audisio R.A., Glimelius B., de Gramont A., Glynne-Jones R., Haller D., Köhne C.H., Rostoft S., Lemmens V., Mitry E., et al. Treatment of colorectal cancer in older patients: International Society of Geriatric Oncology (SIOG) consensus recommendations 2013. Ann. Oncol. 2015;26:463–476. doi: 10.1093/annonc/mdu253. - DOI - PubMed
    1. Johnstone R.W., Ruefli A.A., Lowe S.W. Apoptosis: A link between cancer genetics and chemotherapy. Cell. 2002;108:153–164. doi: 10.1016/S0092-8674(02)00625-6. - DOI - PubMed
    1. McKenzie S., Kyprianou N. Apoptosis evasion: The role of survival pathways in prostate cancer progression and therapeutic resistance. J. Cell. Biochem. 2006;97:18–32. doi: 10.1002/jcb.20634. - DOI - PMC - PubMed

Publication types

Grants and funding

This work was supported by the Deutsche Forschungsgemeinschaft (EB 257/6-2; FuGG Project-ID: 403765277). U.N. was financially supported by grants from SFB 1039.

LinkOut - more resources