. 2022 Dec 26;12(1):91.
doi: 10.3390/cells12010091.

12- O-tetradecanoylphorbol-13-acetate Reduces Activation of Hepatic Stellate Cells by Inhibiting the Hippo Pathway Transcriptional Coactivator YAP

Affiliations

12- O-tetradecanoylphorbol-13-acetate Reduces Activation of Hepatic Stellate Cells by Inhibiting the Hippo Pathway Transcriptional Coactivator YAP

Chang Wan Kim et al. Cells. .

Abstract

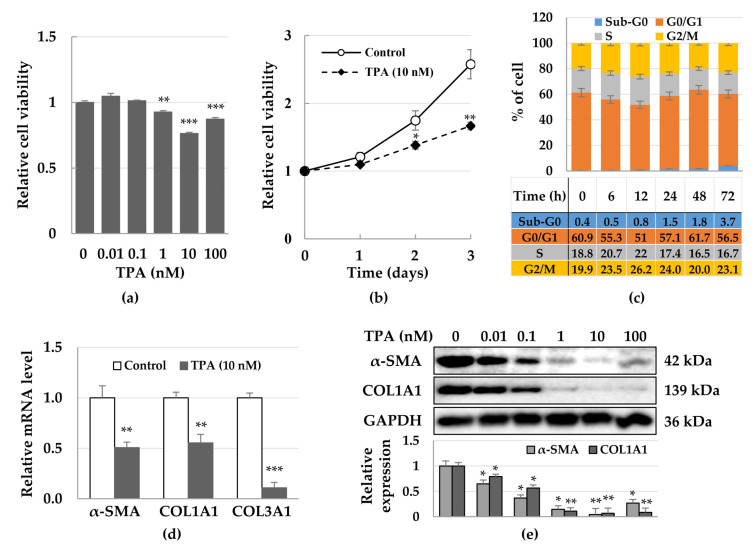
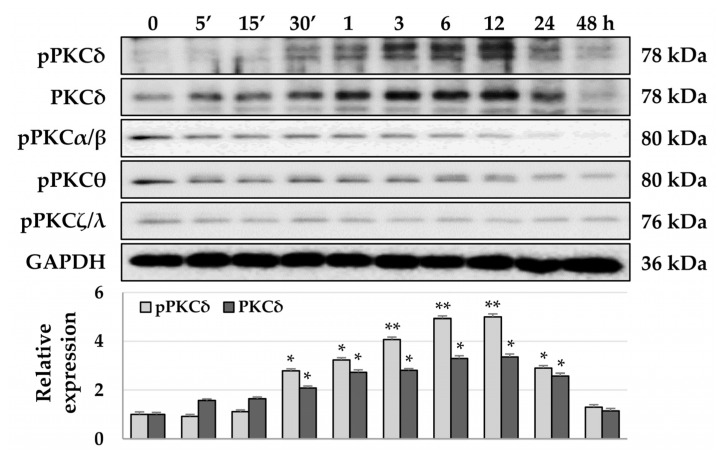
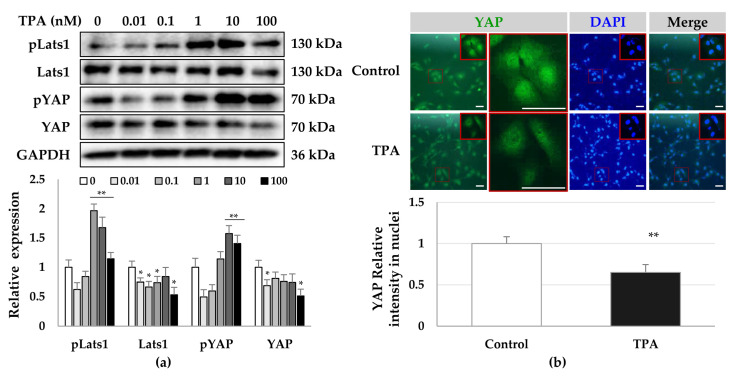
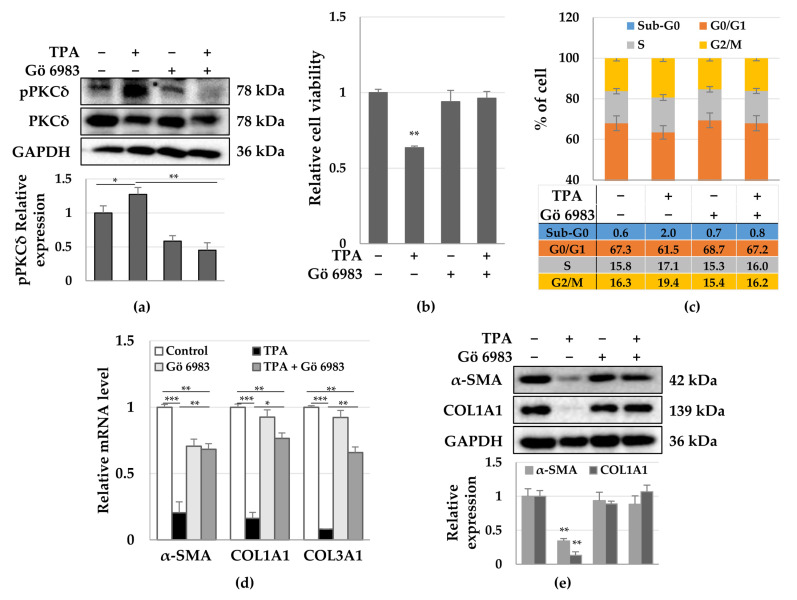
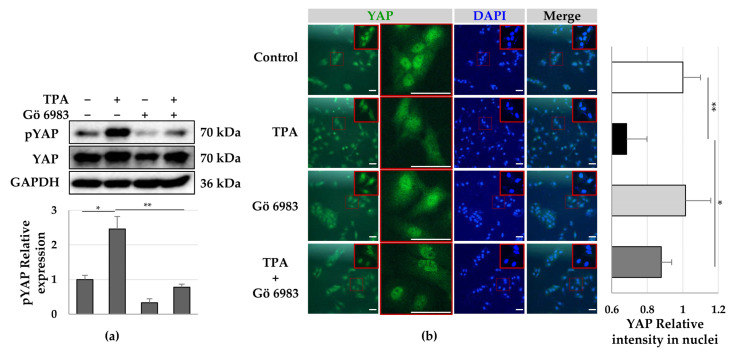
Although protein kinase C (PKC) regulates various biological activities, including cell proliferation, differentiation, migration, tissue remodeling, gene expression, and cell death, the antifibrotic effect of PKC in myofibroblasts is not fully understood. We investigated whether 12-O-tetradecanoylphorbol-13-acetate (TPA), a PKC activator, reduced the activation of hepatic stellate cells (HSCs) and explored the involvement of the Hippo pathway transcriptional coactivator YAP. We analyzed the effect of TPA on the proliferation and expression of α-smooth muscle actin (SMA) in the LX-2 HSC line. We also analyzed the phosphorylation of the Hippo pathway molecules YAP and LATS1 and investigated YAP nuclear translocation. We examined whether Gö 6983, a pan-PKC inhibitor, restored the TPA-inhibited activities of HSCs. Administration of TPA decreased the growth rate of LX-2 cells and inhibited the expression of α-SMA and collagen type I alpha 1 (COL1A1). In addition, TPA induced phosphorylation of PKCδ, LATS1, and YAP and inhibited the nuclear translocation of YAP compared with the control. These TPA-induced phenomena were mostly ameliorated by Gö 6983. Our results indicate that PKCδ exerts an antifibrotic effect by inhibiting the Hippo pathway in HSCs. Therefore, PKCδ and YAP can be used as therapeutic targets for the treatment of fibrotic diseases.

Keywords: 12-O-tetradecanoylphorbol-13-acetate; Yes-associated protein 1; hepatic stellate cell; protein kinase Cδ.


Conflict of interest statement

The authors declare no conflict of interest.

Figures

Figure 1
Figure 1
Inhibition of growth and expression of α-SMA in TPA-treated LX-2 cells. LX-2 cells were treated with up to 100 nM TPA for 2 days and then cell viability and expression of α-SMA were analyzed using MTT assay and immunoblotting, respectively. On day 2, mRNA expression was assessed using qPCR, while the cell cycle was examined at the indicated timepoints using flow cytometry. (a) LX-2 cell viability according to TPA concentration. Data are presented as the mean ± SD of four independent experiments. ** p ≤ 0.01 and *** p < 0.001. (b) Proliferation of LX-2 cells treated with 10 nM TPA. Data are presented as the mean ± SD of four independent experiments. * p ≤ 0.05 and ** p ≤ 0.01. (c) Cell cycles of TPA-treated LX-2 cells over time. The percentage of cells was analyzed using 2 × 10⁴ cells in indicated timepoints. Data are presented as the mean ± SD of three independent experiments. (d) Expression of α-SMA, COL1A1, and COL3A1 mRNA in TPA-treated LX-2 cells. All qPCR reactions were performed in triplicates. Expression of GAPDH was used for normalization. The 2−(ΔΔCq) method was used to calculate relative fold changes in mRNA expression. (e) Expression of α-SMA and COL1A1 in TPA-treated LX-2 cells. Data of (d,e) are presented as the mean ± SD of three independent experiments. * p ≤ 0.05, ** p ≤ 0.01, and *** p < 0.001.
Figure 2
Figure 2
Phosphorylation of PKCs in TPA-treated LX-2 cells. LX-2 cells were treated with 10 nM TPA for the indicated time, and PKC phosphorylation was detected using the phospho-PKC antibody sampler kit (cell signaling technology). As only the phosphorylation of PKCδ was increased in TPA-treated LX-2 cells, we further confirmed the expression of total PKCδ. The intensity of protein expression was quantified using densitometry with Image J and its relative expression was normalized against that of GAPDH. Data are presented as the mean ± SD of three independent experiments. * p ≤ 0.05 and ** p ≤ 0.01.
Figure 3
Figure 3
Phosphorylation and cellular distribution of YAP in TPA-treated LX-2 cells. LX-2 cells were treated with TPA (0.01–100 nM) for 24 h. The phosphorylation and cellular distribution of YAP were detected using immunoblotting and immunocytochemistry, respectively, in LX-2 cells treated with 10 nM TPA for 24 h. (a) Phosphorylation of LATS1 and YAP in LX-2 cells. The intensity of protein expression was quantified using densitometry with Image J and its relative expression was normalized against that of GAPDH. Data are presented as the mean ± SD of three independent experiments. * p ≤ 0.05 and ** p ≤ 0.01. (b) Cellular distribution of YAP in TPA-treated LX-2 cells. The nuclear fluorescence intensity of YAP was quantified using densitometry with Image J. Nuclear fluorescence intensity was analyzed from three random fields, with over 30 cells counted per field. Data are presented as the mean ± SD of three independent experiments. ** p ≤ 0.01. Scale bar, 20 μm.
Figure 4
Figure 4
Effects of the pan-PKC inhibitor Gö 6983 on the proliferation and fibrosis of TPA-treated LX-2 cells. LX-2 cells were treated with TPA (10 nM) or Gö 6983 (1 μM) or both, and then cell viability, cell cycle, and expression of α-SMA were analyzed. (a) PKCδ phosphorylation in LX-2 cells treated with TPA, Gö 6983, or both for 12 h. The intensity of pPKCδ was quantified using densitometry with Image J and its relative expression was normalized against that of GAPDH. Data are presented as the mean ± SD of three independent experiments. * p ≤ 0.05 and ** p ≤ 0.01. (b) LX-2 cell viability after treatment with TPA or Gö 6983 or both for 48 h. Data are presented as the mean ± SD of four independent experiments. ** p ≤ 0.01. (c) Cell cycles of LX-2 cells treated with TPA or Gö 6983 or both. The percentage of cells was analyzed using 2 × 10⁴ cells treated with TPA or Gö 6983 or both for 12 h. Data are presented as the mean ± SD of three independent experiments. (d) Expression of α-SMA, COL1A1, and COL3A1 mRNA in LX-2 cells treated with TPA or Gö 6983 or both for 48 h. All qPCR reactions were performed in triplicates. Expression of GAPDH was used for normalization. The 2−(ΔΔCq) method was used to calculate relative fold changes in mRNA expression. Data are presented as the mean ± SD of three independent experiments. * p ≤ 0.05, ** p ≤ 0.01, and *** p < 0.001. (e) Expression of α-SMA and COL1A1 in LX-2 cells treated with TPA or Gö 6983 or both for 48 h. * p ≤ 0.05, ** p ≤ 0.01, and *** p < 0.001. The intensity of protein expression was quantified using densitometry with Image J and its relative expression was normalized against that of GAPDH. Data are presented as the mean ± SD of three independent experiments. ** p ≤ 0.01.
Figure 5
Figure 5
Phosphorylation and cellular distribution of YAP in LX-2 cells treated with TPA or Gö 6983 or both. LX-2 cells were treated with TPA (10 nM) or Gö 6983 (1 μM) or both for 24 h. The phosphorylation and cellular distribution of YAP were detected using immunoblotting and immunocytochemistry, respectively. (a) YAP phosphorylation in LX-2 cells. The intensity of pYAP was quantified using densitometry with Image J and its relative expression was normalized against that of GAPDH. Data are presented as the mean ± SD of three independent experiments. * p ≤ 0.05 and ** p ≤ 0.01. (b) Cellular distribution of YAP in LX-2 cells treated with TPA or Gö 6983 or both. The nuclear fluorescence intensity of YAP was quantified using densitometry with Image J. Nuclear fluorescence intensity was analyzed from three random fields, with over 30 cells counted per field. Data are presented as the mean ± SD of three independent experiments. * p ≤ 0.05 and ** p ≤ 0.01. Scale bar, 20 μm.

Similar articles

Cited by

References

    1. Reynaert H., Thompson M.G., Thomas T., Geerts A. Hepatic stellate cells: Role in microcirculation and pathophysiology of portal hypertension. Gut. 2002;50:571–581. doi: 10.1136/gut.50.4.571. - DOI - PMC - PubMed
    1. Geerts A. History, heterogeneity, developmental biology, and functions of quiescent hepatic stellate cells. Semin. Liver Dis. 2001;21:311–335. doi: 10.1055/s-2001-17550. - DOI - PubMed
    1. Friedman S.L. Hepatic stellate cells: Protean, multifunctional, and enigmatic cells of the liver. Physiol. Rev. 2008;88:125–172. doi: 10.1152/physrev.00013.2007. - DOI - PMC - PubMed
    1. Trivedi P., Wang S., Friedman S.L. The Power of Plasticity-Metabolic Regulation of Hepatic Stellate Cells. Cell Metab. 2021;33:242–257. doi: 10.1016/j.cmet.2020.10.026. - DOI - PMC - PubMed
    1. Baghaei K., Mazhari S., Tokhanbigli S., Parsamanesh G., Alavifard H., Schaafsma D., Ghavami S. Therapeutic potential of targeting regulatory mechanisms of hepatic stellate cell activation in liver fibrosis. Drug Discov. Today. 2022;27:1044–1061. doi: 10.1016/j.drudis.2021.12.012. - DOI - PubMed

Publication types

MeSH terms

Substances

Grants and funding

This research was funded by the Basic Science Research Program through the National Research Foundation of Korea (NRF) (grant nos. 2021R1I1A1A01056265 and 2021R1F1A1064613).