. 2023 Jan;55(1):120-131.
doi: 10.1038/s12276-022-00909-7. Epub 2023 Jan 6.

Cdon suppresses vascular smooth muscle calcification via repression of the Wnt/Runx2 Axis

Affiliations

Cdon suppresses vascular smooth muscle calcification via repression of the Wnt/Runx2 Axis

Byeong-Yun Ahn et al. Exp Mol Med. 2023 Jan.

Abstract

Osteogenic transdifferentiation of vascular smooth muscle cells (VSMCs) is a risk factor associated with vascular diseases. Wnt signaling is one of the major mechanisms implicated in the osteogenic conversion of VSMCs. Since Cdon has a negative effect on Wnt signaling in distinct cellular processes, we sought to investigate the role of Cdon in vascular calcification. The expression of Cdon was significantly downregulated in VSMCs of the aortas of patients with atherosclerosis and aortic stenosis. Consistently, calcification models, including vitamin D3 (VD3)-injected mice and VSMCs cultured with calcifying media, exhibited reduced Cdon expression. Cdon ablation mice (cKO) exhibited exacerbated aortic stiffness and calcification in response to VD3 compared to the controls. Cdon depletion induced the osteogenic conversion of VSMCs accompanied by cellular senescence. The Cdon-deficient aortas showed a significant alteration in gene expression related to cell proliferation and differentiation together with Wnt signaling regulators. Consistently, Cdon depletion or overexpression in VSMCs elevated or attenuated Wnt-reporter activities, respectively. The deletion mutant of the second immunoglobulin domain (Ig2) in the Cdon ectodomain failed to suppress Wnt signaling and osteogenic conversion of VSMCs. Furthermore, treatment with purified recombinant proteins of the entire ectodomain or Ig2 domain of Cdon displayed suppressive effects on Wnt signaling and VSMC calcification. Our results demonstrate a protective role of Cdon in VSMC calcification by suppressing Wnt signaling. The Ig2 domain of Cdon has the potential as a therapeutic tool to prevent vascular calcification.


Conflict of interest statement

The authors declare no competing interests.

Figures
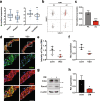
Fig. 1
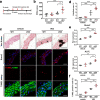
Fig. 1. Cdon expression is reduced in calcified aortas.
a Scatterplots of Cdon expression in aortic samples from patients with atherosclerotic plaques (GSE43292, n = 32) and calcified aortas (GSE12644 and GSE83453, n = 22). Statistical significance was determined with a two-tailed Student’s t-test. **P < 0.01. b Uniform manifold approximation and projection (UMAP) visualization of VSMCs (upper box: all genes in VSMCs, bottom box: only Cdon expression in VSMCs) in calcified atherosclerotic core plaques (AC) and patient-matched proximal adjacent portions (PA) of the carotid artery (GSE159677, n = 3). c Cdon expression in PA VSMCs and AC VSMCs (n = 3). Statistical significance was determined with a two-tailed Student’s t-test. ***P < 0.005. d Representative immunostaining images of Cdon and αSMA in aortas injected with VD3. Scale bar: 100 μm (top) and 50 μm (bottom). e Quantification of the intensity of Cdon fluorescence normalized to the intensity of αSMA, as shown in Panel d (n = 4). Data represent the means ± SEMs analyzed by Student’s t-test. *P < 0.05. f Relative RNA expression level of Cdon in aortic samples from VD3-injected mice (n = 3). Data represent the means ± SEMs analyzed by Student’s t-test. **P < 0.01. g Immunoblot analysis of VSMCs cultured with CM. h The relative RNA expression of Cdon in CM-treated VSMCs. Data represent the means ± SEMs analyzed by Student’s t-test. *P < 0.05.
Fig. 2
Fig. 2. Cdon deficiency aggravates aortic stenosis and calcification.
a The experimental scheme to induce vascular calcification in WT or Cdon-deficient aortas. cKO mice were generated by tmx injection. WT or cKO mice were injected subcutaneously with VD3 three times as indicated. b Echocardiographic parameters for aortic stenosis: pulse wave velocity (PWV) in the vehicle- or VD3-injected WT or cKO mice (n = 5). Data represent the means ± SEMs analyzed by one-way ANOVA. *P < 0.05, ***P < 0.005. c Representative images of Von Kossa staining and immunostaining for Runx2 and TUNEL assays in the vehicle- or VD3-treated WT or cKO aortas. Scale bar: 100 μm (top), 40 μm (middle), and 20 μm (bottom). d Quantification of the calcified area in the vehicle- or VD3-treated aortas as shown in panel (c) (n = 4). Data represent the means ± SEMs analyzed by one-way ANOVA. **P < 0.01, ***P < 0.005. e Relative RNA expression of osteogenic markers in the vehicle- or VD3-treated WT or cKO aortas (n = 3). Data represent the means ± SEMs analyzed by one-way ANOVA. *P < 0.05, **P < 0.01, ***P < 0.005. f Quantification of the number of TUNEL-positive VSMCs in the WT or cKO mice treated with vehicle or VD3 (n = 3), as shown in panel (c). Data represent the means ± SEMs analyzed by one-way ANOVA. **P < 0.01. ***P < 0.005.
Fig. 3
Fig. 3. Cdon depletion induces the transition of VSMCs to osteoblast-like cells.
a Immunoblot analysis of VSMCs infected with shCont- or shCdon-expressing lentivirus. b Representative Alizarin Red staining images of the shCont- or shCdon-transduced VSMCs. Scale bar:100 μm. c Quantification of Alizarin Red staining in the VSMCs transduced with shCont- or shCdon-lentiviruses shown in panel (b). (n = 3). Data represent the means ± SEMs analyzed by Student’s t-test. ***P < 0.005. d Relative transcript levels of osteogenic markers and foam cell markers in control or Cdon-depleted VSMCs (n = 3). Data represent the means ± SEMs analyzed by Student’s t-test. **P < 0.01, ***P < 0.005. n.s. = not significant. e Representative images of senescence-associated β-galactosidase (SA-β-gal) staining in the control or Cdon-deficient VSMCs. Scale bar: 100 μm. f Quantification of the number of SA-β-gal-positive cells shown in panel (e) (n = 4). Data represent the means ± SEMs analyzed by Student’s t-test. ***P < 0.005. g Relative transcript levels of cellular senescence markers in the control or Cdon-deficient VSMCs (n = 3). Data represent the means ± SEMs analyzed by Student’s t-test. *P < 0.05, ***P < 0.005.
Fig. 4
Fig. 4. Cdon-deficient aortas display alterations in genes related to cell proliferation and differentiation accompanied by Wnt signaling components.
a The experimental scheme for the RNA-sequencing analysis using RNAs from the aortas of the vehicle-treated WT (WC), VD3-treated WT (WV), and VD3-treated cKO (KV) groups for 1 day. b Venn diagram for shared or distinct gene numbers among the differentially expressed genes in WV vs. WC and KV vs. WV (n = 2, with biological repeats, >1.3-fold, normalized with |RC|log2 > 2, p < 0.05). c Enriched GO terms in biological process terms of 349 VD3-mediated unique genes (top) or 275 Cdon-dependent VD3-regulated genes (bottom) by GSEA. d Heatmap showing the gene expression pattern of three gene sets (cell differentiation, cell proliferation, and gene expression). The red letter indicates the regulator of the Wnt signaling pathway. e Comparison of gene expression levels of the Wnt signaling pathway between WV and KV. f Relative transcript levels (n = 3). Data represent the means ± SEMs analyzed by one-way ANOVA. *P < 0.05, ***P < 0.01.
Fig. 5
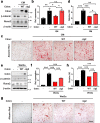
Fig. 5. Cdon-depleted VSMCs activate the Wnt signaling pathway.
a Relative Axin2 transcript levels in the vehicle- and VD3-treated aortas (n = 3). Data represent the means ± SEMs analyzed by one-way ANOVA. *P < 0.05, **P < 0.01. b Relative Axin2 transcript levels in the control or Cdon-deficient cells (n = 3). Data represent the means ± SEMs analyzed by Student’s t-test. *P < 0.05. c Immunoblot analysis of the shCont- or shCdon lentivirus-infected VSMCs. d Top-flash reporter activity of the control or Cdon-depleted VSMCs in response to Wnt3a (n = 3). Data represent the means ± SEMs analyzed by one-way ANOVA. *P < 0.05, **P < 0.01. e Immunoblot analysis of the shCont- or shCdon-infected VSMCs in response to DMSO or XAV939. f Relative Axin2 expression in control- or Cdon-overexpressing VSMCs treated with Wnt3a (n = 3). Data represent the means ± SEMs analyzed by one-way ANOVA. **P < 0.01, ***P < 0.005. g The TopFlash reporter activity of the control- or Cdon-overexpressing VSMCs in response to Wnt3a (n = 3). Data represent the means ± SEMs analyzed by Student’s t-test and one-way ANOVA. ***P < 0.005. h Immunoblot analysis of the control- or Cdon-overexpressing VSMCs in response to Wnt3a.
Fig. 6
Fig. 6. Cdon overexpression attenuates the osteogenic conversion of VSMCs in response to CM.
a Immunoblot analysis of the control- or Cdon-overexpressing VSMCs in response to CM. b TopFlash reporter activity in control- or Cdon-overexpressing VSMCs in response to CM (n = 3). Data represent the means ± SEMs analyzed by one-way ANOVA. **P < 0.01. c Relative RNA expression of Axin2, Runx2, and ALPL in control- or Cdon-overexpressing VSMCs treated with CM (n = 3). Data represent the means ± SEMs analyzed by one-way ANOVA. *P < 0.05, **P < 0.01, and ***P < 0.005. d Alizarin Red staining images of the control- or Cdon-overexpressing VSMCs in response to CM. Scale bar: 100 μm. e Quantification of Alizarin Red staining in the VSMCs shown in panel (d) (n = 3). Data represent the means ± SEMs analyzed by one-way ANOVA. *P < 0.05, ***P < 0.005.
Fig. 7
Fig. 7. The deletion of the Ig2 domain of Cdon fails to block VSMC osteogenic conversion.
a Immunoblot analysis of the VSMCs expressing control, full-length Cdon or Ig2 domain-deleted Cdon (ΔIg2) treated with vehicle or CM. b Relative Axin2 expression in control-, Cdon-, or ΔIg2-expressing VSMCs in response to CM (n = 3). Data represent the means ± SEMs analyzed by one-way ANOVA. n.s. = not significant, *P < 0.05, **P < 0.01. c Alizarin Red staining of the control-, Cdon-, or ΔIg2-expressing VSMCs in response to CM. Scale bar: 100 μm. d Quantification of Alizarin Red staining shown in panel (c) (n = 3). Data represent the means ± SEMs analyzed by one-way ANOVA. *P < 0.05, ***P < 0.005, ***P < 0.005. e Immunoblot analysis of the VSMCs expressing control, full-length Cdon or Ig2 domain-deleted Cdon (ΔIg2) treated with vehicle or Wnt3a. f Relative Axin2 expression in the control-, Cdon-, or ΔIg2-expressing VSMCs in response to Wnt3a (n = 3). Data represent the means ± SEMs analyzed by one-way ANOVA. ***P < 0.005. g Alizarin Red staining of the control-, Cdon-, or ΔIg2-expressing VSMCs in response to Wnt3a. Scale bar: 100 μm. h Quantification of Alizarin Red staining shown in panel (g) (n = 3). Data represent the means ± SEMs analyzed by one-way ANOVA. ***P < 0.005.
Fig. 8
Fig. 8. The Ig2 domain of Cdon is sufficient to attenuate the osteogenic conversion of VSMCs.
a Immunoblot analysis of Cdon-Fc (the entire Cdon ectodomain fused to Fc) and Ig2-Fc (Ig2 domain fused to Fc) purified from cell supernatants. b Immunoblot analysis of VSMCs treated with CM and each purified protein. IgG served as a control. c Alizarin Red staining images of the VSMCs treated with control or CM in combination with Cdon-Fc, Ig2-Fc, or IgG. Scale bar = 100 μm. d Quantification of Alizarin Red staining shown in panel (c) (n = 3). Data represent the means ± SEMs analyzed by one-way ANOVA. ***P < 0.005. e Relative transcript levels of Axin2, Runx2, and ALPL in the VSMCs treated with control or CM in combination with Cdon-Fc, Ig2-Fc, or IgG.

Similar articles

Cited by

References

    1. Steucke KE, Tracy PV, Hald ES, Hall JL, Alford PW. Vascular smooth muscle cell functional contractility depends on extracellular mechanical properties. J. Biomech. 2015;48:3044–3051. - PMC - PubMed
    1. Shi N, Mei X, Chen SY. Smooth muscle cells in vascular remodeling. Arterioscler. Thromb. Vasc. Biol. 2019;39:e247–e252. - PMC - PubMed
    1. Petsophonsakul P, et al. Role of vascular smooth muscle cell phenotypic switching and calcification in aortic aneurysm formation. Arterioscler. Thromb. Vasc. Biol. 2019;39:1351–1368. - PubMed
    1. Durham AL, Speer MY, Scatena M, Giachelli CM, Shanahan CM. Role of smooth muscle cells in vascular calcification: implications in atherosclerosis and arterial stiffness. Cardiovasc. Res. 2018;114:590–600. - PMC - PubMed
    1. Vazquez-Padron RI, et al. Aging exacerbates neointimal formation, and increases proliferation and reduces susceptibility to apoptosis of vascular smooth muscle cells in mice. J. Vasc. Surg. 2004;40:1199–1207. - PubMed

Publication types

LinkOut - more resources