Inefficient exploitation of accessory receptors reduces the sensitivity of chimeric antigen receptors
- PMID: 36598945
- PMCID: PMC9926289
- DOI: 10.1073/pnas.2216352120
Inefficient exploitation of accessory receptors reduces the sensitivity of chimeric antigen receptors
Abstract
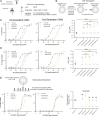
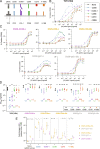
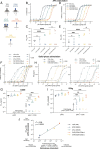
Chimeric antigen receptors (CARs) can redirect T cells to target abnormal cells, but their activity is limited by a profound defect in antigen sensitivity, the source of which remains unclear. Here, we show that CARs have a > 100-fold lower antigen sensitivity compared to the T cell receptor (TCR) when antigen is presented on antigen-presenting cells (APCs) but nearly identical sensitivity when antigen is presented as purified protein. We next systematically measured the impact of engaging important T cell accessory receptors (CD2, LFA-1, CD28, CD27, and 4-1BB) on antigen sensitivity by adding their purified ligands. Unexpectedly, we found that engaging CD2 or LFA-1 improved the antigen sensitivity of the TCR by 125- and 22-fold, respectively, but improved CAR sensitivity by only < 5-fold. This differential effect of CD2 and LFA-1 engagement on the TCR vs. CAR was confirmed using APCs. We found that sensitivity to antigen can be partially restored by fusing the CAR variable domains to the TCR CD3ε subunit (also known as a TRuC) and fully restored by exchanging the TCRαβ variable domains for those of the CAR (also known as STAR or HIT). Importantly, these improvements in TRuC and STAR/HIT sensitivity can be predicted by their enhanced ability to exploit CD2 and LFA-1. These findings demonstrate that the CAR sensitivity defect is a result of their inefficient exploitation of accessory receptors and suggest approaches to increase sensitivity.
Keywords: T cells; adhesion receptors; antigen sensitivity; chimeric antigen receptors.
Conflict of interest statement
The authors declare no competing interest.
Figures


Similar articles
-
Combined CD28 and 4-1BB Costimulation Potentiates Affinity-tuned Chimeric Antigen Receptor-engineered T Cells.Clin Cancer Res. 2019 Jul 1;25(13):4014-4025. doi: 10.1158/1078-0432.CCR-18-2559. Epub 2019 Apr 12. Clin Cancer Res. 2019. PMID: 30979735 Free PMC article.
-
In Vivo Expansion and Antitumor Activity of Coinfused CD28- and 4-1BB-Engineered CAR-T Cells in Patients with B Cell Leukemia.Mol Ther. 2018 Apr 4;26(4):976-985. doi: 10.1016/j.ymthe.2018.01.022. Epub 2018 Feb 2. Mol Ther. 2018. PMID: 29503204 Free PMC article. Clinical Trial.
-
Using CombiCells, a platform for titration and combinatorial display of cell surface ligands, to study T-cell antigen sensitivity modulation by accessory receptors.EMBO J. 2024 Jan;43(1):132-150. doi: 10.1038/s44318-023-00012-1. Epub 2023 Dec 18. EMBO J. 2024. PMID: 38177315 Free PMC article.
-
Signaling from T cell receptors (TCRs) and chimeric antigen receptors (CARs) on T cells.Cell Mol Immunol. 2020 Jun;17(6):600-612. doi: 10.1038/s41423-020-0470-3. Epub 2020 May 25. Cell Mol Immunol. 2020. PMID: 32451454 Free PMC article. Review.
-
A comparison of chimeric antigen receptors containing CD28 versus 4-1BB costimulatory domains.Nat Rev Clin Oncol. 2021 Nov;18(11):715-727. doi: 10.1038/s41571-021-00530-z. Epub 2021 Jul 6. Nat Rev Clin Oncol. 2021. PMID: 34230645 Review.
Cited by
-
Chimeric antigen receptors enable superior control of HIV replication by rapidly killing infected cells.PLoS Pathog. 2023 Dec 15;19(12):e1011853. doi: 10.1371/journal.ppat.1011853. eCollection 2023 Dec. PLoS Pathog. 2023. PMID: 38100526 Free PMC article.
-
Directed evolution of the multicopper oxidase laccase for cell surface proximity labeling and electron microscopy.bioRxiv [Preprint]. 2024 Oct 29:2024.10.29.620861. doi: 10.1101/2024.10.29.620861. bioRxiv. 2024. PMID: 39554088 Free PMC article. Preprint.
-
Fine-tuning the antigen sensitivity of CAR T cells: emerging strategies and current challenges.Front Immunol. 2023 Nov 27;14:1321596. doi: 10.3389/fimmu.2023.1321596. eCollection 2023. Front Immunol. 2023. PMID: 38090558 Free PMC article. Review.
-
The physical landscape of CAR-T synapse.Biophys J. 2024 Aug 6;123(15):2199-2210. doi: 10.1016/j.bpj.2023.09.004. Epub 2023 Sep 15. Biophys J. 2024. PMID: 37715447 Review.
-
Mechanical forces impair antigen discrimination by reducing differences in T-cell receptor/peptide-MHC off-rates.EMBO J. 2023 Apr 3;42(7):e111841. doi: 10.15252/embj.2022111841. Epub 2022 Dec 9. EMBO J. 2023. PMID: 36484367 Free PMC article.
References
-
- June C. H., O’Connor R. S., Kawalekar O. U., Ghassemi S., Milone M. C., CAR T cell immunotherapy for human cancer. Science 359, 1361–1365 (2018). - PubMed
-
- Exley A. R., McBlane J., Regulating innovation in the early development of cell therapies. Immunother. Adv. 1, 1–18 (2021).
Publication types
MeSH terms
Substances
Grants and funding
LinkOut - more resources
Full Text Sources
Other Literature Sources
Research Materials
Miscellaneous

