Tumor necrosis factor-α-primed mesenchymal stem cell-derived exosomes promote M2 macrophage polarization via Galectin-1 and modify intrauterine adhesion on a novel murine model
- PMID: 36591221
- PMCID: PMC9800892
- DOI: 10.3389/fimmu.2022.945234
Tumor necrosis factor-α-primed mesenchymal stem cell-derived exosomes promote M2 macrophage polarization via Galectin-1 and modify intrauterine adhesion on a novel murine model
Abstract
Background: Intrauterine adhesion (IUA) is a condition caused due to damage or infection of the endometrium. It is characterized by continuous inflammation and following fibrosis and dysfunction. However, the current animal IUA models have several disadvantages, including complex operation, high mortality, and many extra distractions owing to opening of the abdominal cavity to expose the uterus. Mesenchymal stem cells (MSCs), which have been used in treatment of IUA, are heterogeneous and immunosuppressive. However, their therapeutic effect is not as good as expected.
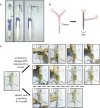
Methods: Here, we successfully built a new murine IUA model, called electric tool-scratching IUA model, and applied it in our experiments to investigate the efficacy of tumor necrosis factor-α (TNF-α) primed MSCs (T-MSCs). In the new model, we used a self-made electric tool that can cause mechanical damage to the endometrium without opening the abdominal cavity. ELISA and histological staining analysis were performed to evaluate pathological features of IUA. qRT-PCR, flow cytometry and immunofluoresence staining were performed to detect the phenotypes of macrophages. TMT proteomics quantification and western blotting assay were performed to analyze the differentially expressed proteins of MSC exosomes.
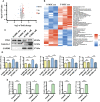
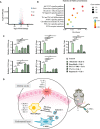
Results: Based on the new IUA model, we found TNF-α pretreatment could enhance the ability of MSCs to relieve inflammation and reduce endometrium fibrosis. Mechanistically, T-MSC promoted macrophage polarization to M2 phenotype through exosomes. Subsequently, we found the expression of Galectin-1 was increased in T-MSC exosomes. Finally, we analyzed the gene expression pattern of Galectin-1 treated macrophages and found Galectin-1 promoted macrophage polarization to M2 phenotype mainly through the Jak-STAT signaling pathway.
Conclusions: Our studies proposed an innovative mouse model and a better MSC treatment strategy for IUA.
Keywords: Galectin-1; exosomes; intrauterine adhesions; macrophages; mesenchymal stem cells.
Copyright © 2022 Li, Pan, Yang, Wang, Jiang, Dou and Hou.
Conflict of interest statement
The authors declare that the research was conducted in the absence of any commercial or financial relationships that could be construed as a potential conflict of interest.
Figures


Similar articles
-
Melatonin-Primed MSCs Alleviate Intrauterine Adhesions by Affecting MSC-Expressed Galectin-3 on Macrophage Polarization.Stem Cells. 2022 Oct 21;40(10):919-931. doi: 10.1093/stmcls/sxac049. Stem Cells. 2022. PMID: 35866866
-
Exosomes Derived from Adipose Mesenchymal Stem Cells Restore Functional Endometrium in a Rat Model of Intrauterine Adhesions.Reprod Sci. 2020 Jun;27(6):1266-1275. doi: 10.1007/s43032-019-00112-6. Epub 2020 Jan 13. Reprod Sci. 2020. PMID: 31933162
-
[Effect of mesenchymal stem cell derived from umbilical cord blood on rabbit intrauterine adhesion model].Zhonghua Yi Xue Za Zhi. 2024 Oct 29;104(40):3757-3764. doi: 10.3760/cma.j.cn112137-20240314-00578. Zhonghua Yi Xue Za Zhi. 2024. PMID: 39463370 Chinese.
-
The Latest Developments in Immunomodulation of Mesenchymal Stem Cells in the Treatment of Intrauterine Adhesions, Both Allogeneic and Autologous.Front Immunol. 2021 Nov 15;12:785717. doi: 10.3389/fimmu.2021.785717. eCollection 2021. Front Immunol. 2021. PMID: 34868069 Free PMC article. Review.
-
Treatment strategies for intrauterine adhesion: focus on the exosomes and hydrogels.Front Bioeng Biotechnol. 2023 Aug 31;11:1264006. doi: 10.3389/fbioe.2023.1264006. eCollection 2023. Front Bioeng Biotechnol. 2023. PMID: 37720318 Free PMC article. Review.
Cited by
-
Use of priming strategies to advance the clinical application of mesenchymal stromal/stem cell-based therapy.World J Stem Cells. 2024 Jan 26;16(1):7-18. doi: 10.4252/wjsc.v16.i1.7. World J Stem Cells. 2024. PMID: 38292438 Free PMC article.
-
IL-23 Priming Enhances the Neuroprotective Effects of MSC-Derived Exosomes in Treating Retinal Degeneration.Invest Ophthalmol Vis Sci. 2024 Aug 1;65(10):8. doi: 10.1167/iovs.65.10.8. Invest Ophthalmol Vis Sci. 2024. PMID: 39102262 Free PMC article.
-
Validity of stem cell-loaded scaffolds to facilitate endometrial regeneration and restore fertility: a systematic review and meta-analysis.Front Endocrinol (Lausanne). 2024 May 23;15:1397783. doi: 10.3389/fendo.2024.1397783. eCollection 2024. Front Endocrinol (Lausanne). 2024. PMID: 38846497 Free PMC article.
-
Poly (I:C) increases the expression of galectin 1, 3, 9 and HGF genes in exosomes isolated from human Wharton's jelly mesenchymal stem cells.Heliyon. 2024 Jul 26;10(15):e35343. doi: 10.1016/j.heliyon.2024.e35343. eCollection 2024 Aug 15. Heliyon. 2024. PMID: 39170483 Free PMC article.
-
MSCs promote the efferocytosis of large peritoneal macrophages to eliminate ferroptotic monocytes/macrophages in the injured endometria.Stem Cell Res Ther. 2024 May 1;15(1):127. doi: 10.1186/s13287-024-03742-z. Stem Cell Res Ther. 2024. PMID: 38693589 Free PMC article.
References
-
- Wang L, Yu C, Chang T, Zhang M, Song S, Xiong C, et al. . In situ repair abilities of human umbilical cord-derived mesenchymal stem cells and autocrosslinked hyaluronic acid gel complex in rhesus monkeys with intrauterine adhesion. Sci Adv (2020) 6(21):eaba6357. doi: 10.1126/sciadv.aba6357 - DOI - PMC - PubMed
Publication types
MeSH terms
Substances
LinkOut - more resources
Full Text Sources
Other Literature Sources
Medical
Research Materials

