. 2023 Jan 10;56(1):107-124.e5.
doi: 10.1016/j.immuni.2022.12.002. Epub 2022 Dec 28.

CD8+ T cell activation in cancer comprises an initial activation phase in lymph nodes followed by effector differentiation within the tumor

Affiliations

CD8+ T cell activation in cancer comprises an initial activation phase in lymph nodes followed by effector differentiation within the tumor

Nataliya Prokhnevska et al. Immunity. .

Abstract

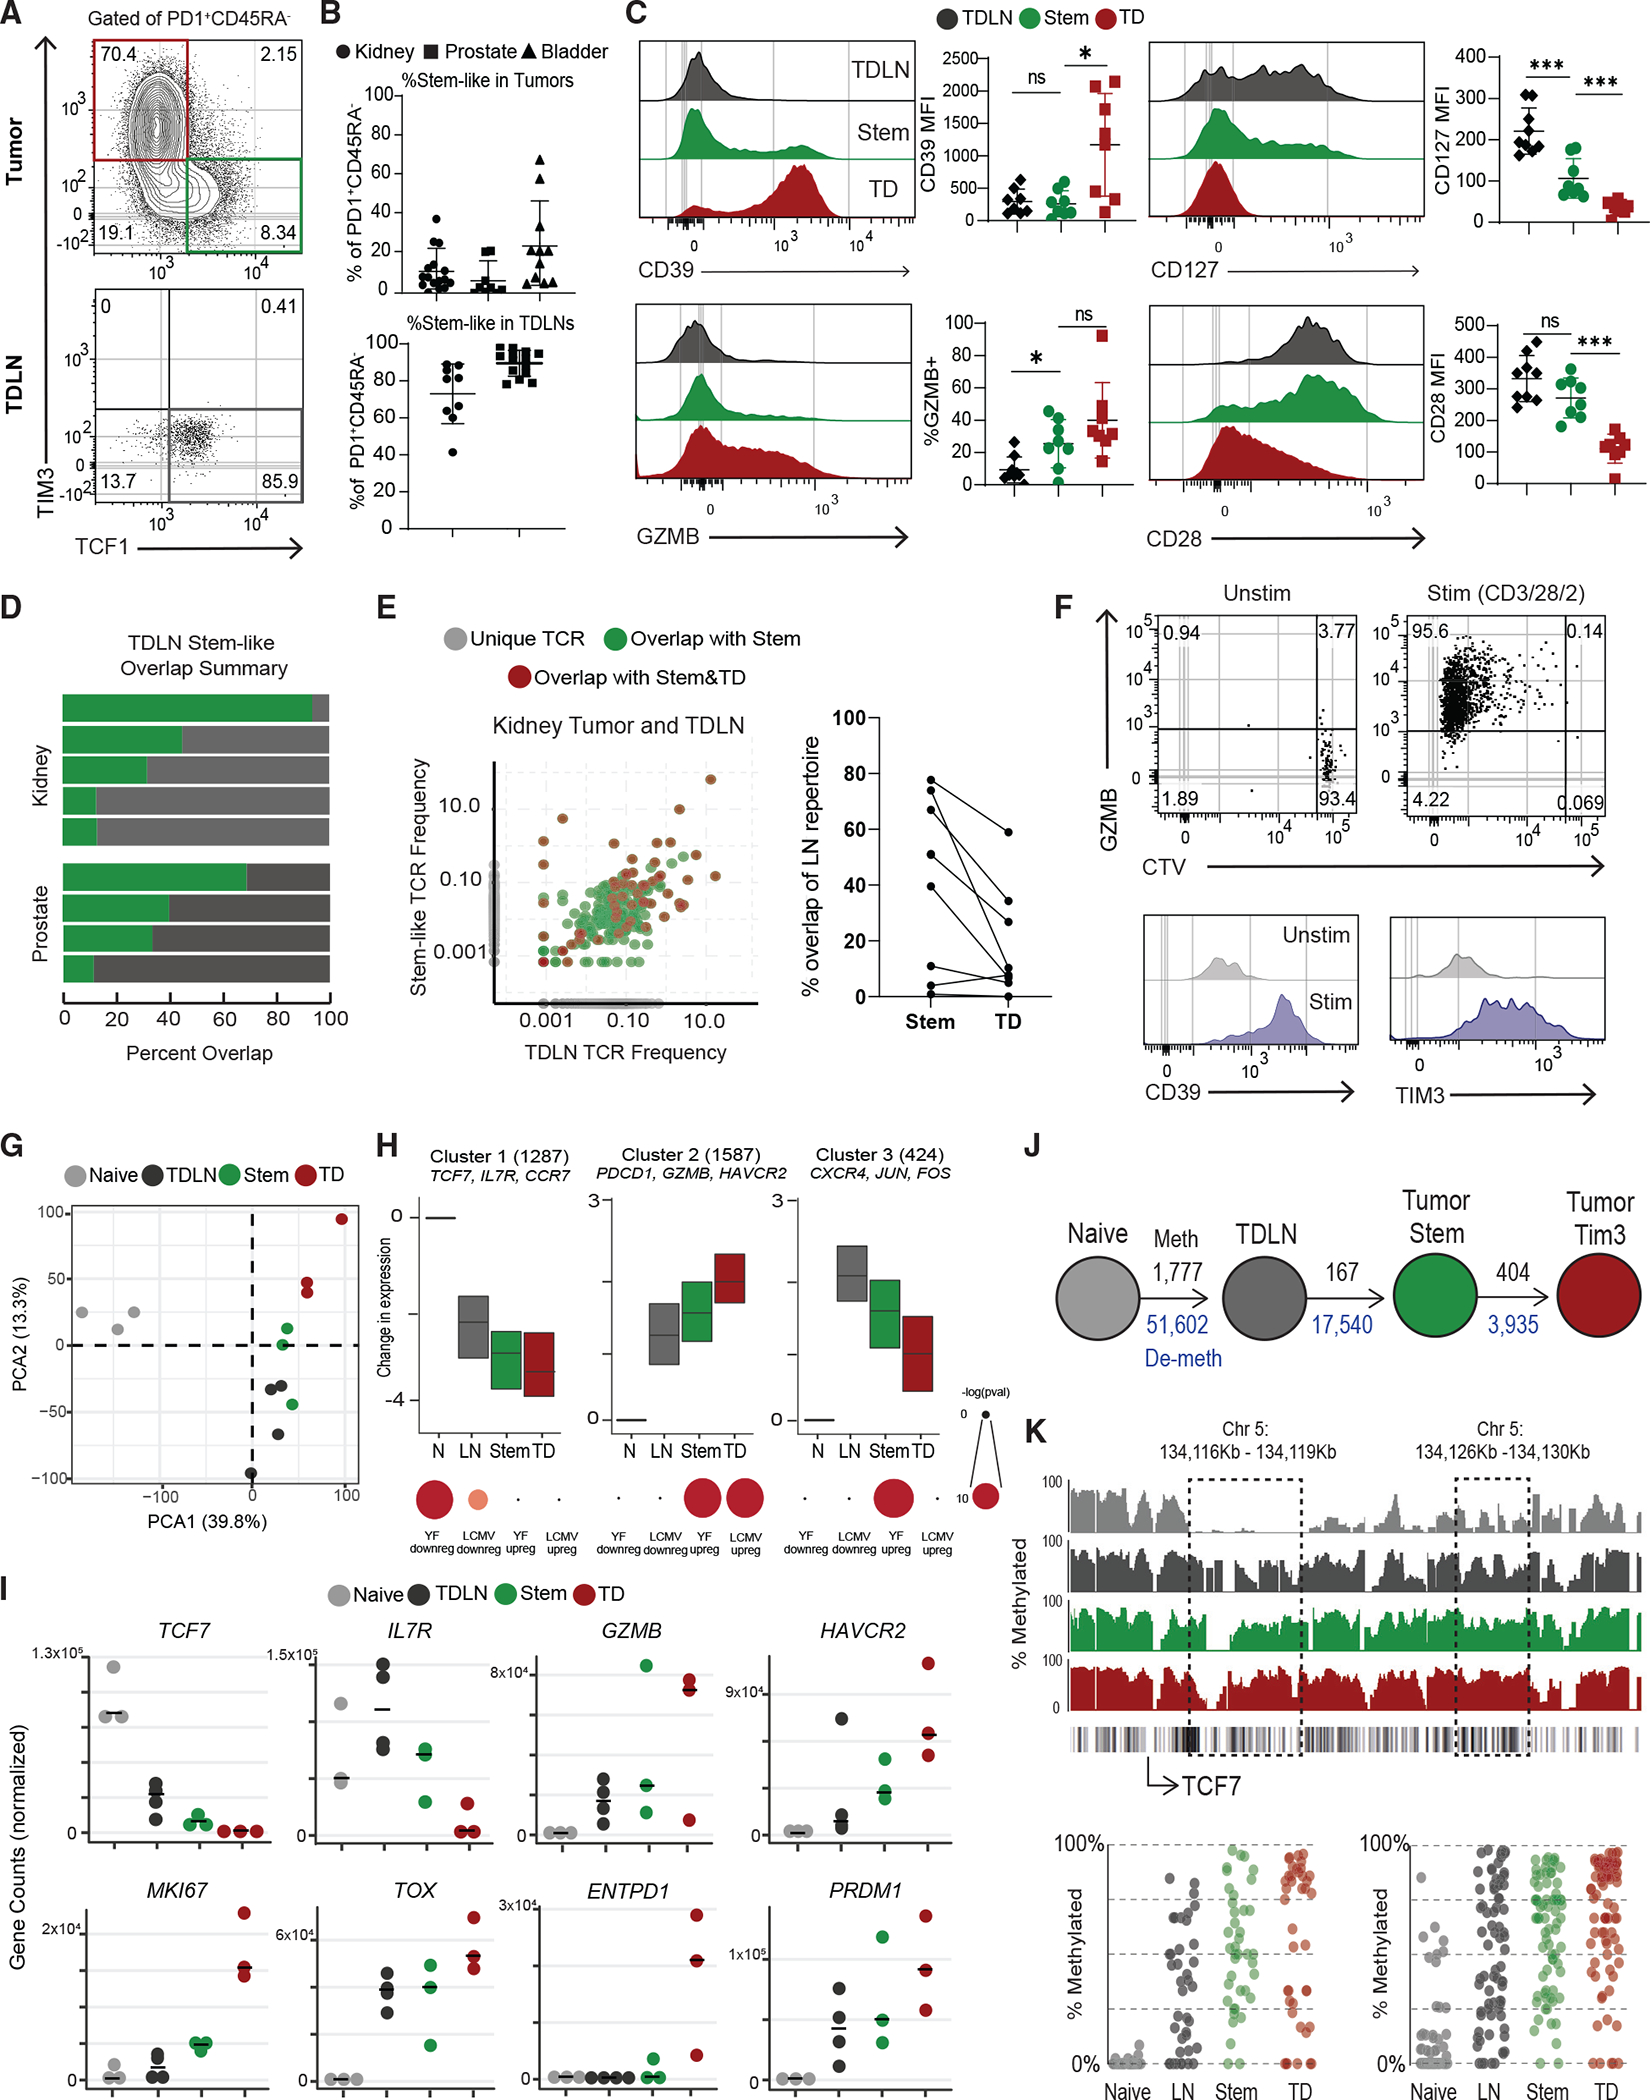
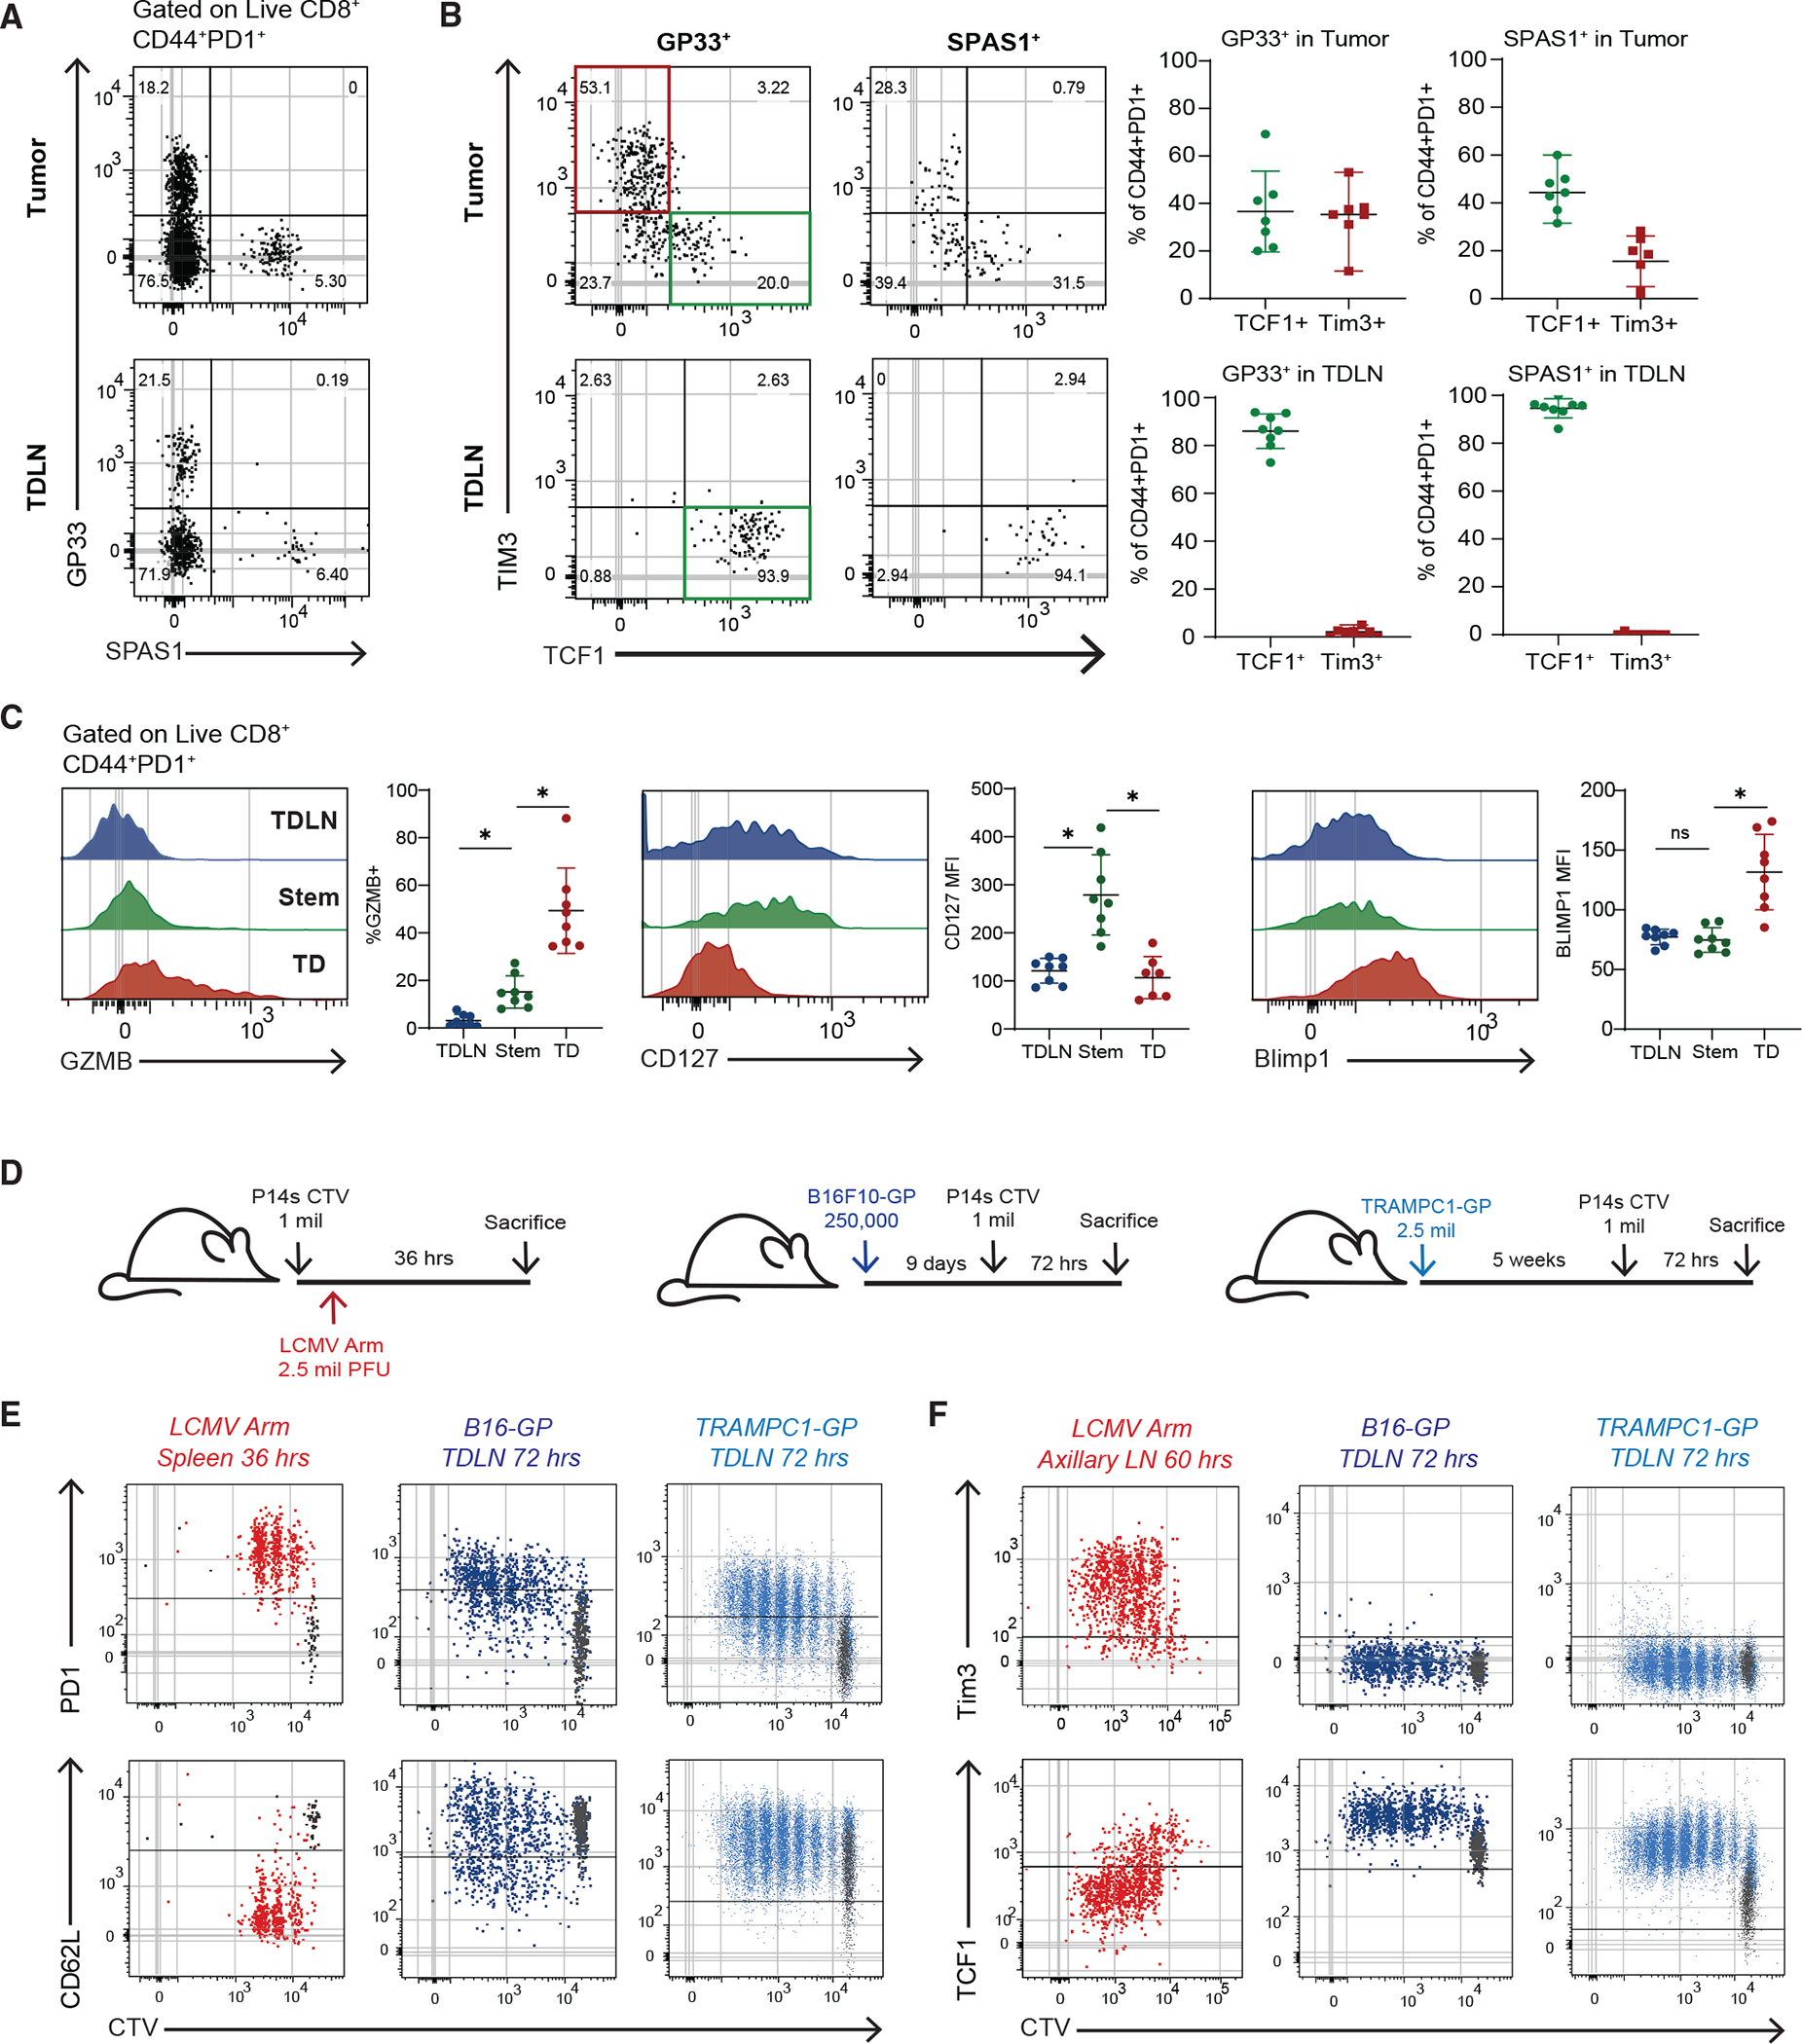
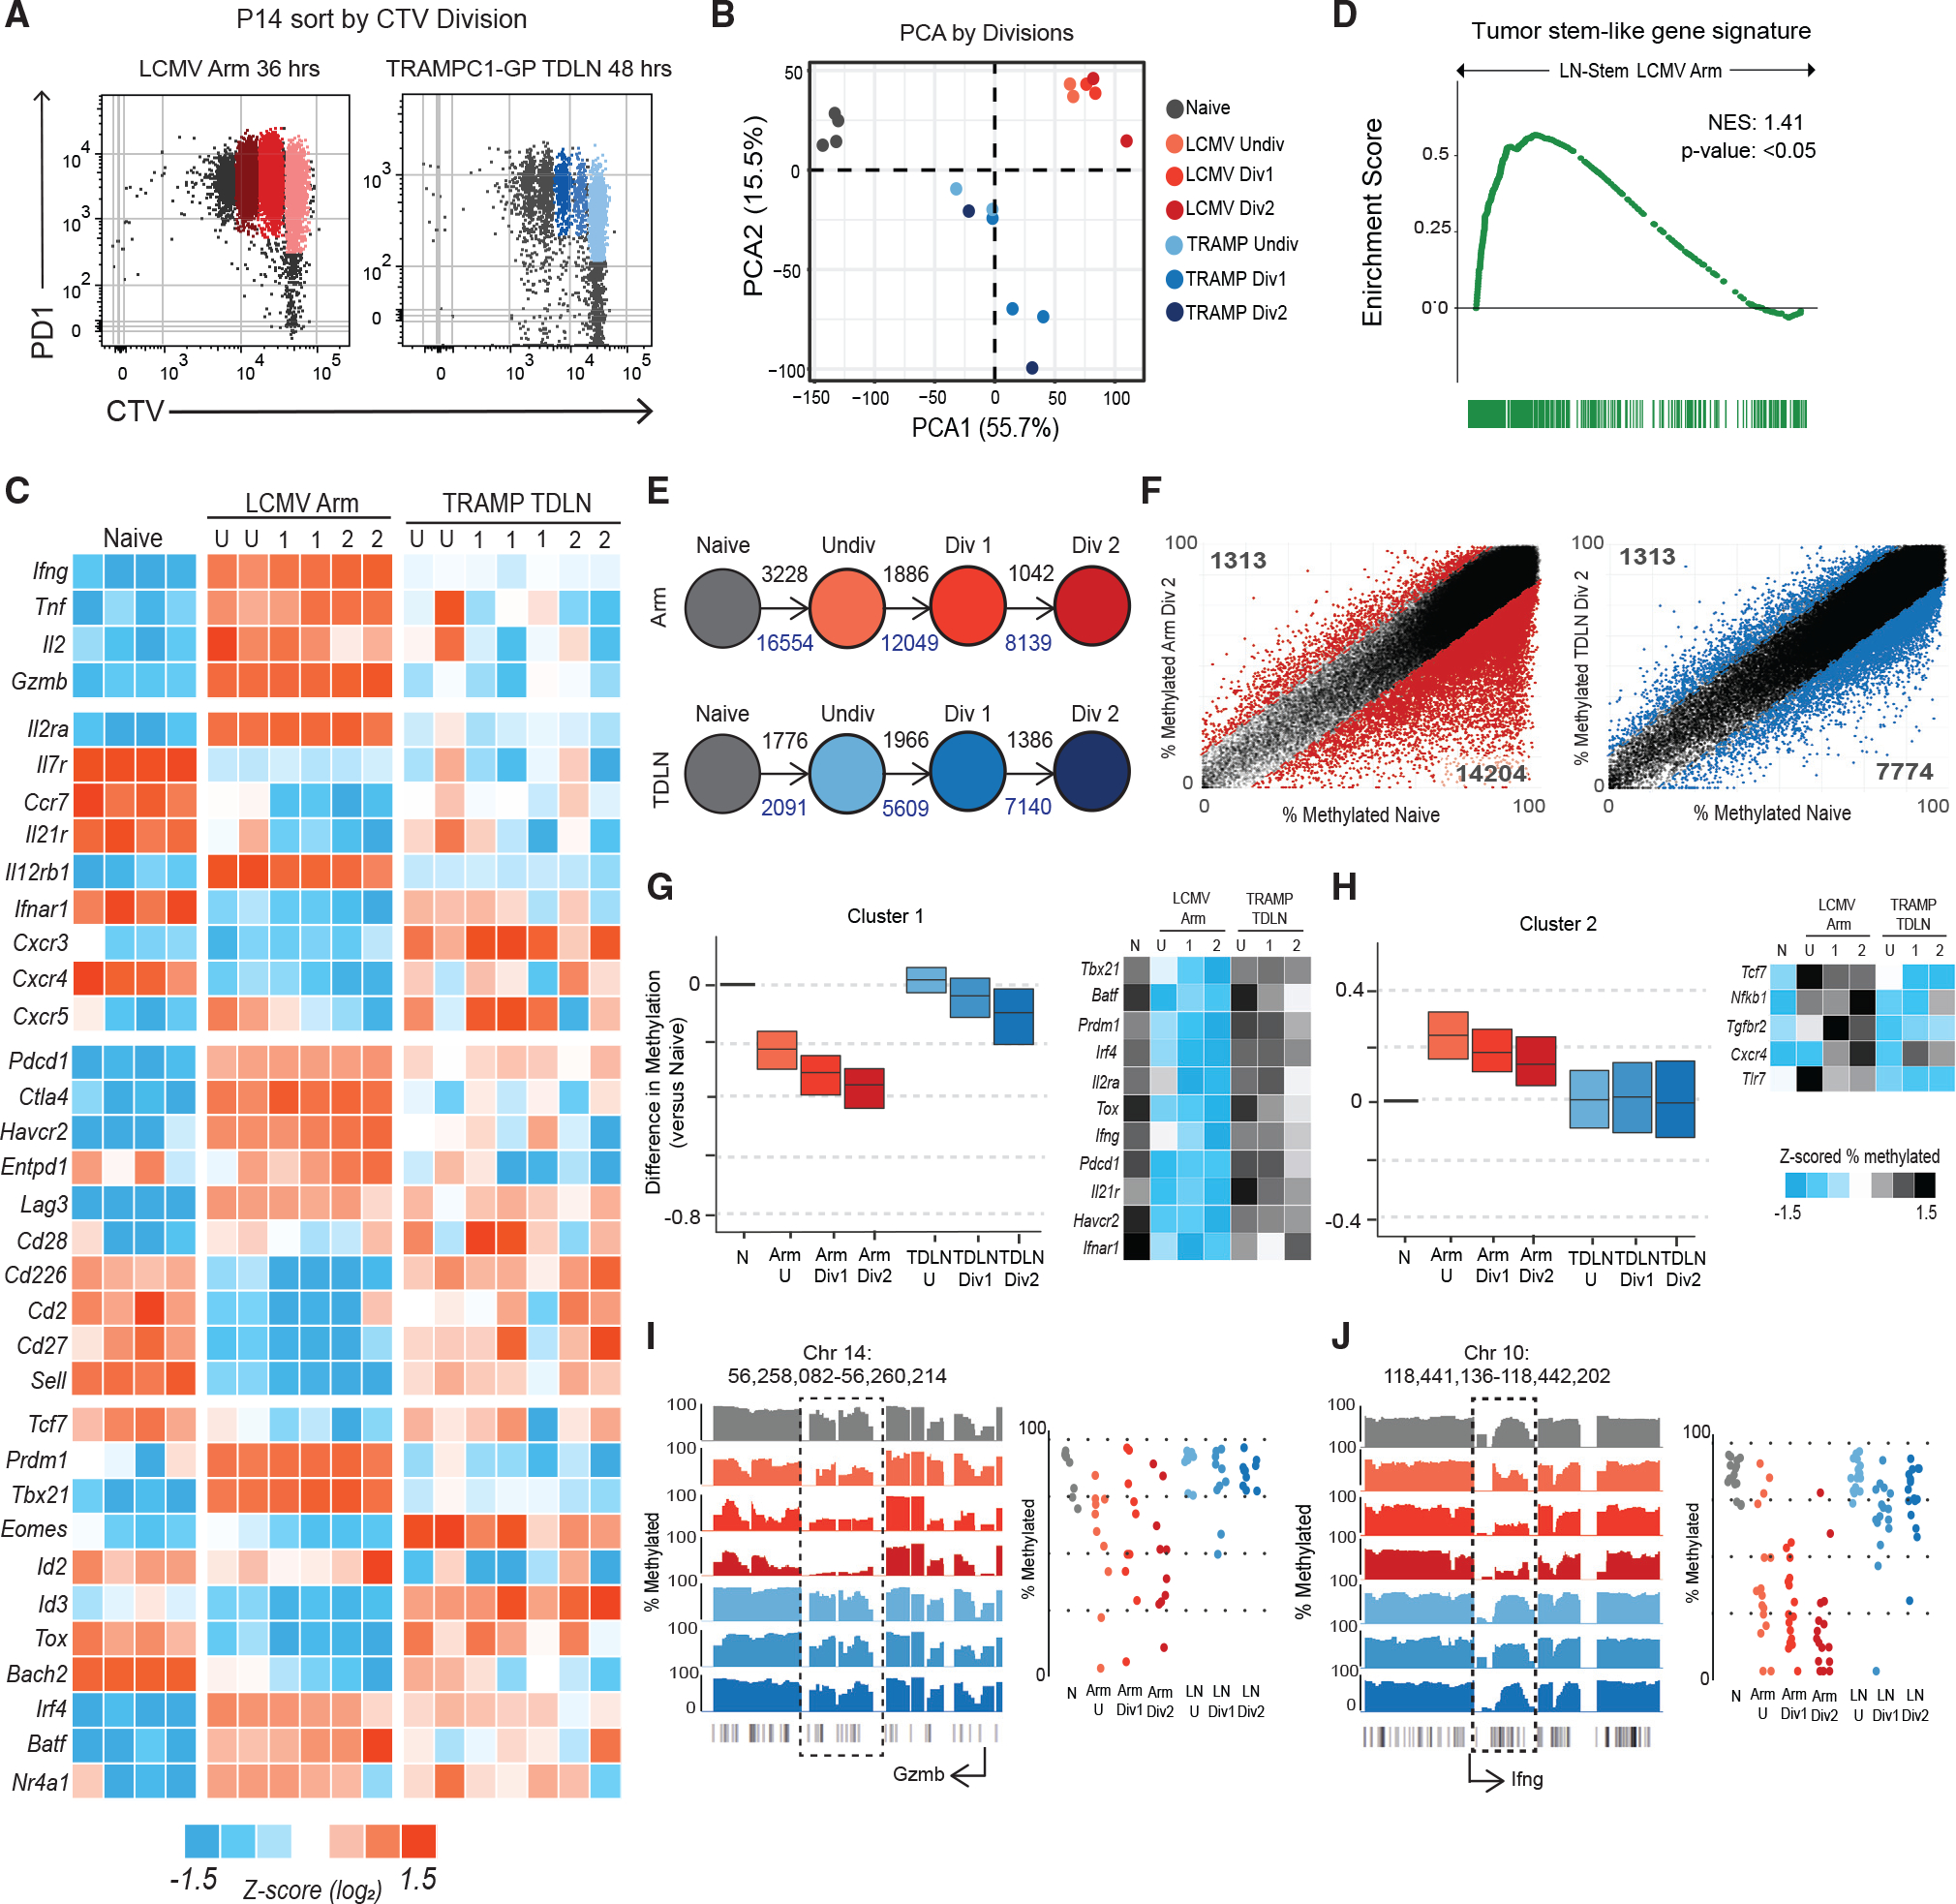
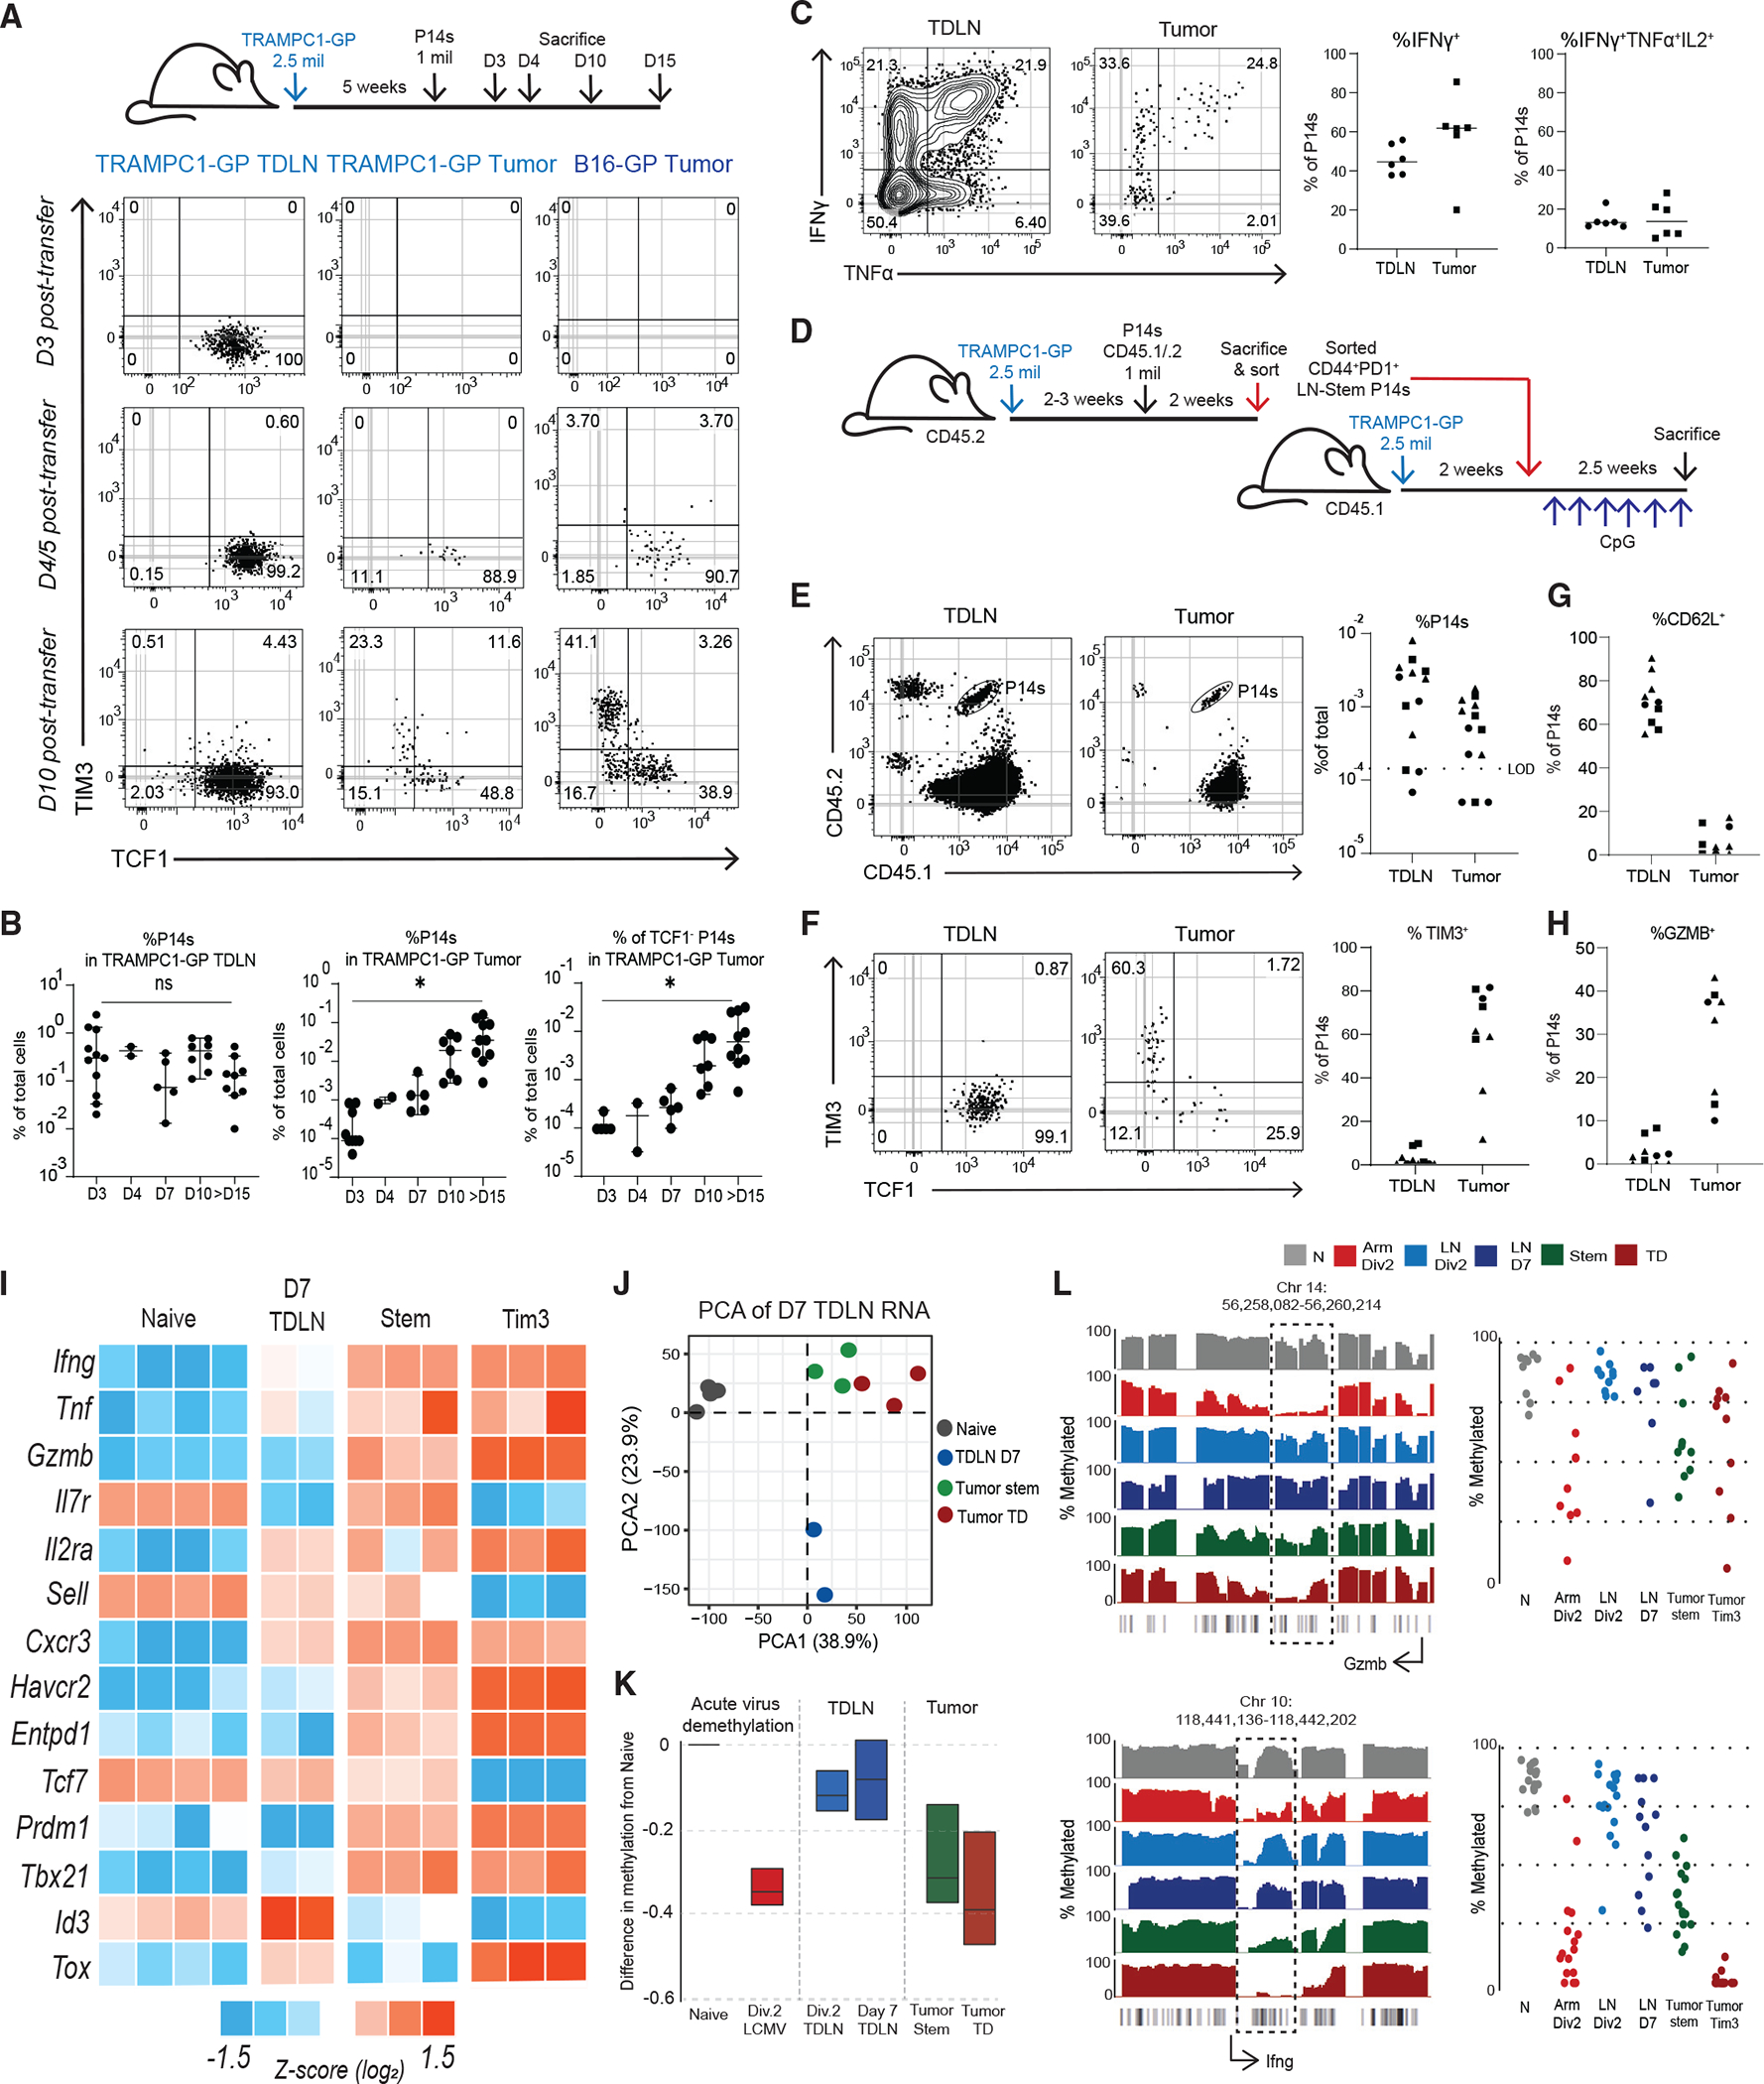
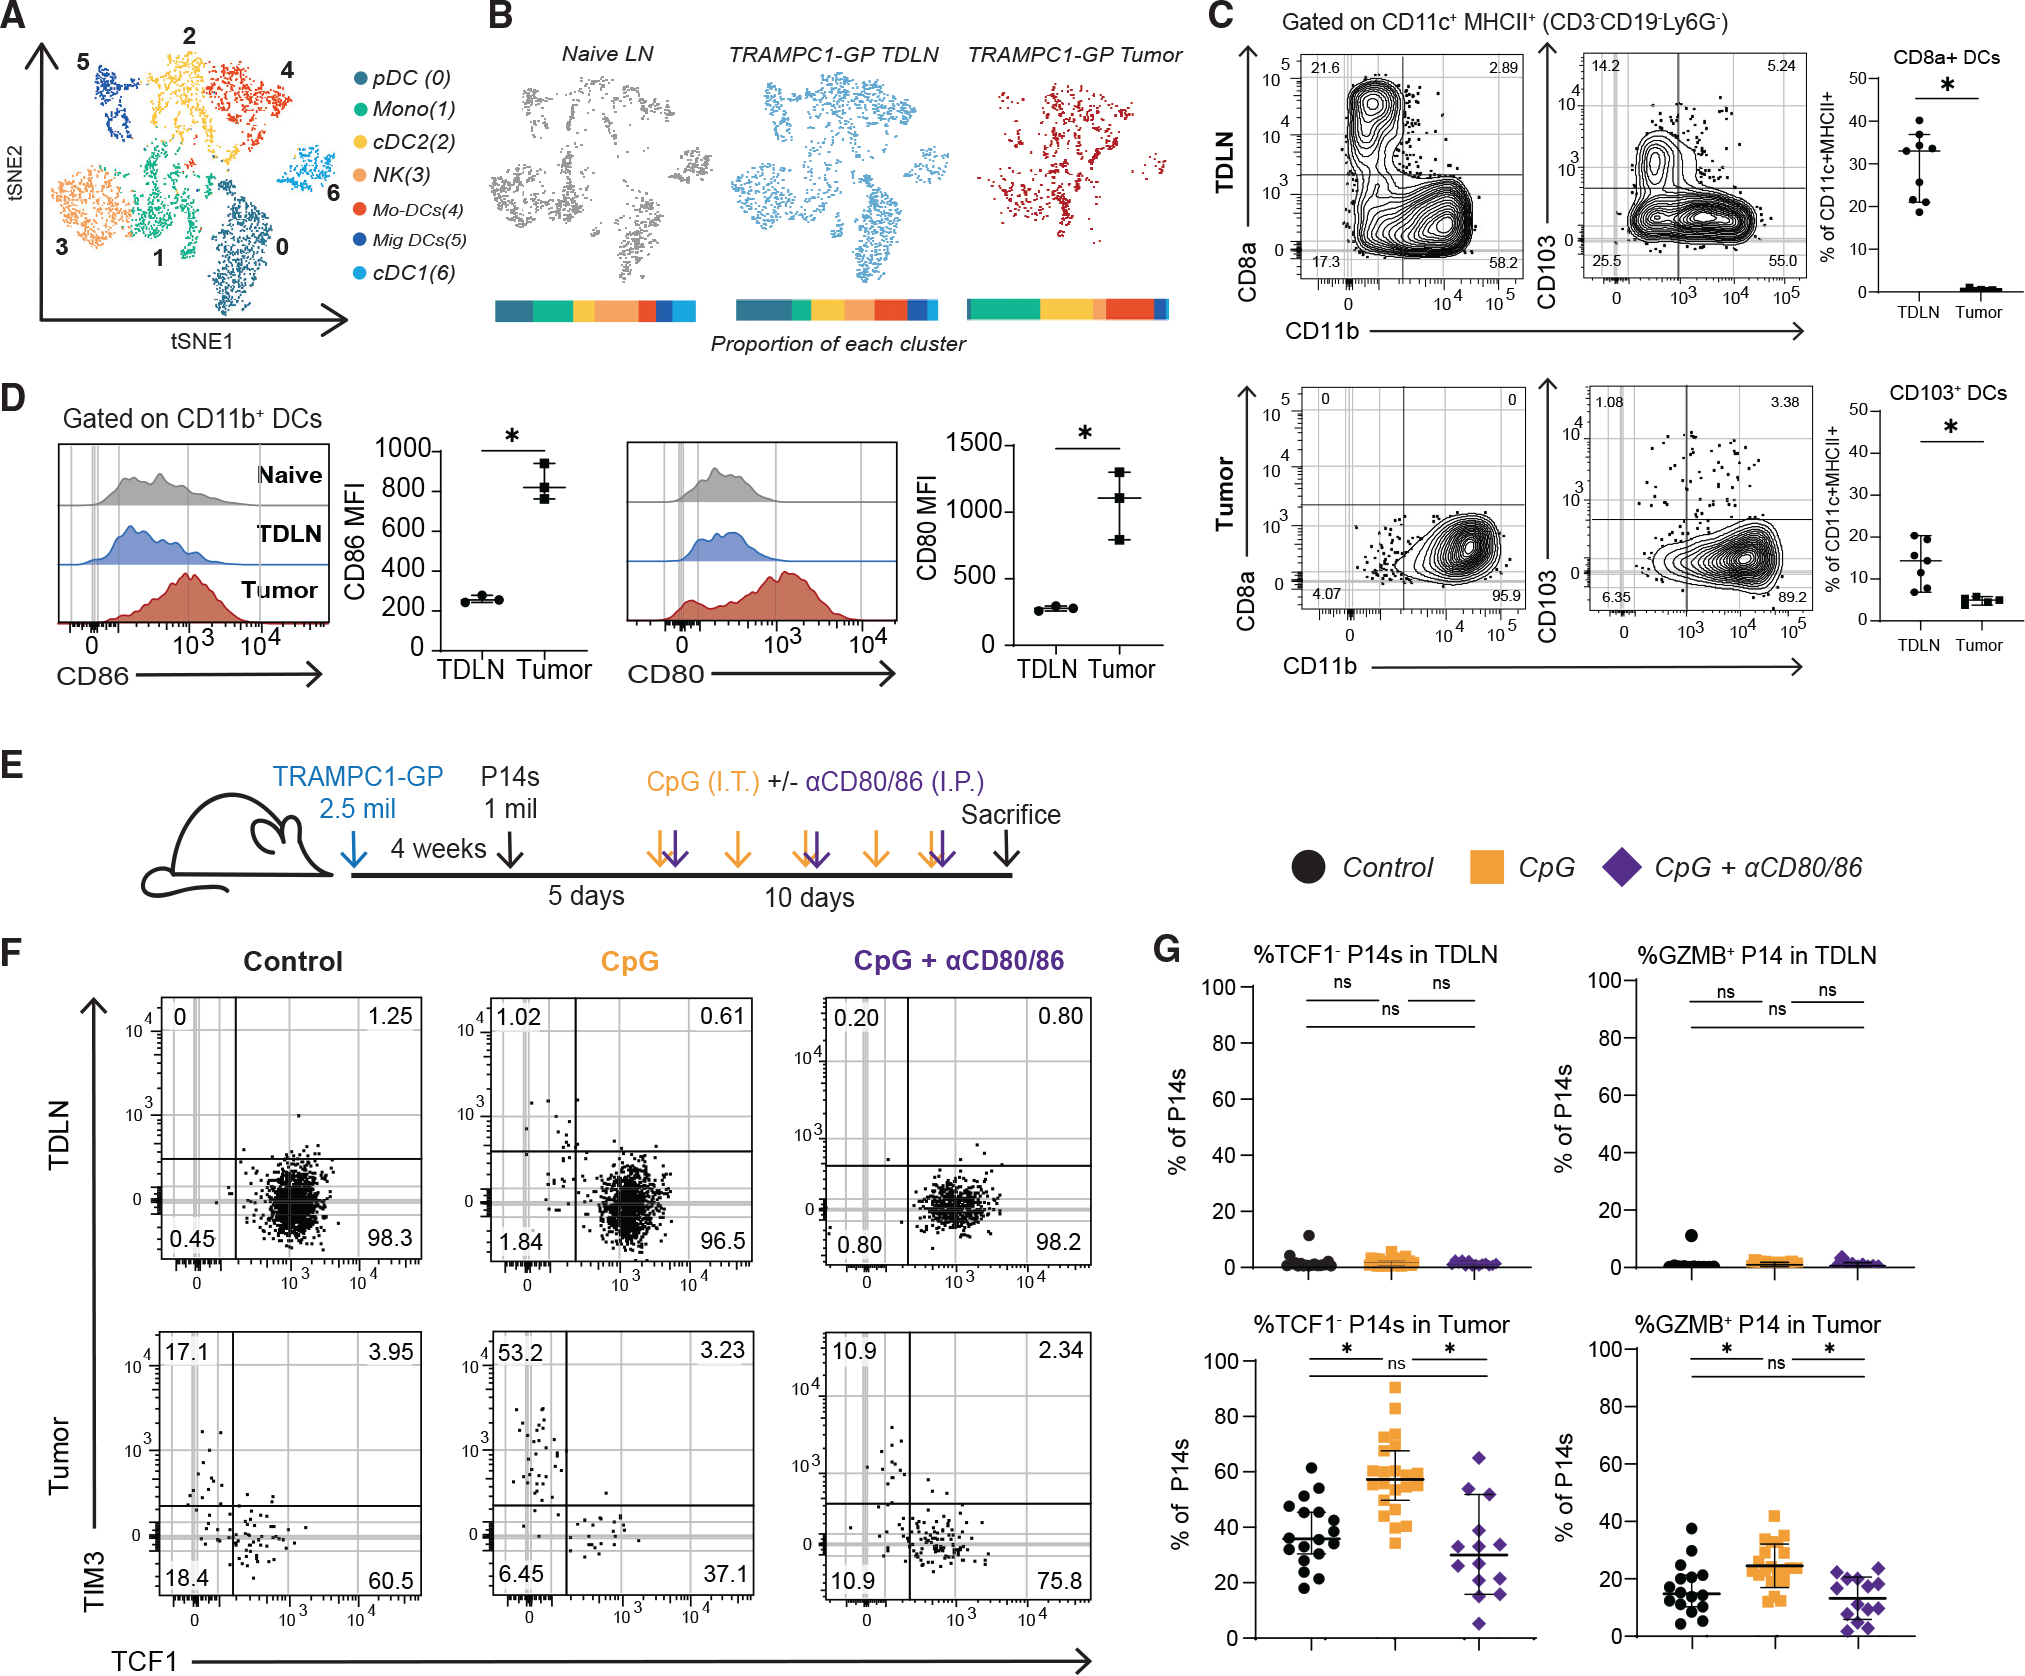
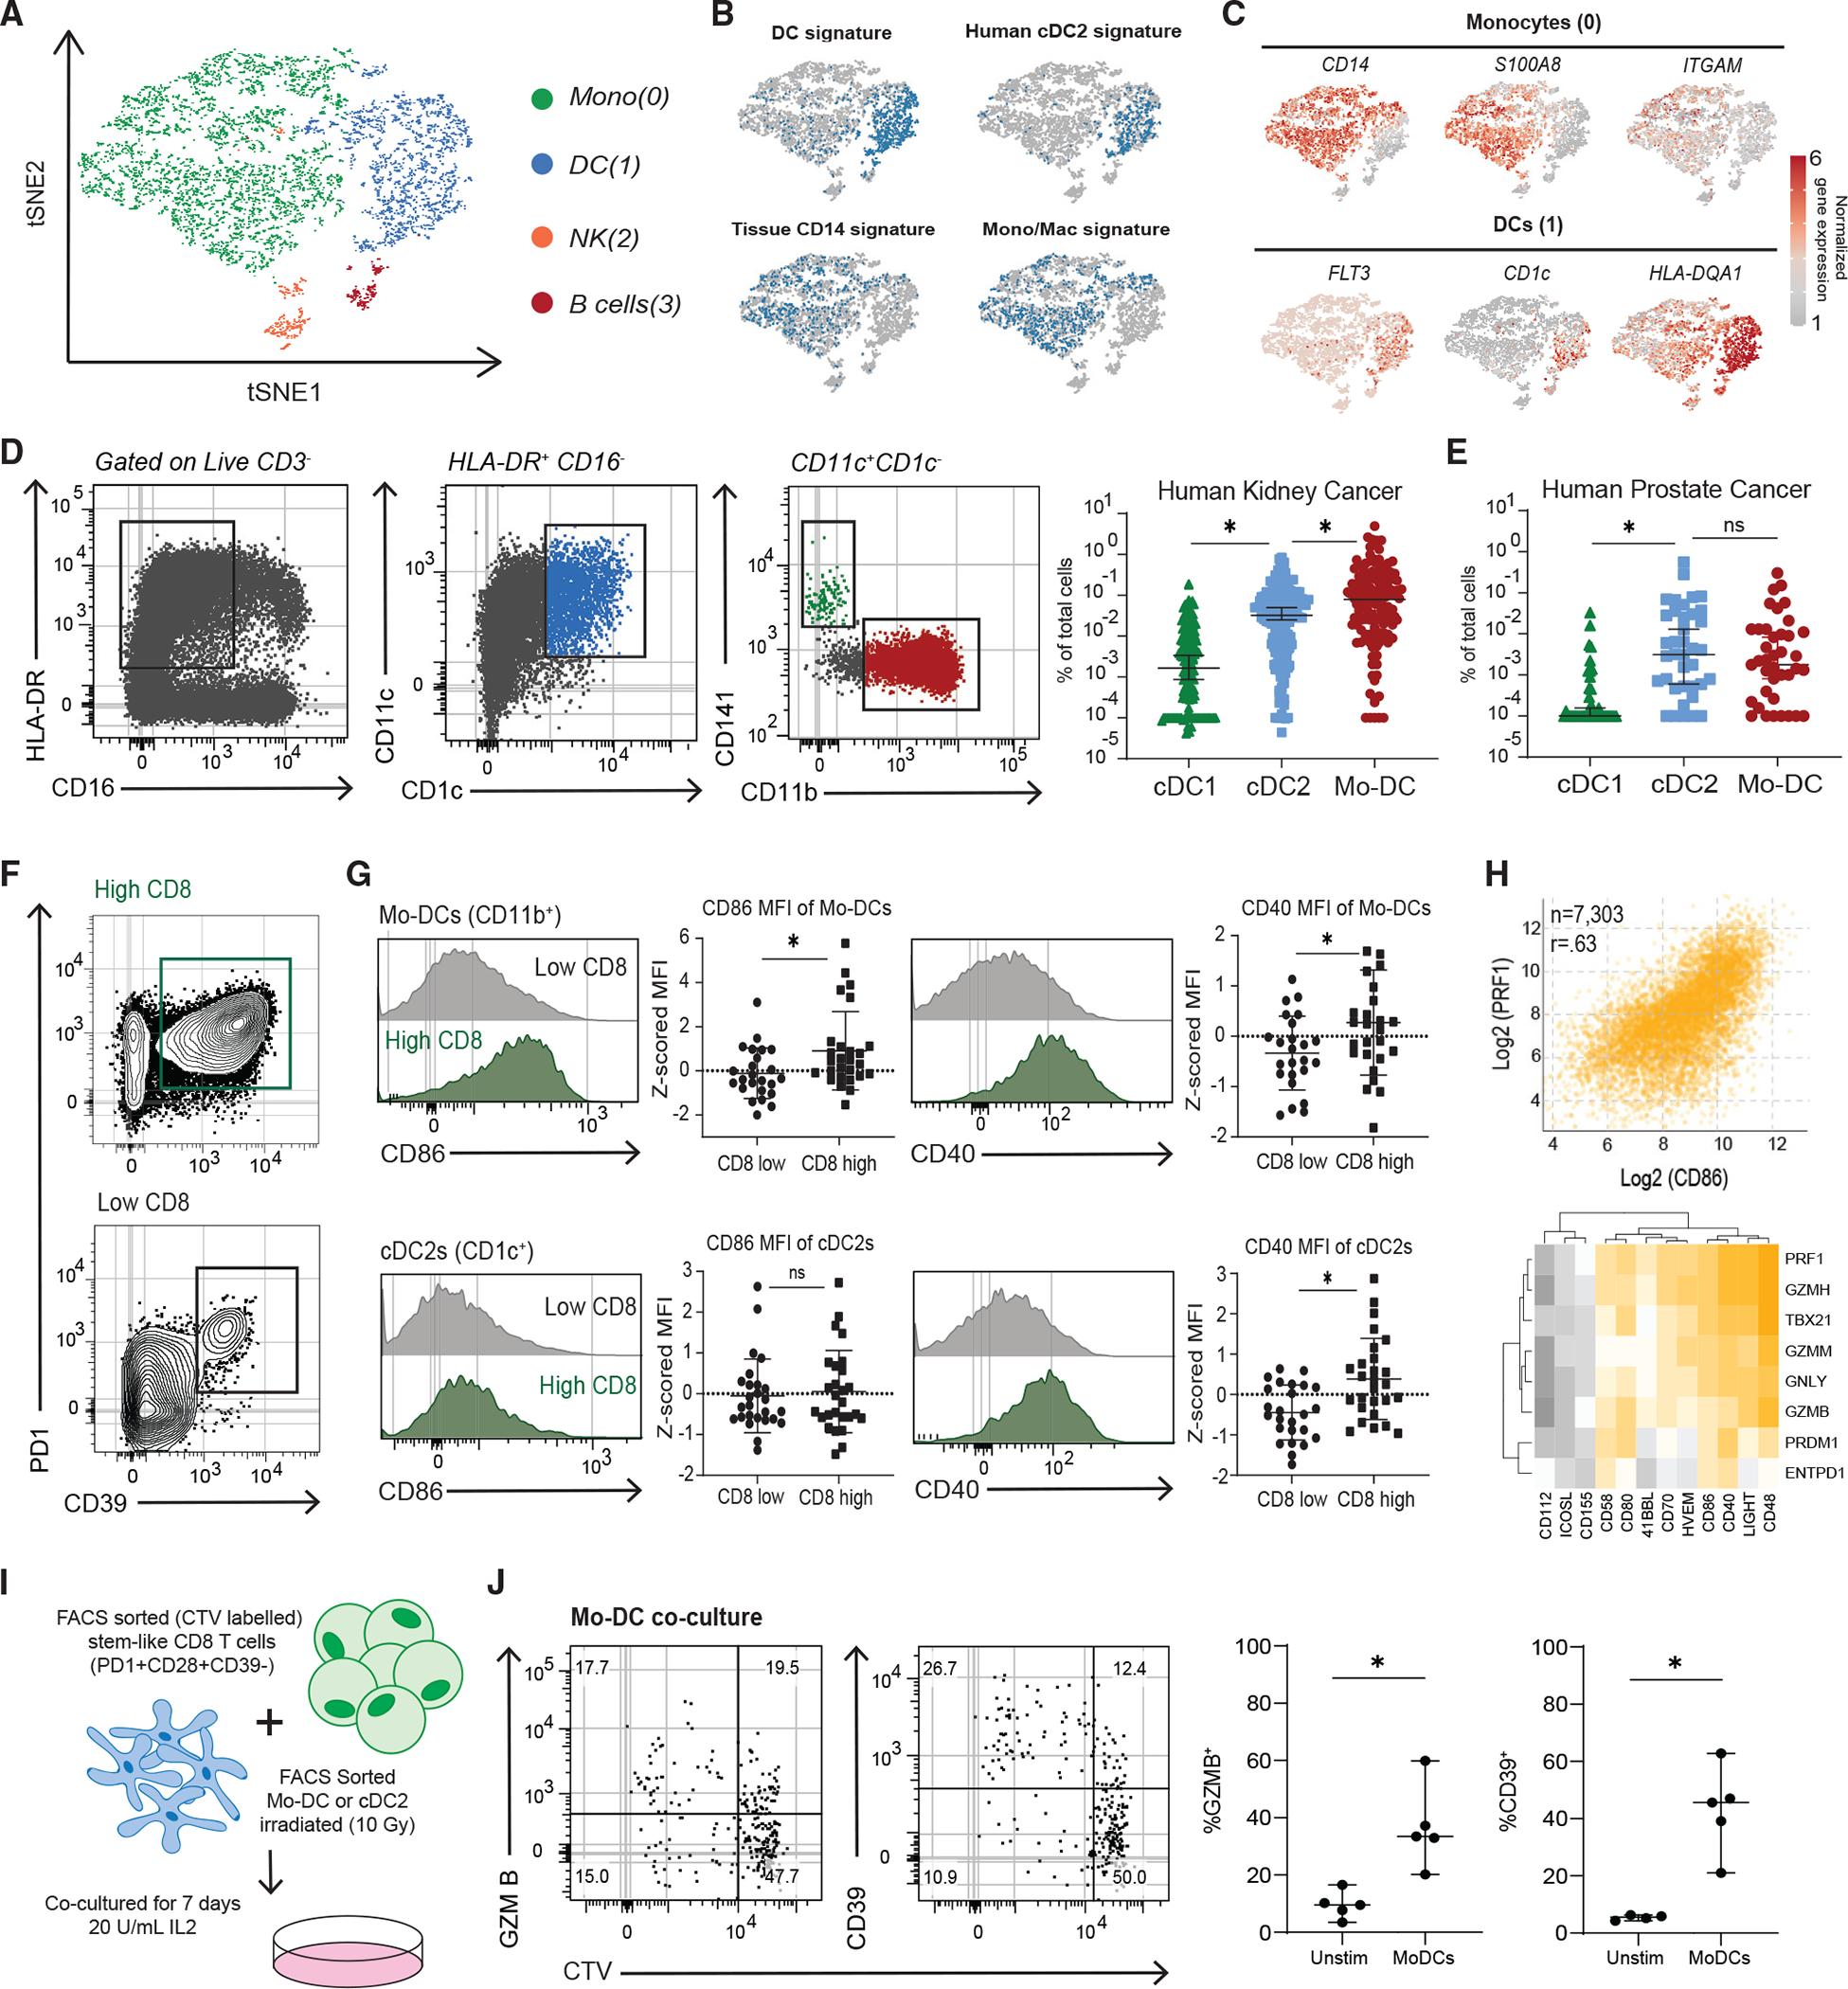
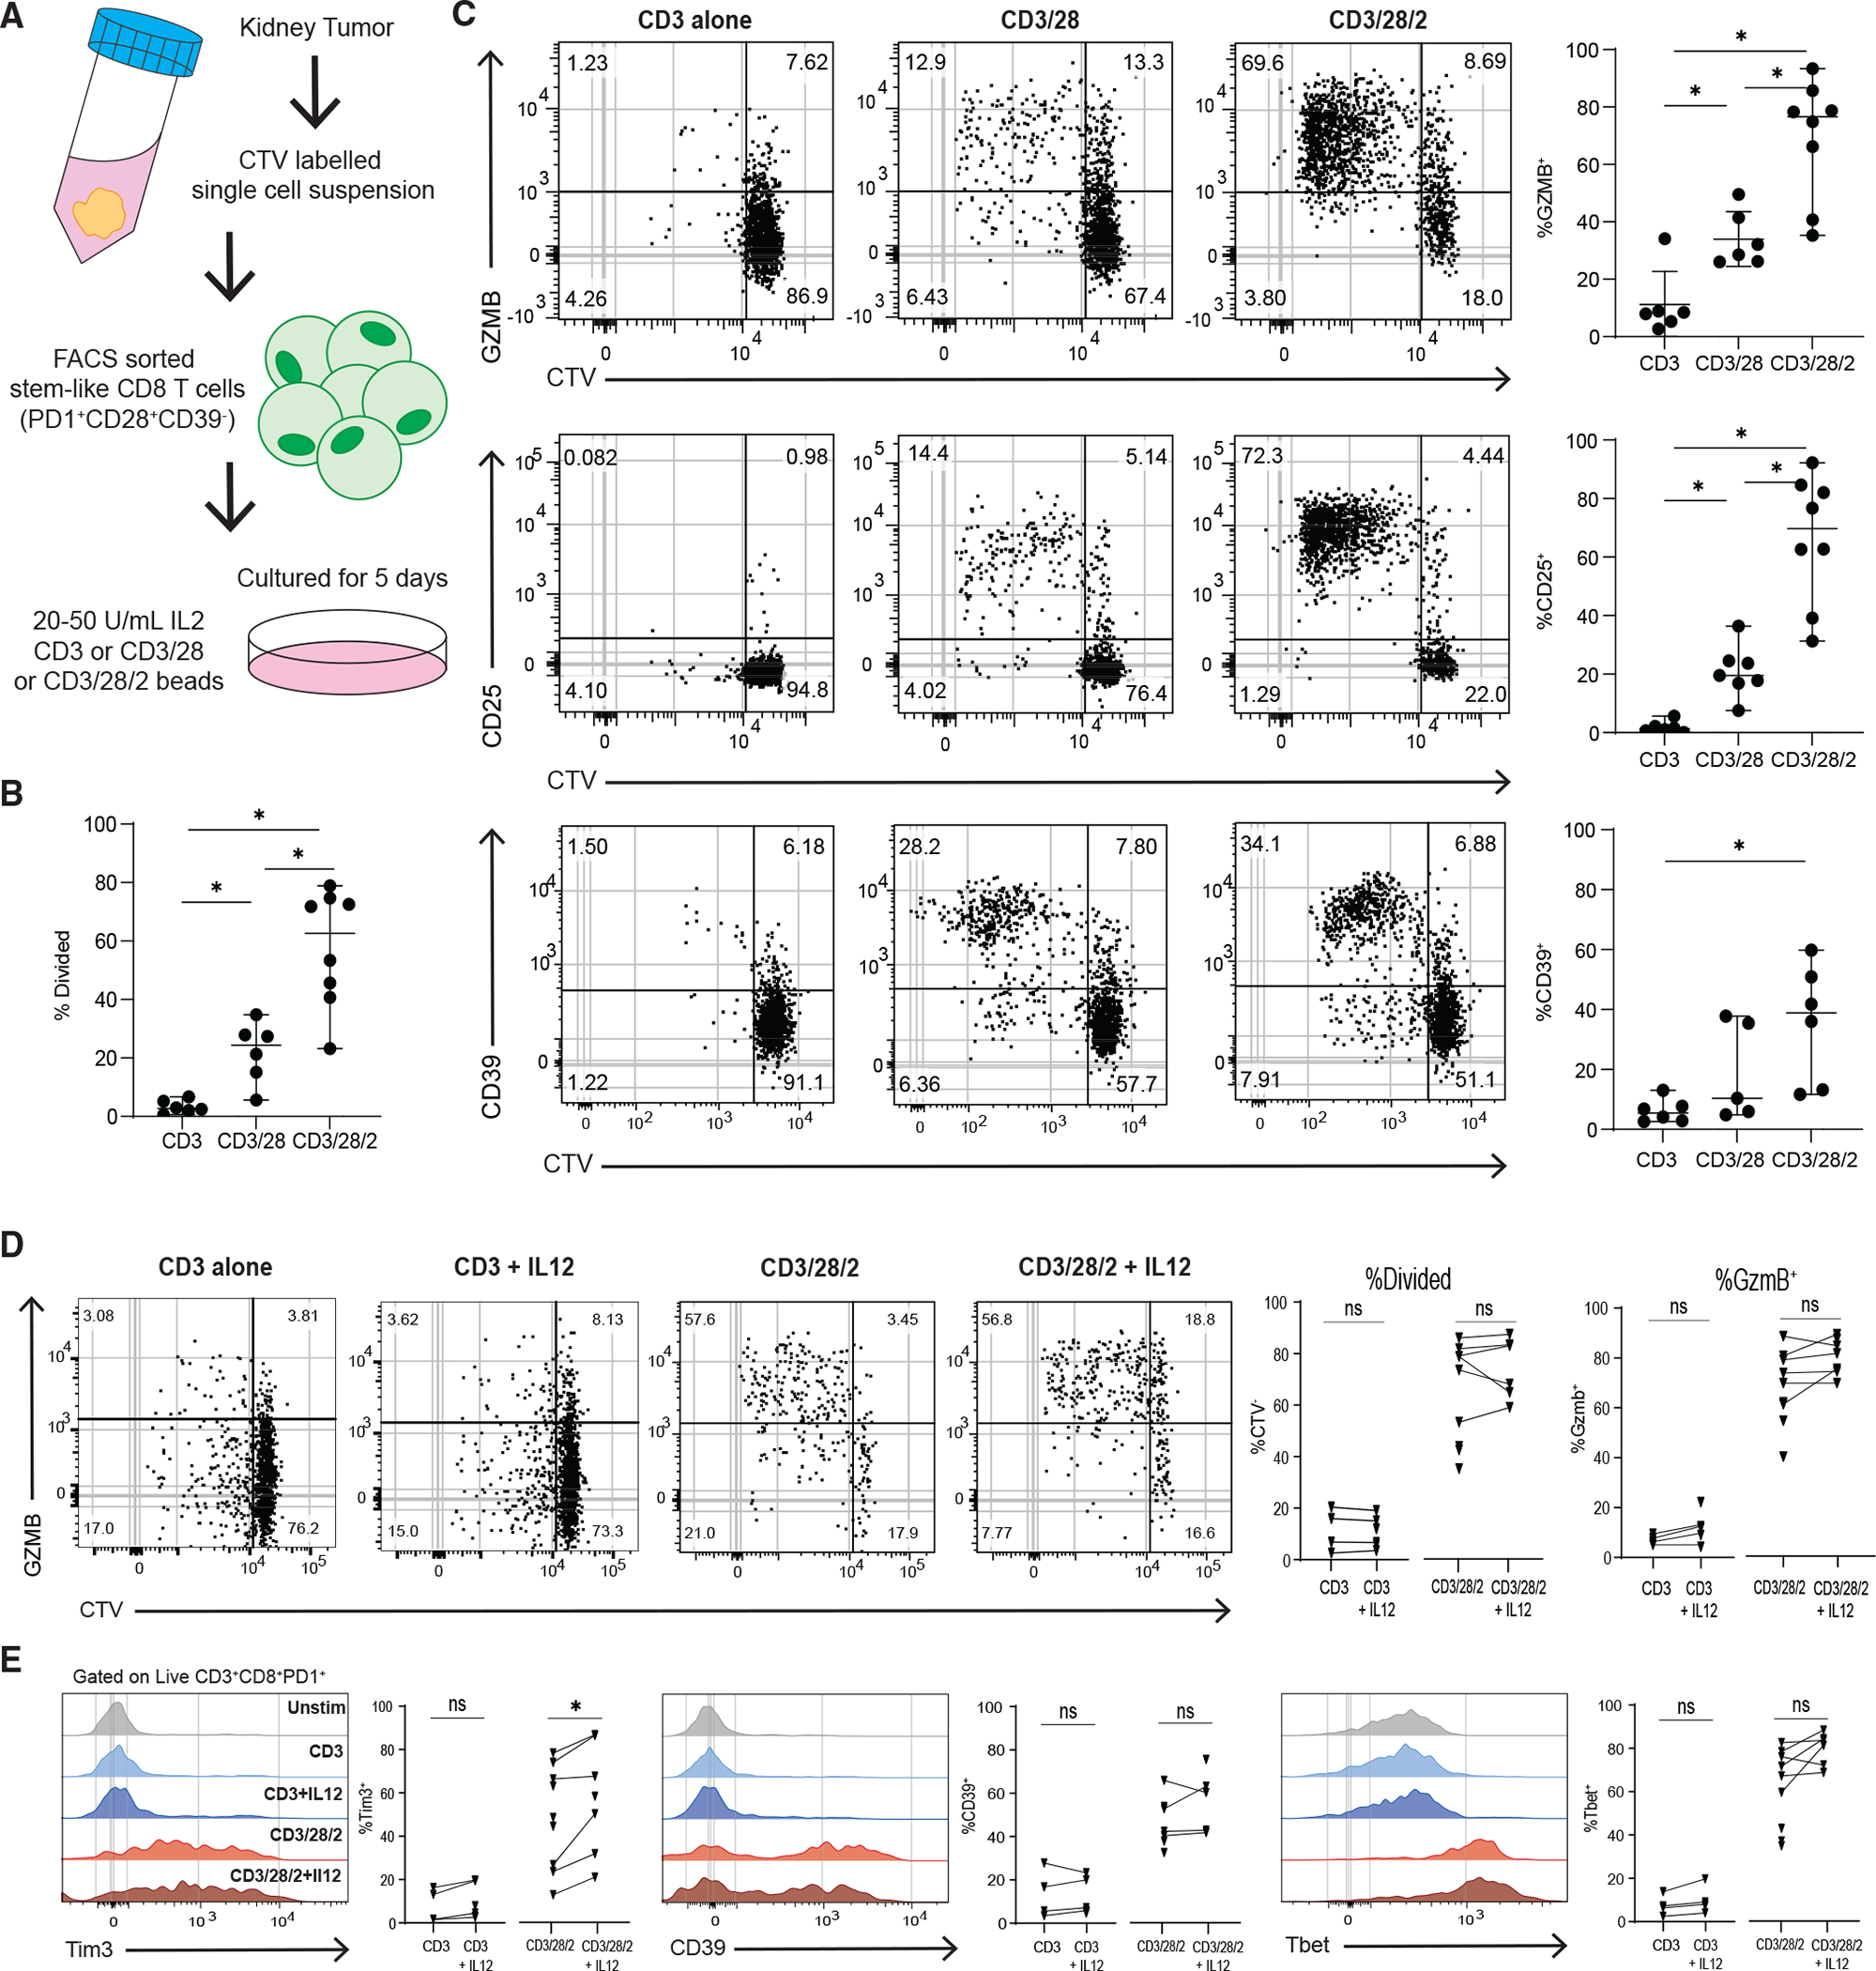
Improvements in tumor immunotherapies depend on better understanding of the anti-tumor T cell response. By studying human tumor-draining lymph nodes (TDLNs), we found that activated CD8+ T cells in TDLNs shared functional, transcriptional, and epigenetic traits with TCF1+ stem-like cells in the tumor. The phenotype and TCR overlap suggested that these TDLN cells were precursors to tumor-resident stem-like CD8+ T cells. Murine tumor models revealed that tumor-specific CD8+ T cells were activated in TDLNs but lacked an effector phenotype. These stem-like cells migrated into the tumor, where additional co-stimulation from antigen-presenting cells drove effector differentiation. This model of CD8+ T cell activation in response to cancer is different from that of canonical CD8+ T cell activation to acute viruses, and it proposes two stages of tumor-specific CD8+ T cell activation: initial activation in TDLNs and subsequent effector program acquisition within the tumor after additional co-stimulation.

Keywords: CD8 T cells; T cell differentiation; T cell exhaustion; antigen-presenting cells; cancer; co-stimulation; tumor-draining lymph nodes; tumor-infiltrating lymphocytes.


Conflict of interest statement

Declaration of interests The authors declare no competing interests.

Figures

Figure 1.
Figure 1.. Activated CD8+ T cells in human TDLNs have a similar phenotype to tumor-infiltrating stem-like CD8+ T cells
(A) Representative plots showing activated CD8+ T cells in human tumor and tumor-draining lymph nodes (TDLNs). (B) Summaries of the proportion of stem-like CD8+ T cells in human kidney (n = 16), prostate (n = 32), and bladder (n = 12) tumors and kidney (n = 9) and prostate (n = 14) TDLNs. (C) Phenotype of CD8+ T cell populations in TDLN and tumor. (D) Summary of TCR repertoire overlap between activated CD8+ T cells from TDLNs and tumor-stem-like CD8+ T cells in human kidney and prostate cancer. (E) TCR repertoire overlap in a representative patient between activated CD8+ T cells from TDLNs, stem-like CD8+ TILs, and TD CD8+ TILs. The proportion of the detected TCR clonotype in each patient that is unique or shared between the populations is shown. Summary showing the TCR overlap between stem-like and TD CD8+ TILs as a proportion of the LN CD8+ T cell repertoire. (F) Sorted CTV-labeled activated CD8+ T cells from human TDLNs were cultured in vitro with anti-CD3/28/2 beads for 7 days. (G) PCA of RNA-seq of naive CD8+ T cells, activated LN-stem CD8+, and stem-like CD8+ and TD CD8+ TILs. (H) Gene expression patterns from K-means clustering of all CD8+ subsets. Gene set enrichment using genes from each cluster, compared with common effector CD8+ T cell signatures from yellow fever D14 and LCMV Arm. (I) Normalized gene counts showing expression of selected genes in the sorted CD8+ T cell populations. (J) Schematic of the number of methylated regions that are at least 25% different from naive in the TDLN and tumor CD8+ T cell populations. Black numbers show methylated regions, and blue numbers show demethylated regions. (K) Specific methylation changes in TCF7. Traces show total methylation in regions. Boxed regions show significantly differentially methylated regions. Dot plots showed methylation of each CpG in boxed region. Median and 95% confidence intervals (CIs) are shown. *p < 0.05 determined by Mann-Whitney test.
Figure 2.
Figure 2.. Tumor-specific CD8+ T cells activated in TDLNs to acquire a stem-like phenotype
(A) Representative plot of tumor-specific CD8s in 5-week TRAMPC1-GP tumors and TDLNs. (B) Phenotype of CD44+PD1+ tumor-specific CD8+ T cells in tumor and TDLN. (C) Phenotype of CD44+PD1+ CD8+ T cell populations. (D) Experimental setup of early activation of P14 CD8+ T cells. (E) Flow cytometry of PD1 and CD62L expression by CTV of P14s activated in each respective model. (F) Flow cytometry of TIM3 and Tcf1 expression by CTV of P14s activated in each respective model. Median and 95% confidence intervals (CIs) are shown. *p < 0.05 determined by Mann-Whitney test.
Figure 3.
Figure 3.. Tumor-specific CD8+ T cells activated in TDLNs do not acquire an effector transcriptional or epigenetic program
(A) Sorting scheme to isolate P14s by division in LCMV Armstrong spleen and TDLNs from TRAMPC1-GP-bearing mice. (B) PCA of naive P14s, P14s activated in LCMV Arm, and P14s activated in TRAMPC1-GP TDLNs by division. (C) Heatmap of Z score log2 expression of selected genes. (D) GSEA using the gene signature from mouse tumor-specific stem-like CD8+ T cells, compared with P14s from LCMV Arm and TDLN. Enrichment score is plotted. (E) Schematic of number of regions with at least 15% difference in methylation from naive P14s, as P14s divide; black numbers represent methylated regions, and blue numbers represent de-methylated regions. (F) Regions of methylation in P14s Div2 from either LCMV Arm or TRAMPC1-GP TDLN plotted versus naive P14s. Colored regions represent at least 15% difference in methylation, compared with naive P14s. (G and H) Clustering using unbiased K-means of regions demethylated in P14s from LCMV Arm, compared with naive; the same regions were plotted in P14s from TRAMPC1-GP TDLNs. Cluster 1 shown in (G), Cluster 2 shown in (H). Heatmap of Z scored %methylation of select genes is shown. (I and J) Traces show total methylation from 0% to 100% in regions near Gzmb (G) and Ifng (H). Boxed regions show significantly differentially methylated regions. Dot plots showed methylation of each CpG in boxed region.
Figure 4.
Figure 4.. Tumor-specific CD8+ T cells only acquire effector phenotype after migration into the tumor
(A) Experimental setup for P14 transfers to study kinetics of tumor infiltration. Analysis of P14 phenotype in both TRAMPC1-GP and B16-GP tumors over the time course. P14s gated on CD44+PD1+. (B) Summaries of total P14s in TRAMPC1-GP TDLNs and tumors over time course. (C) Representative flow cytometry of intracellular cytokine staining (ICCS) of IFNγ and TNF-α, gated on CD44+PD1+ P14s. (D) Experimental setup for P14 TDLN re-transfer into tumor-matched mice. (E) Flow cytometry gating of re-transferred P14s in TDLNs and tumors of congenically mismatched recipients. (F) Analysis of phenotype of re-transferred P14s. (G and H) Summary plot of CD62L (G) and GzmB (H) expression of re-transferred P14s. Different shapes (circle/square/triangle) indicate to which of the 3 separate experiments each sample belongs. (I) Heatmap of Z scored log2 expression of genes in naive P14s, sorted activated P14s D7 post transfer from TRAMPC1-GP TDLNs, endogenous tumor-stem-like CD8s, and endogenous TD CD8s. (J) PCA of T cell subsets. (K) Analysis of differentially methylated regions, using previously defined cluster of genes demethylated in P14s from LCMV Arm (cluster 1, Figure 3G). Plot shows cluster 1 differentially methylated regions’ T cells from various conditions. (L) Specific methylation changes in Gzmb and Ifng. Traces show total methylation from 0% to 100% in regions near both genes. Boxed regions show significantly differentially methylated regions. Dot plots show methylation of each CpG in boxed region. Median and 95% confidence intervals (CIs) are shown. *p < 0.05 determined by Mann-Whitney test.
Figure 5.
Figure 5.. Co-stimulation from antigen-presenting cells promotes tumor-specific CD8+ T cell differentiation
(A) tSNE clustering of antigen-presenting cells (APCs) sorted from naive LN, TDLN, and tumors of 5-week TRAMPC1-GP-bearing mice. (B) tSNE clustering split by tissue origin, with proportions of each cluster from each tissue represented in a bar graph; each APC population is significantly different between TDLN and tumor. (C) Flow cytometry analysis of DC subsets from TDLN and tumor from TRAMPC1-GP-bearing mice. (D) Flow cytometry analysis of co-stimulatory molecules in CD11b+ DCs in naive LNs, TDLNs, and tumors from TRAMPC1-GP-bearing mice. (E) Experimental setup. P14s were transferred into 4-week TRAMPC1-GP tumor-bearing mice, and 5 days post transfer, they were treated with CpG and/or CD80/CD86 blocking antibodies for 10 days. (F and G) Phenotype of transferred PD1+ CD44+ P14s 15 days post transfer in the TDLNs and tumors of all treatment groups (F) and summaries of P14 phenotype (G). Median and 95% confidence intervals (CIs) are shown. *p < 0.05 determined by Mann-Whitney test.
Figure 6.
Figure 6.. Co-stimulation from dominant CDC2s and mo-DCs in human tumors predicts CD8+ T cell infiltration
(A) tSNE clustering of single-cell RNA-seq of APCs from two patients’ kidney tumor samples. (B) VISION analysis of gene signatures associated with APC subsets from human tissues. tSNE plots show the top quintile of cells enriched for the signature highlighted in blue. (C) Normalized gene expressions of selected genes that define the monocyte and DC cluster are shown. (D) Flow cytometry analysis of 152 kidney tumors, gating to distinguish three DC subsets. (E) Summary of three DC subsets in 34 prostate tumors. (F) Representative flow cytometry plots of high and low CD8+-infiltrated kidney tumors. PD1 and CD39 expression shown to denote TD CD8+ TILS. (G) Expression of co-stimulatory molecules on mo-DCs and cDC2s in kidney tumors from high and low CD8+ T cell tumors. (H) TCGA data from top 8 represented tumor types. Correlation of CD86 expression versus perforin (PRF1) expression shown. Heatmap of correlations between other co-stimulatory molecules versus effector and cytotoxic genes. (I) Experimental layout to test the capacity of different DC subsets from tumors to induce differentiation of autologous tumor-stem-like CD8+ T cells. (J) Representative plots showing CTV dilution and phenotype after 7 days of stem-like CD8+ T cell co-culture with irradiated mo-DCs. Medians and 95% CIs are represented. *p < 0.05 determined by Mann-Whitney test.
Figure 7.
Figure 7.. Co-stimulation is necessary for the differentiation of human tumor-stem-like CD8+ T cells
(A) Experimental layout to test the requirement of co-stimulation to differentiate sorted tumor-stem-like CD8+ T cells. (B) Summary plot shows the proportion of divided CD8+ T cells in each in vitro condition, based on CTV dilution. (C) Representative plots showing CTV dilution and phenotype after 5 days of culture in each condition. (D) Representative plots showing CTV dilution and expression of GZMB of control in vitro stimulations or with added IL-12. (E) Histograms showing expression of TIM3, CD39, and Tbet for all conditions. Medians and 95% CIs are represented. *p < 0.05 determined by Mann-Whitney test. *p < 0.05 determined by Wilcoxon test when sufficient paired samples were analyzed, shown as connected by a line.

Similar articles

Cited by

References

    1. Jansen CS, Prokhnevska N, Master VA, Sanda MG, Carlisle JW, Bilen MA, Cardenas M, Wilkinson S, Lake R, Sowalsky AG, et al. (2019). An intra-tumoral niche maintains and differentiates stem-like CD8 T cells. Nature 576, 465–470. 10.1038/s41586-019-1836-5. - DOI - PMC - PubMed
    1. Galon J, Costes A, Sanchez-Cabo F, Kirilovsky A, Mlecnik B, Lagorce-Pagè s C, Tosolini M, Camus M, Berger A, Wind P, et al. (2006). Type, density, and location of immune cells within human colorectal tumors predict clinical outcome. Science 313, 1960–1964. 10.1126/science.1129139. - DOI - PubMed
    1. Azimi F, Scolyer RA, Rumcheva P, Moncrieff M, Murali R, McCarthy SW, Saw RP, and Thompson JF (2012). Tumor-infiltrating lymphocyte grade is an independent predictor of sentinel lymph node status and survival in patients with cutaneous melanoma. J. Clin. Oncol. 30, 2678–2683. 10.1200/JCO.2011.37.8539. - DOI - PubMed
    1. Pagès F, Berger A, Camus M, Sanchez-Cabo F, Costes A, Molidor R, Mlecnik B, Kirilovsky A, Nilsson M, Damotte D, et al. (2005). Effector memory T cells, early metastasis, and survival in colorectal cancer. N. Engl. J. Med. 353, 2654–2666. 10.1056/NEJMoa051424. - DOI - PubMed
    1. Herbst RS, Soria J-C, Kowanetz M, Fine GD, Hamid O, Gordon MS, Sosman JA, McDermott DF, Powderly JD, Gettinger SN, et al. (2014). Predictive correlates of response to the anti-PD-L1 antibody MPDL3280A in cancer patients. Nature 515, 563–567. 10.1038/nature14011. - DOI - PMC - PubMed

Publication types