Telomeres are shorter in wild Saccharomyces cerevisiae isolates than in domesticated ones
- PMID: 36563016
- PMCID: PMC9991508
- DOI: 10.1093/genetics/iyac186
Telomeres are shorter in wild Saccharomyces cerevisiae isolates than in domesticated ones
Abstract
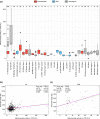
Telomeres are ribonucleoproteins that cap chromosome-ends and their DNA length is controlled by counteracting elongation and shortening processes. The budding yeast Saccharomyces cerevisiae has been a leading model to study telomere DNA length control and dynamics. Its telomeric DNA is maintained at a length that slightly varies between laboratory strains, but little is known about its variation at the species level. The recent publication of the genomes of over 1,000 S. cerevisiae strains enabled us to explore telomere DNA length variation at an unprecedented scale. Here, we developed a bioinformatic pipeline (YeaISTY) to estimate telomere DNA length from whole-genome sequences and applied it to the sequenced S. cerevisiae collection. Our results revealed broad natural telomere DNA length variation among the isolates. Notably, telomere DNA length is shorter in those derived from wild rather than domesticated environments. Moreover, telomere DNA length variation is associated with mitochondrial metabolism, and this association is driven by wild strains. Overall, these findings reveal broad variation in budding yeast's telomere DNA length regulation, which might be shaped by its different ecological life-styles.
Keywords: S. cerevisiae; domestication; evolution; natural variation; population genomics; telomere; yeast.
© The Author(s) 2022. Published by Oxford University Press on behalf of the Genetics Society of America. All rights reserved. For permissions, please e-mail: journals.permissions@oup.com.
Figures


Similar articles
-
Simultaneous visualisation of the complete sets of telomeres from the MmeI generated terminal restriction fragments in yeasts.Yeast. 2020 Nov;37(11):585-595. doi: 10.1002/yea.3517. Epub 2020 Aug 15. Yeast. 2020. PMID: 32776370
-
A genomewide suppressor and enhancer analysis of cdc13-1 reveals varied cellular processes influencing telomere capping in Saccharomyces cerevisiae.Genetics. 2008 Dec;180(4):2251-66. doi: 10.1534/genetics.108.092577. Epub 2008 Oct 9. Genetics. 2008. PMID: 18845848 Free PMC article.
-
Linear chromosome maintenance in the absence of essential telomere-capping proteins.Nat Cell Biol. 2006 Jul;8(7):734-40. doi: 10.1038/ncb1428. Epub 2006 Jun 11. Nat Cell Biol. 2006. PMID: 16767084
-
Fine tuning the level of the Cdc13 telomere-capping protein for maximal chromosome stability performance.Curr Genet. 2019 Feb;65(1):109-118. doi: 10.1007/s00294-018-0871-3. Epub 2018 Jul 31. Curr Genet. 2019. PMID: 30066139 Review.
-
Regulation of telomerase by telomeric proteins.Annu Rev Biochem. 2004;73:177-208. doi: 10.1146/annurev.biochem.73.071403.160049. Annu Rev Biochem. 2004. PMID: 15189140 Review.
Cited by
-
Linking telomere dynamics to evolution, life history and environmental change: perspectives, predictions and problems.Biogerontology. 2024 Apr;25(2):301-311. doi: 10.1007/s10522-023-10081-8. Epub 2024 Jan 22. Biogerontology. 2024. PMID: 38252370 Free PMC article. Review.
-
Whole genome sequencing of Canadian Saccharomyces cerevisiae strains isolated from spontaneous wine fermentations reveals a new Pacific West Coast Wine clade.G3 (Bethesda). 2023 Aug 9;13(8):jkad130. doi: 10.1093/g3journal/jkad130. G3 (Bethesda). 2023. PMID: 37307358 Free PMC article.
-
Telomere DNA length regulation is influenced by seasonal temperature differences in short-lived but not in long-lived reef-building corals.Nat Commun. 2023 Jun 1;14(1):3038. doi: 10.1038/s41467-023-38499-1. Nat Commun. 2023. PMID: 37263999 Free PMC article.
-
Methods that shaped telomerase research.Biogerontology. 2024 Apr;25(2):249-263. doi: 10.1007/s10522-023-10073-8. Epub 2023 Oct 31. Biogerontology. 2024. PMID: 37903970 Free PMC article. Review.
References
Publication types
MeSH terms
Substances
LinkOut - more resources
Full Text Sources
Molecular Biology Databases
Miscellaneous

