Modeling cartilage pathology in mucopolysaccharidosis VI using iPSCs reveals early dysregulation of chondrogenic and metabolic gene expression
- PMID: 36561048
- PMCID: PMC9763729
- DOI: 10.3389/fbioe.2022.949063
Modeling cartilage pathology in mucopolysaccharidosis VI using iPSCs reveals early dysregulation of chondrogenic and metabolic gene expression
Abstract
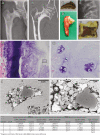
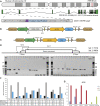
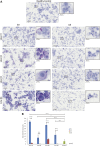
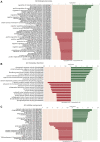
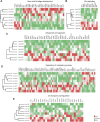
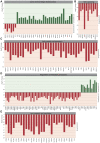
Mucopolysaccharidosis type VI (MPS VI) is a metabolic disorder caused by disease-associated variants in the Arylsulfatase B (ARSB) gene, resulting in ARSB enzyme deficiency, lysosomal glycosaminoglycan accumulation, and cartilage and bone pathology. The molecular response to MPS VI that results in cartilage pathology in human patients is largely unknown. Here, we generated a disease model to study the early stages of cartilage pathology in MPS VI. We generated iPSCs from four patients and isogenic controls by inserting the ARSB cDNA in the AAVS1 safe harbor locus using CRISPR/Cas9. Using an optimized chondrogenic differentiation protocol, we found Periodic acid-Schiff positive inclusions in hiPSC-derived chondrogenic cells with MPS VI. Genome-wide mRNA expression analysis showed that hiPSC-derived chondrogenic cells with MPS VI downregulated expression of genes involved in TGF-β/BMP signalling, and upregulated expression of inhibitors of the Wnt/β-catenin signalling pathway. Expression of genes involved in apoptosis and growth was upregulated, while expression of genes involved in glycosaminoglycan metabolism was dysregulated in hiPSC-derived chondrogenic cells with MPS VI. These results suggest that human ARSB deficiency in MPS VI causes changes in the transcriptional program underlying the early stages of chondrogenic differentiation and metabolism.
Keywords: cartilage; disease modeling; induced pluripotent stem cells; lysosomal storage disease; mucopolysaccharidosis type VI.
Copyright © 2022 Broeders, van Rooij, Oussoren, van Gestel, Smith, Kimber, Verdijk, Wagenmakers, van den Hout, van der Ploeg, Narcisi and Pijnappel.
Conflict of interest statement
The authors declare that the research was conducted in the absence of any commercial or financial relationships that could be construed as a potential conflict of interest.
Figures

Similar articles
-
Generation of a novel disease model mouse for mucopolysaccharidosis type VI via c. 252T>C human ARSB mutation knock-in.Biochem Biophys Rep. 2022 Aug 12;31:101321. doi: 10.1016/j.bbrep.2022.101321. eCollection 2022 Sep. Biochem Biophys Rep. 2022. PMID: 36032399 Free PMC article.
-
Mutations in ARSB in MPS VI patients in India.Mol Genet Metab Rep. 2015 Jul 17;4:53-61. doi: 10.1016/j.ymgmr.2015.06.002. eCollection 2015 Sep. Mol Genet Metab Rep. 2015. PMID: 26937411 Free PMC article.
-
[Analysis of clinical features and arylsulfatase B gene mutation in thirteen Chinese children with mucopolysaccharidosis type VI].Zhonghua Er Ke Za Zhi. 2014 Jun;52(6):403-8. Zhonghua Er Ke Za Zhi. 2014. PMID: 25190157 Chinese.
-
Mucopolysaccharidosis type VI (MPS VI) and molecular analysis: Review and classification of published variants in the ARSB gene.Hum Mutat. 2018 Dec;39(12):1788-1802. doi: 10.1002/humu.23613. Epub 2018 Sep 17. Hum Mutat. 2018. PMID: 30118150 Free PMC article. Review.
-
Diagnostic and treatment strategies in mucopolysaccharidosis VI.Appl Clin Genet. 2015 Oct 30;8:245-55. doi: 10.2147/TACG.S68650. eCollection 2015. Appl Clin Genet. 2015. PMID: 26586959 Free PMC article. Review.
Cited by
-
Enhanced Efficiency of the Basal and Induced Apoptosis Process in Mucopolysaccharidosis IVA and IVB Human Fibroblasts.Int J Mol Sci. 2023 Sep 14;24(18):14119. doi: 10.3390/ijms241814119. Int J Mol Sci. 2023. PMID: 37762422 Free PMC article.
-
Evidence of epigenetic landscape shifts in mucopolysaccharidosis IIIB and IVA.Sci Rep. 2024 Feb 17;14(1):3961. doi: 10.1038/s41598-024-54626-4. Sci Rep. 2024. PMID: 38368436 Free PMC article.
References
-
- Acharya C., Yik J. H., Kishore A., Van Dinh V., Di Cesare P. E., Haudenschild D. R. (2014). Cartilage oligomeric matrix protein and its binding partners in the cartilage extracellular matrix: Interaction, regulation and role in chondrogenesis. Matrix Biol. 37, 102–111. 10.1016/j.matbio.2014.06.001 - DOI - PubMed
LinkOut - more resources
Full Text Sources
Molecular Biology Databases

