. 2022 Nov 24;14(12):2582.
doi: 10.3390/pharmaceutics14122582.

Diallyl Disulfide Induces Chemosensitization to Sorafenib, Autophagy, and Cell Cycle Arrest and Inhibits Invasion in Hepatocellular Carcinoma

Affiliations

Diallyl Disulfide Induces Chemosensitization to Sorafenib, Autophagy, and Cell Cycle Arrest and Inhibits Invasion in Hepatocellular Carcinoma

Ana Rita Thomazela Machado et al. Pharmaceutics. .

Abstract

Hepatocellular carcinoma is the seventh most common type of cancer in the world, with limited treatment options. A promising strategy to treat cancer is to associate chemotherapeutics and plant bioactive compounds. Here, we examined whether diallyl disulfide (DADS; 50-200 μM) and sorafenib (SORA; 8 μM), either alone or in combination, were toxic to hepatocellular carcinoma cells (HepG2) in vitro. We assessed whether DADS and/or SORA induced cell death (LIVE/DEAD assay and autophagy) and cell cycle changes (flow cytometry), altered expression of key genes and proteins (RT-qPCR and Western blot), and modulated tumorigenesis signatures, such as proliferation (clonogenic assay), migration (wound healing), and invasion (inserts). The DADS + SORA combination elicited autophagic cell death by upregulating LC3 and NRF2 expression and downregulating FOS and TNF expression; induced the accumulation of cells in the G1 phase which thereby upregulated the CHEK2 expression; and inhibited invasion by downregulating the MMP2 expression. Predictive analysis indicated the participation of the MAPK pathway in the reported results. The DADS + SORA combination suppressed both cell invasion and clonogenic survival, which indicated that it dampened tumor growth, proliferation, invasion, and metastatic potential. Therefore, the DADS + SORA combination is a promising therapy to develop new clinical protocols.

Keywords: Allium sativum L.; DNA damage; liver cancer; nutraceutical; nutrigenomics.


Conflict of interest statement

The authors declare no conflict of interest.

Figures

Figure 1
Figure 1
Cell viability of HepG2 cells treated with diallyl disulfide (DADS) and sorafenib (SORA). Representative images of HepG2 cells treated with DADS and SORA, either alone (A) or in combination (C). Calcein-positive cells (green) are viable; ethidium homodimer-positive cells (red) are dead. HepG2 cells were treated with DADS (50–200 μM) and SORA (8 µM), either alone (A,B) or in combination (C,D), for 72 h, and cell viability was assessed using the LIVE/DEAD® assay kit. NC: negative control (culture medium); SC: vehicle control (0.25% DMSO). Results are expressed as mean ± standard deviation (n = 3). Distinct letters indicate statistical significance (p < 0.05; ANOVA and Tukey’s post-test). Scale bar: 75 µm.
Figure 2
Figure 2
Cell viability of HUVEC cells treated with diallyl disulfide (DADS) and sorafenib (SORA). Representative images of HUVEC cells treated with DADS and SORA, either alone (A) or in combination (C). Calcein-positive cells (green) are viable; ethidium homodimer-positive cells (red) are dead. HUVEC cells were treated with DADS (50–200 μM) and SORA (8 µM), either alone (A,B) or in combination (C,D), for 72 h, and cell viability was assessed using the LIVE/DEAD® assay kit. NC: negative control (culture medium); SC: vehicle control (0.25% DMSO). Results are expressed as mean ± standard deviation (n = 3). Distinct letters indicate statistical significance (p < 0.05; ANOVA and Tukey’s post-test). Scale bar: 75 µm.
Figure 3
Figure 3
Inhibition of HepG2 and HUVEC cell proliferation by diallyl disulfide (DADS) and sorafenib (SORA). Survival fraction of HepG2 (A,C) and HUVEC (B,D) cells treated with DADS and SORA alone (A,B) or in combination (C,D) for 72 h and 12 days, as assessed by the clonogenic assay of cell proliferation. NC: negative control (culture medium); SC: vehicle control (0.25% DMSO). Results are expressed as mean ± standard deviation (n = 3). Distinct letters indicate statistical significance (p < 0.05; ANOVA and Tukey’s post-test). * p < 0.05 vs. negative control (Student’s t test).
Figure 4
Figure 4
Autophagy-mediated cell death in HepG2 cells induced by diallyl disulfide (DADS) and sorafenib (SORA). Autophagy-induced cell death in HepG2 cells after 24 h of treatment with SORA and DADS, either alone or in combination. (A) Photomicrograph of autophagosomes labeled in green and cell nuclei labeled in blue. (B) Autophagy induction after treatment with DADS (50, 100, and 200 µM) and SORA (8 µM) alone. (C) Autophagy induction after treatment with DADS (50, 100, and 200 µM) and SORA (8 µM) in combination. NC: negative control (culture medium); SC: vehicle control (0.25 % DMSO); PC: positive control (100 μM chloroquine). Mean ± standard deviation (n = 3). Distinct letters indicate significant difference (p < 0.05; one-way ANOVA and Tukey’s post-test). * p < 0.05 vs. negative control (Student’s t test). Scale bar = 75 µm.
Figure 5
Figure 5
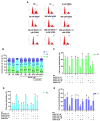
Distribution across the cell cycle phases of HepG2 cells treated with diallyl disulfide (DADS) and sorafenib (SORA). Cell cycle regulation by SORA and DADS after 72 h of treatment, as assessed by flow cytometry. (A) Flow cytometry histograms of HepG2 cells treated with DADS and SORA, either alone or in combination, and stained with propidium iodide. (B) Cell cycle profile of cells treated with DADS and SORA alone. (CE) Distribution of HepG2 cells in the G1 (C), G2 (D), and S (E) phase of the cell cycle after treatment with DADS and SORA, either alone or in combination, and DNA labeling with propidium iodide. NC: negative control (culture medium); SC: vehicle control (0.25% DMSO); SORA: sorafenib; DADS: diallyl disulfide. Distinct letters indicate significant difference within the same group (p < 0.05; two-way ANOVA and Tukey’s post-test). Data are expressed as mean ± standard deviation of three independent experiments. * p < 0.05 vs. negative control (Student’s t test).
Figure 6
Figure 6
Inhibition of HepG2 cell migration by diallyl disulfide (DADS) and sorafenib (SORA). Representative images from in vitro scratch wound healing assay demonstrating cell migration into the cell-free region (A) after treatment with different concentrations of DADS (50, 100, and 200 μM) and SORA (8 μM), either alone or in combination, for 0, 6, 12, 24, and 48 h in HepG2 cells isolated (B) and combined treatment (C). Wound healing (%) was calculated from the migration distance of HepG2 cells from the control group relative to the treated groups. NC: negative control (PBS); SC: vehicle control (0.25% DMSO); PC: positive control (300 μM MMS). Data are expressed as mean ± standard deviation (n = 3) and analyzed by one-way ANOVA and Dunnett’s post-test (p < 0.05). * p < 0.05 vs. negative control (Student’s t test). Scale bar: 50 µm.
Figure 7
Figure 7
Insert-mediated cell invasion in HepG2 cells treated with diallyl disulfide (DADS) and sorafenib (SORA). (A) Representative images the adherent cell monolayer of HepG2 cells treated for 48 h with DADS and SORA, either alone or in combination, as recorded with a camera coupled to an inverted microscope. B-C Relative cell migration of HepG2 cells treated with DADS and SORA, either alone (B) or in combination (C). Cells (%) was calculated from the migration distance of HepG2 cells from the control group relative to the treated groups. NC: negative control (PBS); SC: vehicle control (0.25% DMSO); PC: positive control (300 μM MMS). Data are expressed as mean ± standard deviation (n = 3) and analyzed by one-way ANOVA and Dunnett’s post-test (p < 0.05). * p < 0.05 vs. negative control (Student’s t test). Distinct letters indicate statistical significance. Scale bar: 50 µm.
Figure 8
Figure 8
Relative expression of genes and proteins in HepG2 cells treated with diallyl disulfide (DADS) and sorafenib (SORA). (A) RT-qPCR analysis of the expression levels of TNF, MMP2, FOS, and CHEK2 genes relative to the reference genes ACTB, GAPDH, and HPRT1 in HepG2 cells treated for 24 h with DADS and SORA, either alone or in combination. (B) Representative image of Western blot protein bands. (C) Fold change of protein bands quantified using the ImageJ software. SC: vehicle control (0.25% DMSO); DADS: 50 µM diallyl disulfide; SORA: 8 µM sorafenib. Representative data from three independent experiments with similar results. * p < 0.05 (Student’s t test).
Figure 9
Figure 9
Predicted interactions among diallyl disulfide, sorafenib, genes, and proteins using the STITCH database. Gray lines represent interaction among proteins. Green lines represent interactions between compounds and proteins. Source: STITCH (http://stitch.embl.de/cgi/network.pl?taskId=nv9TPmaTyMjt (accessed on 30 August 2022).

Similar articles

Cited by

References

    1. Chacko S., Samanta S. Hepatocellular carcinoma: A life-threatening disease. Biomed. Pharmacother. 2016;84:1679–1688. doi: 10.1016/j.biopha.2016.10.078. - DOI - PubMed
    1. Hsieh T.C., Wu Y.C., Sun S.S., Yen K.Y., Kao C.H. Treating hepatocellular carcinoma with (90)Y-bearing microspheres: A review. Biomedicine. 2016;6:19. doi: 10.7603/s40681-016-0019-z. - DOI - PMC - PubMed
    1. Llovet J.M., Zucman-Rossi J., Pikarsky E., Sangro B., Schwartz M., Sherman M., Gores G. Hepatocellular carcinoma. Nat. Rev. Dis. Prim. 2016;2:16018. doi: 10.1038/nrdp.2016.18. - DOI - PubMed
    1. Brunetti O., Gnoni A., Licchetta A., Longo V., Calabrese A., Argentiero A., Delcuratolo S., Solimando A.G., Casadei-Gardini A., Silvestris N. Predictive and Prognostic Factors in HCC Patients Treated with Sorafenib. Medicina. 2019;55:707. doi: 10.3390/medicina55100707. - DOI - PMC - PubMed
    1. Abdel-Hamid N.M., Abass S.A., Mohamed A.A., Muneam Hamid D. Herbal management of hepatocellular carcinoma through cutting the pathways of the common risk factors. Biomed. Pharmacother. 2018;107:1246–1258. doi: 10.1016/j.biopha.2018.08.104. - DOI - PMC - PubMed

LinkOut - more resources