. 2022 Dec 12;12(12):1253.
doi: 10.3390/metabo12121253.

Target Metabolites to Slow Down Progression of Amyotrophic Lateral Sclerosis in Mice

Affiliations

Target Metabolites to Slow Down Progression of Amyotrophic Lateral Sclerosis in Mice

Destiny Ogbu et al. Metabolites. .

Abstract

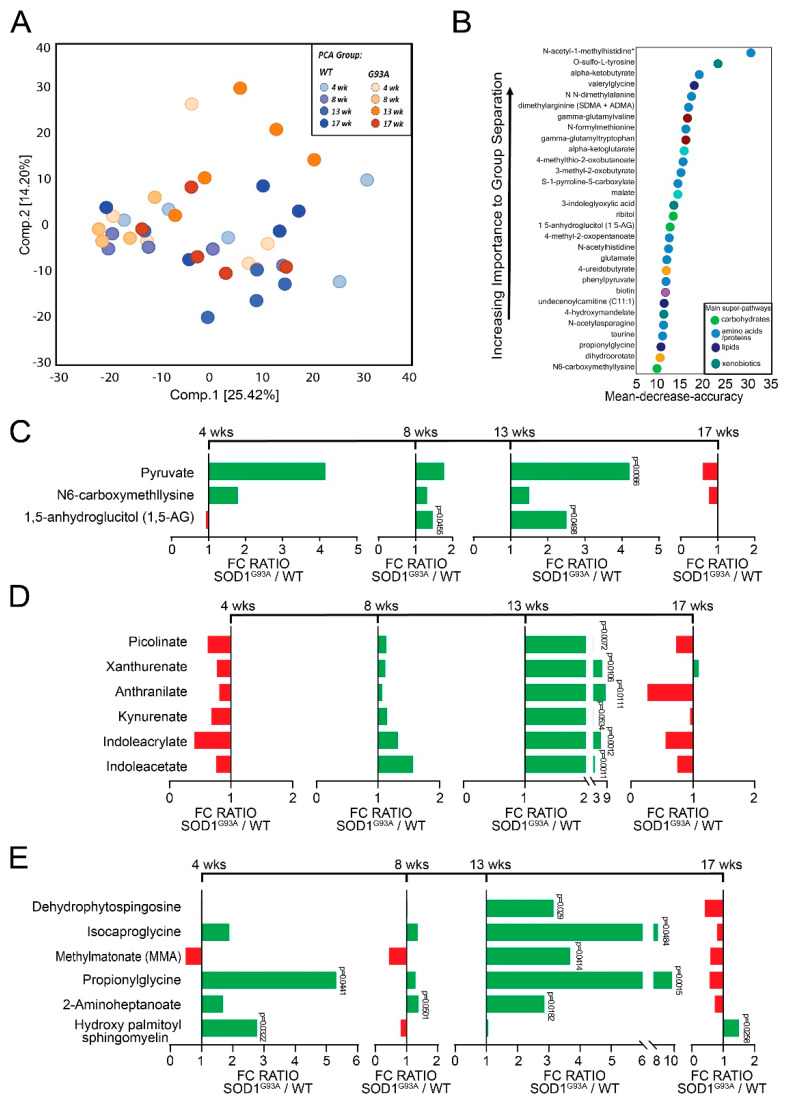
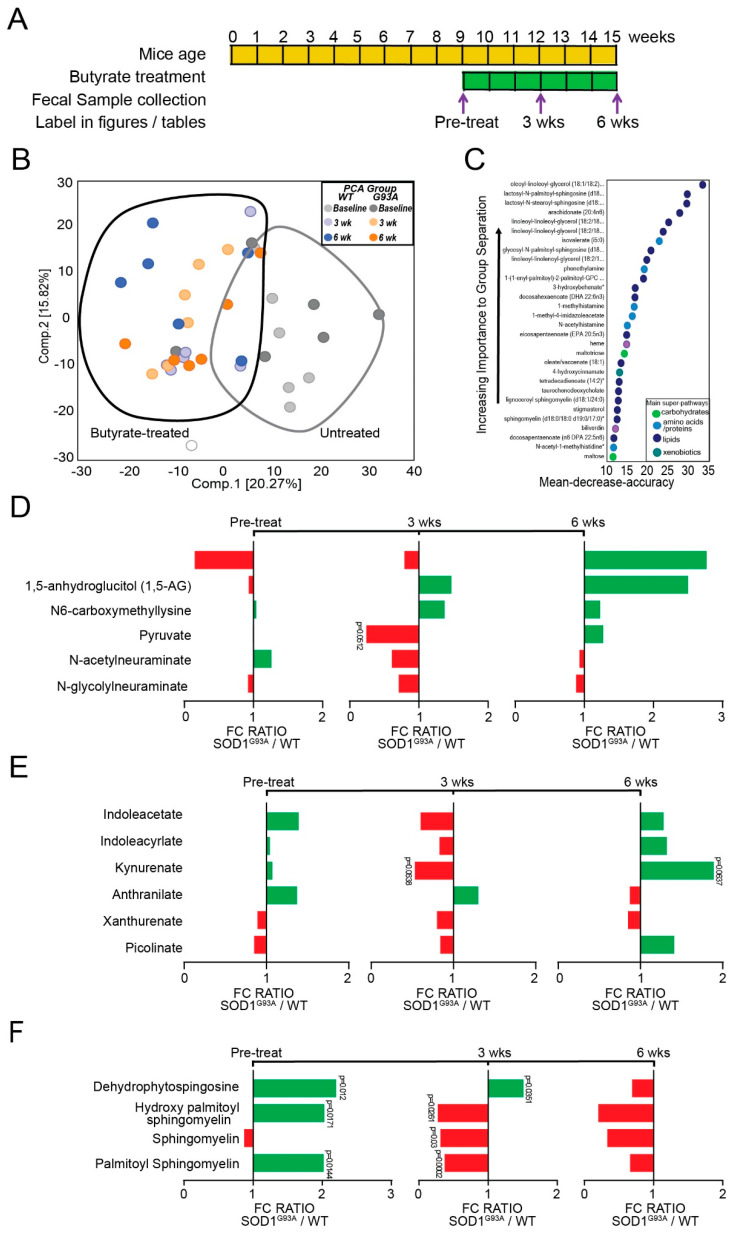
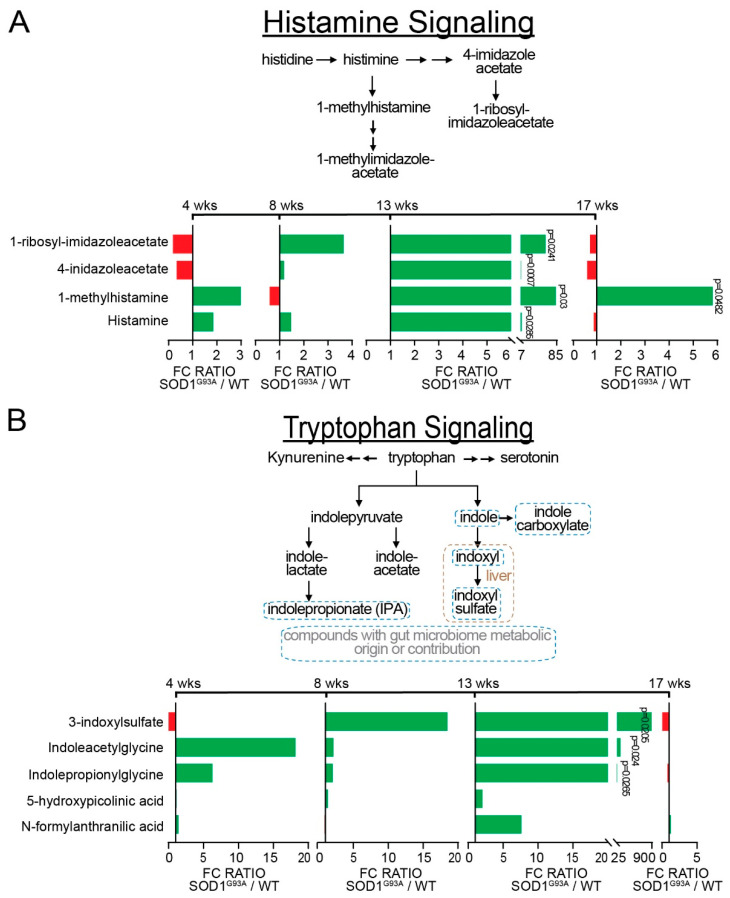
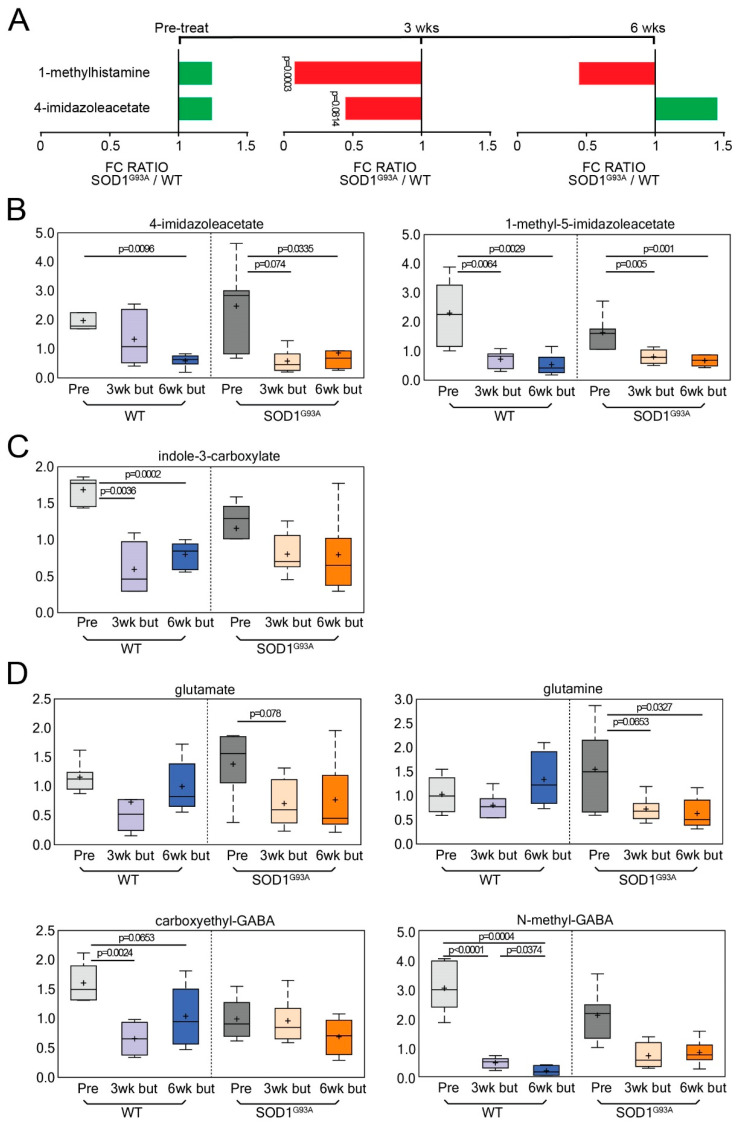
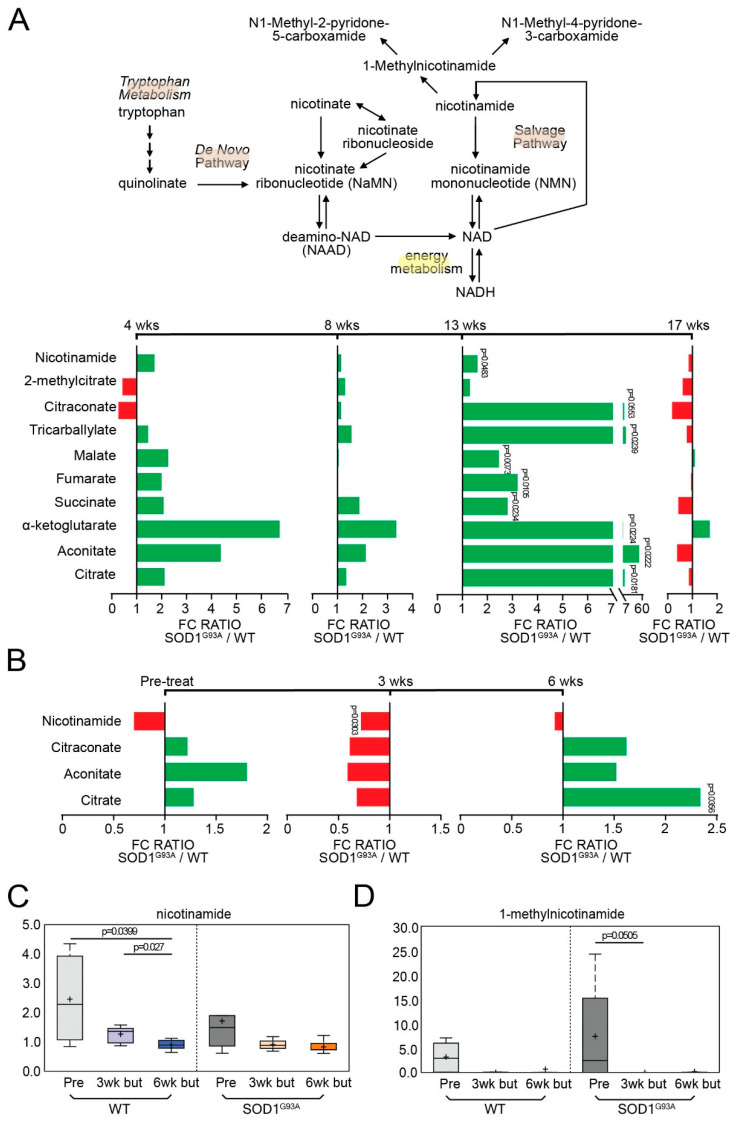
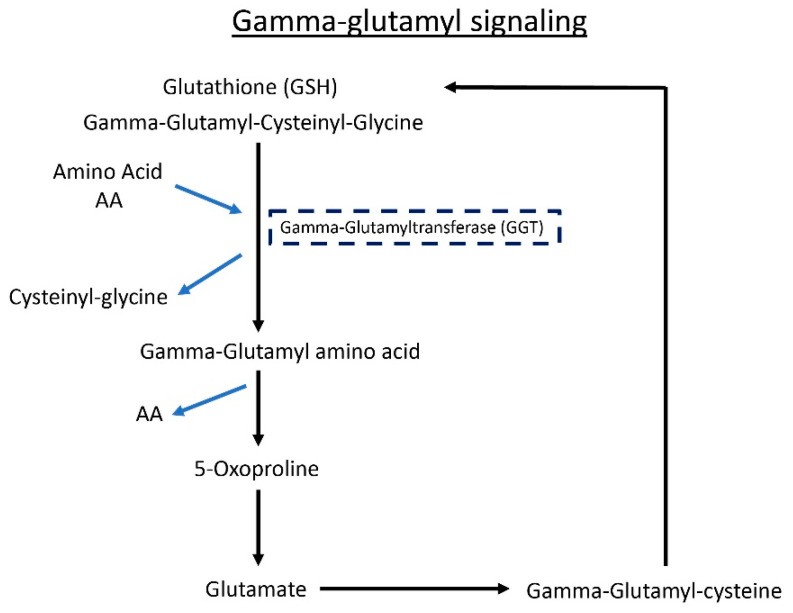
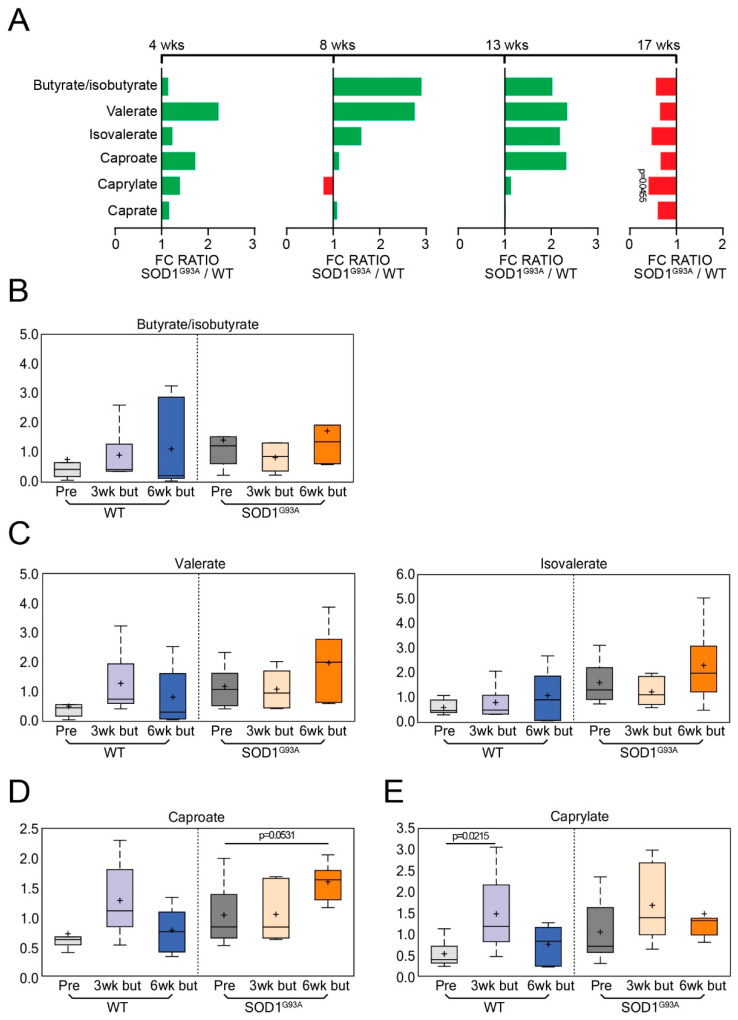
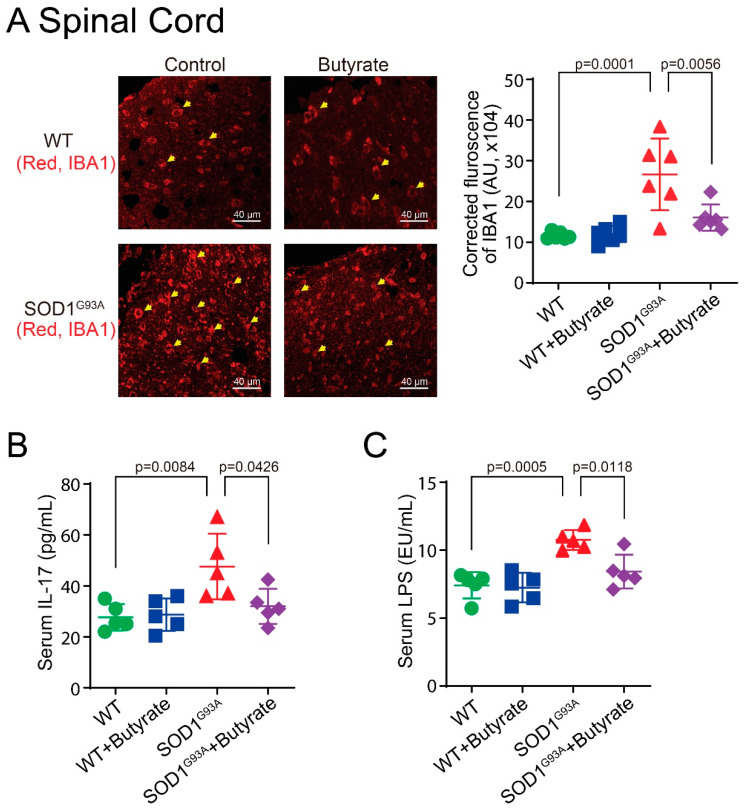
Microbial metabolites affect the neuron system and muscle cell functions. Amyotrophic lateral sclerosis (ALS) is a multifactorial neuromuscular disease. Our previous study has demonstrated elevated intestinal inflammation and dysfunction of the microbiome in patients with ALS and an ALS mouse model (human-SOD1G93A transgenic mice). However, the metabolites in ALS progression are unknown. Using an unbiased global metabolomic measurement and targeted measurement, we investigated the longitudinal changes of fecal metabolites in SOD1G93A mice over the course of 13 weeks. We further compared the changes of metabolites and inflammatory response in age-matched wild-type (WT) and SOD1G93A mice treated with the bacterial product butyrate. We found changes in carbohydrate levels, amino acid metabolism, and the formation of gamma-glutamyl amino acids. Shifts in several microbially contributed catabolites of aromatic amino acids agree with butyrate-induced changes in the composition of the gut microbiome. Declines in gamma-glutamyl amino acids in feces may stem from differential expression of gamma-glutamyltransferase (GGT) in response to butyrate administration. Due to the signaling nature of amino acid-derived metabolites, these changes indicate changes in inflammation, e.g., histamine, and contribute to differences in systemic levels of neurotransmitters, e.g., γ-Aminobutyric acid (GABA) and glutamate. Butyrate treatment was able to restore some of the healthy metabolites in ALS mice. Moreover, microglia in the spinal cord were measured by IBA1 staining. Butyrate treatment significantly suppressed the IBA1 level in the SOD1G93A mice. Serum IL-17 and LPS were significantly reduced in the butyrate-treated SOD1G93A mice. We have demonstrated an inter-organ communications link among microbial metabolites, neuroactive metabolites from the gut, and inflammation in ALS progression. The study supports the potential to use metabolites as ALS hallmarks and for treatment.

Keywords: ALS; CNS; FALS; SALS; dysbiosis; immunity; inflammation; longitudinal analysis; metabolites; neuromuscular disease; protein aggregation.


Conflict of interest statement

The authors declare no conflict of interest.

Figures

Figure 1
Figure 1
Impact of butyrate treatment on metabolite profile in ALS mice over the course of the disease. (A) PCA comparing the biochemical similarity between WT and SOD1G93A mice over the course of disease. (B) Random forest (RF) analysis showing the top 30 most important metabolites that differed between WT and SOD1G93A mice over the course of disease. The variables are ordered top to bottom as most to least important. Different colors indicate specific metabolites resulting from different superpathways: green = carbohydrate, light blue = amino acid, blue = lipids, and teal = xenobiotics. Biochemical Name * indicates compounds that have not been officially confirmed based on a standard, but the identity was confirmed by Metabolon (Morrisville, NC, USA). (CE) Welch’s t-tests are used to compare the fold change ratios of the average concentrations of metabolites between SOD1G93A and WT at 4, 8, 13, and 17 weeks. Metabolites are categorized as: (C) carbohydrate, (D) amino acid, or (E) lipid. Fold-change ratios at 4; 8; 13; and 17 weeks generated by (C) carbohydrate (at week 13, pyruvate for q = 0.0797, 1,5-anhydroglucitol for q = 0.1313); (D) amino acid (at week 13 picolinate, q = 0.1281; for xanthurenate, q = 0.0879; for anthranilate, q = 0.0879; for kynurenate, q = 0.1350; for indoleacrylate, q = 0.0532; for indoleacetate, q = 0.0532); (E) lipid (at week 4 for propionylglycine, q = 0.632; for hydroxypalmitoyl sphingomyelin, q = 0.632. At week 8 for 2-aminoheptanoate, q = 0.8946. At week 13 for dehydrophytosphingosine, q = 0.1117; isocaprolylglycine, q = 0.1298; methylmalonate, q = 0.1298; for Propionylglycine, q = 0.0532; for 2-Aminoheptanoate, q = 0.1058. At week 17, for hydroxypalmitoyl sphingomyelin q = 0.9941) changes over time. Differences are assessed by the Welch’s two-sample t-test. WT (N = 5) and SOD1G93A (N = 5) mice. The p-values and q-values are listed for 4; 8; 13; and 17 weeks.
Figure 2
Figure 2
Effect of butyrate treatment on metabolite profile in ALS mice over the course of disease. (A) Schematic overview of the WT/SOD1G93A mice treated with butyrate. Male or female SOD1G93A mice were treated with or without 2% butyrate in drinking water starting with mice aged 9 weeks to 15 weeks. Fecal samples were harvested pre-treatment (mice age: 9 weeks), 3 weeks after butyrate treatment (mice age: 12 weeks), and 6 weeks (mice age: 15 weeks) after butyrate treatment. (B) PCA comparing the biochemical similarity between butyrate-treated WT and SOD1G93A mice. (C) RF showing the top 30 most important metabolites that differed between longitudinal butyrate-treated WT and SOD1G93A mice. The p-values and q-values are listed for pre-treatment; 3 weeks after butyrate treatment; and 6 weeks after butyrate treatment. Biochemical Name *: indicates compounds that have not been officially confirmed based on a standard, but the identity was confirmed by Metabolon (Morrisville, NC, USA).(DF) Welch’s t-tests are used to compare the fold-change ratios of the average concentrations of metabolites between SOD1G93A and WT pre-treatment, 3 weeks after butyrate treatment, and 6 weeks after butyrate treatment. Metabolites are categorized as: (D) carbohydrate, (E) amino acid, or (F) Lipid. Fold-change ratios generated by (D) carbohydrates (3 weeks after butyrate treatment, for pyruvate, q = 0.2546) (E) amino acids (3 weeks after butyrate treatment, for kynurenate, q = 0.2728; 6 weeks post butyrate treatment, for kynurenate, q = 0.3172) (F) lipid (pre-treatment, for dehydrophytosphingosine, q = 0.2687; for hydroxypalimotyl sphingomyelin, q = 0.2687; for palimitoyl sphingomyelin, q = 0.2687. 3 weeks post butyrate treatment, for dehydrophytosphingosine, q = 0.2295; for hydroxypalimotyl sphingomyelin, q = 0.2295; for hydroxypalimotyl sphingomyelin, q = 0.2295; for palimitoyl sphingomyelin, q = 0.037). Differences are assessed by the Welch’s two-sample t-test. WT (N = 6) and SOD1G93A (N = 6) mice.
Figure 3
Figure 3
ALS altered histamine and tryptophan signaling at onset. The p-values and q-values are listed for 4, 8, 13, and 17 weeks. (A) Schematic of histamine signaling and longitudinal changes demonstrated by ALS mice over 17 weeks. At week 13, the histidine metabolites are 1-ribosyl-imidazoleacetate (q = 0.1058); 4-imidazoleacetate (q = 0.0532); 1-methylhistamine (q = 0.1133); and histamine (q = 0.1117). At week 17, 1-methylhistamine (q = 0.9941); (B) Schematic of tryptophan signaling, and longitudinal changes demonstrated by ALS mice over 17 weeks. At week 13, the tryptophan metabolites are 3-indoxysulfate (q = 0.1058); indoleacetylglycine (q = 0.1058); and indolepropionylglycine (q = 0.1091). Differences are assessed by Welch’s two-sample t-test. WT (N = 5) and SOD1G93A (N = 5) mice.
Figure 4
Figure 4
Butyrate (but) treatment altered histamine and tryptophan signaling over the course of disease. The p-values and q-values are listed for pre-treatment, 3 weeks post-butyrate treatment, and 6 weeks post-butyrate treatment. (A) Longitudinal changes of histamine signaling biochemical over the course of 6 weeks post-butyrate treatment. Histamine catabolites showed a significant decrease in 1-methylhistamine (q = 0.037) and a marginally significant decrease in 4-imidazoleacetate (q = 0.3103) at 3 weeks post-butyrate treatment (A). Box-plot diagrams displaying longitudinal changes of butyrate-treated animals in (B) 4-imidazoleacetate decreased following butyrate treatment for WT mice 6 weeks post-butyrate treatment vs. baseline: q = 0.0467. For G93A mice 3 weeks post-butyrate treatment vs. baseline: q = 0.0901, and 6 weeks post-butyrate treatment vs. baseline: q = 0.1215. For both WT and G93A mice: 1-methyl-5-imidazoleacetate decreased following butyrate treatment (WT: 3 weeks post-butyrate treatment vs. baseline, q = 0.0292; 6 weeks post-butyrate treatment vs. baseline: q = 0.0254. G93A: 3 weeks post-butyrate treatment vs. baseline, q = 0.0841; 6 weeks post-butyrate treatment vs. baseline: q = 0.0534). In (C) indole-3-carboxylate (WT: 3 weeks post-butyrate treatment vs. baseline, q = 0.0194; 6 weeks post-butyrate treatment vs. baseline, q = 0.011). (D) glutamate (G93A: 3 weeks post-butyrate treatment vs. baseline, q = 0.1612); glutamine (G93A: 3 weeks post-butyrate treatment vs. baseline, q = 0.1428; 6 weeks post-butyrate treatment vs. baseline, q = 0.1215). Due to changes in glutamine having a different time course, at 6 weeks post-butyrate treatment, WT and G93A mice reached different values of glutamine (p = 0.0183, q = 0.2617). Carboxyethyl-GABA: for WT, 3 weeks vs. baseline, q = 0.0149; for 6 weeks post-butyrate treatment vs. baseline, q = 0.1263. At baseline, there was a difference between WT and G93A mice (p = 0.0149, q = 0.2687). N-methyl-GABA: for WT (3 weeks post-butyrate treatment vs. baseline, q = 0.0018; 6 weeks post-butyrate treatment vs. baseline, q = 0.0124; 6 weeks post-butyrate treatment vs. 3 weeks post-butyrate treatment, q = 0.2512); for G93A (6 weeks post-butyrate treatment vs. baseline, q = 0.0018; 6 weeks post-butyrate treatment vs. baseline, q = 0.0124; 6 weeks post-butyrate treatment vs. 3 weeks post-butyrate treatment, q = 0.2512); 6 weeks post-butyrate treatment, there were different values between WT and SOD1G93A mice (p = 0.0081, q = 0.2436). The data are presented as the fold-change (FC) ratios of the average concentrations of WT and SOD1G93A mice. Differences are assessed by the Welch’s two-sample t-test. WT (N = 6) and SOD1G93A (N = 6) mice.
Figure 5
Figure 5
ALS altered energy-related metabolites over time and butyrate treatment altered over the course of disease. (A) Longitudinal changes of energy-related biochemicals in ALS mice over 17 weeks. The p-values for 4, 8, 13, and 17 weeks are labeled in the figures, and their according q-values are provided in the figure legends. Nicotinamide (week 13: q = 0.1298); Citraconate (week 13: q = 0.1372); tricarballylate (week 13: q = 0.1058); malate (week 13: q = 0.0797); fumarate (week 13: q = 0.0879); succinate (week 13: q = 0.1058); alpha-ketoglutarate (week 13: q = 0.1058); aconitate (week 13: q = 0.1058); citrate (week 13: q = 0.1058). (B) Longitudinal changes of energy-related biochemicals in butyrate-treated ALS mice over 6 weeks. The p-values for pre-treatment; 3 weeks post-butyrate treatment, and 6 weeks post-butyrate treatment are labeled in the figures, and their according q-values are provided in the figure legends. Nicotinamide (week 3 post-butyrate treatment: q = 0.2295); citrate (6 weeks post-butyrate treatment: q = 0.2729). Box plot diagrams displaying longitudinal changes of butyrate-treated animals in energy-related metabolites: (C) nicotinamide (WT: 6 weeks post-butyrate treatment vs. baseline, q = 0.0959; 6 weeks post-butyrate treatment vs. 3 weeks post-butyrate treatment, q = 0.2512), and (D) 1-methylnicotinamide (G93A: 3 weeks post-butyrate treatment vs. baseline, q = 0.1256). Differences are assessed by the Welch’s two-sample t-test. For untreated groups: WT (N = 5) and SOD1G93A (N = 5) mice. For treated groups: WT (N = 6) and SOD1G93A (N = 6).
Figure 6
Figure 6
The schematic shows the GGT pathway. Detailed changes of metabolites with or without butyrate treatment are shown in Table 3.
Figure 7
Figure 7
Fatty acid metabolites following butyrate administration in ALS. (A) Longitudinal changes of energy-related biochemicals in the WT and ALS mice over 17 weeks. The p-values for 4, 8, 13, and 17 weeks are labeled in the figures, and their corresponding q-values are provided in the figure legends. Caprylate (week 17: q = 0.9941). Box plot diagrams displaying longitudinal changes of butyrate-treated animals in (B) butyrate/isobutyrate; (C) valerate and isovalerate (at baseline: G93A vs. WT: p = 0.0111, q = 0.2687). (D) caproate (G93A: 6 weeks post-butyrate treatment vs. baseline, q = 0.1379; G93A vs. WT: 6 weeks post-butyrate treatment, p = 0.0145, q = 0.2617), and (E) caprylate (WT: 3 weeks post-butyrate treatment vs. baseline, q = 0.0520). Differences are assessed by the Welch’s two-sample t-test. For untreated groups: WT (N = 5) and SOD1G93A (N = 5) mice. For treated groups: WT (N = 6) and SOD1G93A (N = 6).
Figure 8
Figure 8
Butyrate treatment led to reduced lumbar spine IBA1 expression and reduced serum IL-17 and LPS expression in SOD1G93A mice. (A) Decreased IBA1 expression in lumbar spine of SOD1G93A mice with butyrate treatment compared with the WT group. Male or female SOD1G93A mice were treated with or without 2% butyrate in drinking water starting with mice aged 9 weeks to 15 weeks. At the age of 15 weeks, mice were sacrificed, and blood and tissues were collected. Images are from a single experiment and are representative of 6 mice per group. (Data are expressed as mean ± SD. N = 6, one-way ANOVA test). (B) IL-17 was significantly lower in the serum of SOD1G93A mice with butyrate treatment compared with the WT group. (Data are expressed as mean ± SD. N = 5, one-way ANOVA test). (C) LPS was significantly lower in the serum of SOD1G93A mice with butyrate treatment compared with the WT group. (Data are expressed as mean ± SD. N = 5, one-way ANOVA test). The p-values used in the figures are the adjusted p-values given by the Tukey method.

Similar articles

Cited by

References

    1. Turner M.R., Hardiman O., Benatar M., Brooks B.R., Chio A., de Carvalho M., Ince P.G., Lin C., Miller R.G., Mitsumoto H., et al. Controversies and priorities in amyotrophic lateral sclerosis. Lancet Neurol. 2013;12:310–322. doi: 10.1016/S1474-4422(13)70036-X. - DOI - PMC - PubMed
    1. Bensimon G., Lacomblez L., Meininger V., ALS/Riluzole Study Group A controlled trial of riluzole in amyotrophic lateral sclerosis. N. Engl. J. Med. 1994;330:585–591. doi: 10.1056/NEJM199403033300901. - DOI - PubMed
    1. Writing G., Edaravone A.L.S.S.G. Safety and efficacy of edaravone in well defined patients with amyotrophic lateral sclerosis: A randomised, double-blind, placebo-controlled trial. Lancet Neurol. 2017;16:505–512. doi: 10.1016/S1474-4422(17)30115-1. - DOI - PubMed
    1. Zhang Y.G., Wu S., Yi J., Xia Y., Jin D., Zhou J., Sun J. Target intestinal microbiota to alleviate disease progression in amyotrophic lateral sclerosis. Clin. Ther. 2017;39:322–336. doi: 10.1016/j.clinthera.2016.12.014. - DOI - PMC - PubMed
    1. Zhang Y.G., Ogbu D., Garrett S., Xia Y., Sun J. Aberrant enteric neuromuscular system and dysbiosis in amyotrophic lateral sclerosis. bioRxiv. 2021;13:452097. doi: 10.1080/19490976.2021.1996848. - DOI - PMC - PubMed

LinkOut - more resources