

Genes Associated with Biological Nitrogen Fixation Efficiency Identified Using RNA Sequencing in Red Clover (Trifolium pratense L.)
- PMID: 36556339
- PMCID: PMC9785344
- DOI: 10.3390/life12121975
Genes Associated with Biological Nitrogen Fixation Efficiency Identified Using RNA Sequencing in Red Clover (Trifolium pratense L.)
Abstract
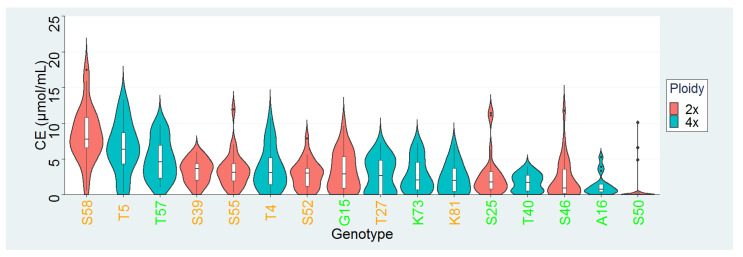
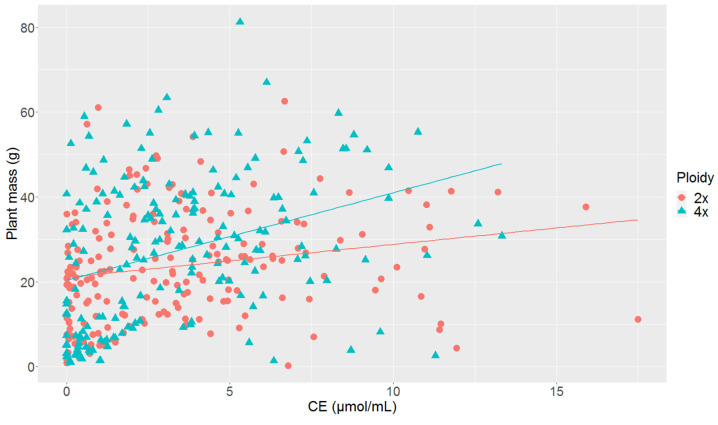
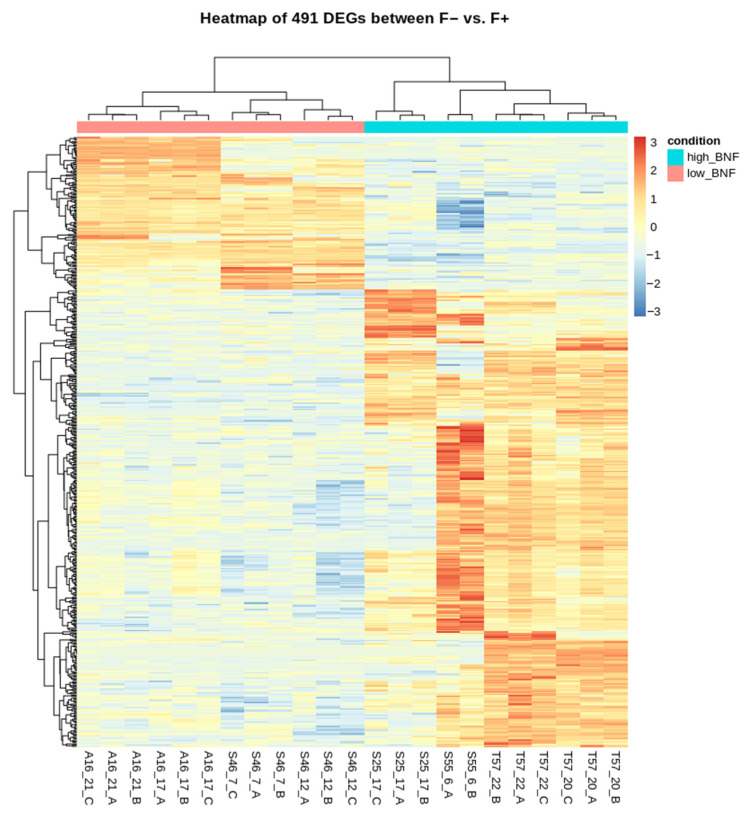
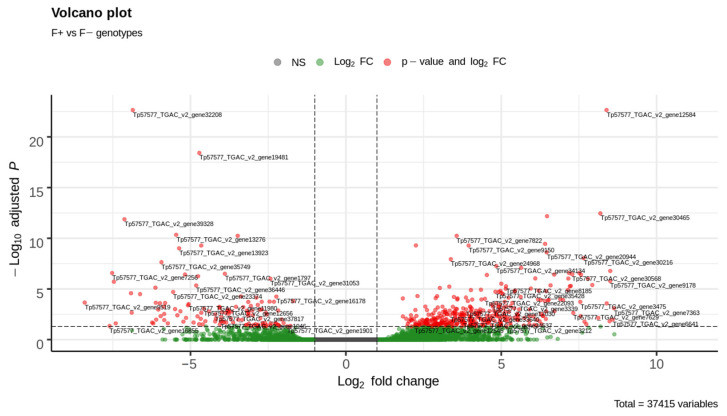
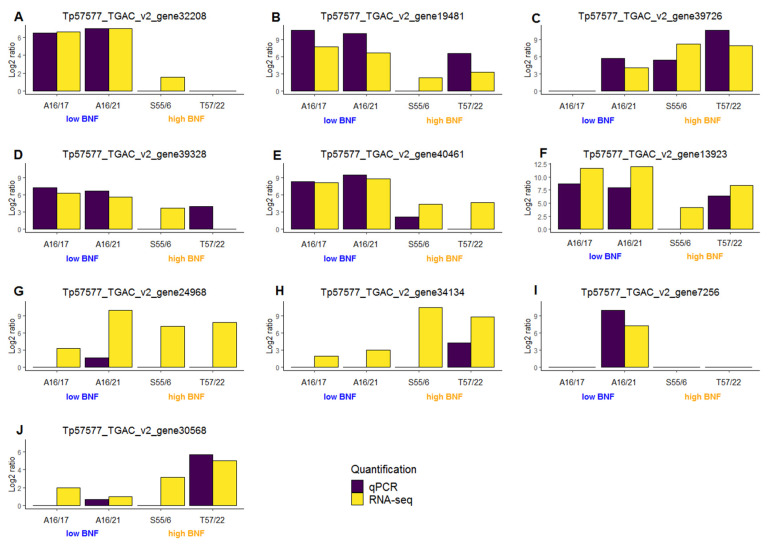
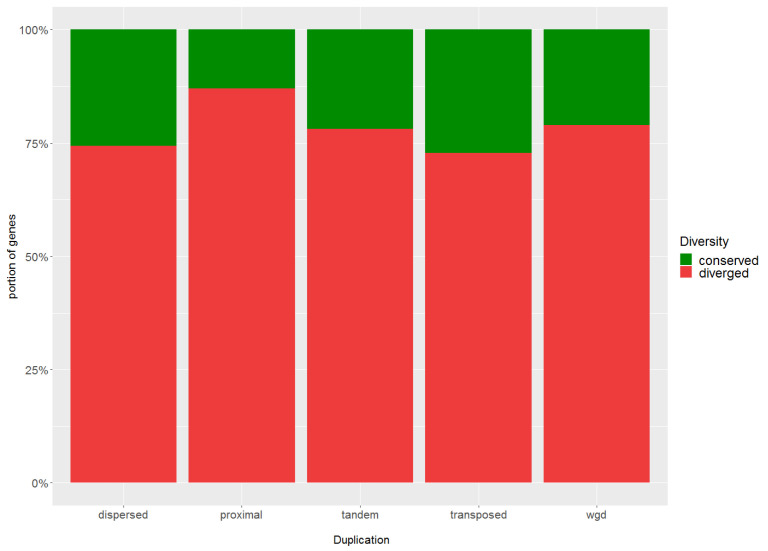
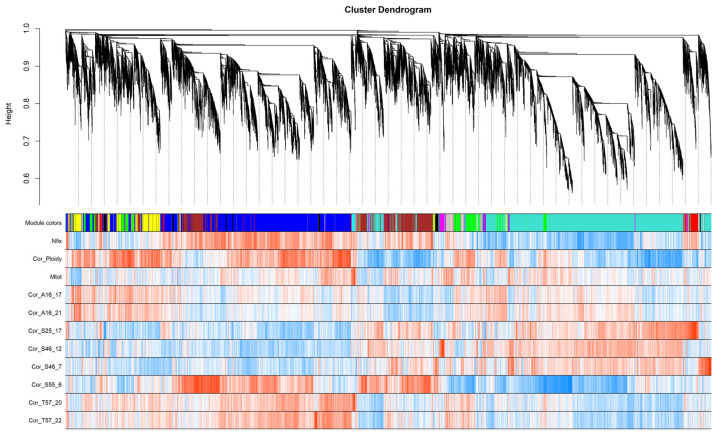
Commonly studied in the context of legume-rhizobia symbiosis, biological nitrogen fixation (BNF) is a key component of the nitrogen cycle in nature. Despite its potential in plant breeding and many years of research, information is still lacking as to the regulation of hundreds of genes connected with plant-bacteria interaction, nodulation, and nitrogen fixation. Here, we compared root nodule transcriptomes of red clover (Trifolium pratense L.) genotypes with contrasting nitrogen fixation efficiency, and we found 491 differentially expressed genes (DEGs) between plants with high and low BNF efficiency. The annotation of genes expressed in nodules revealed more than 800 genes not yet experimentally confirmed. Among genes mediating nodule development, four nod-ule-specific cysteine-rich (NCR) peptides were confirmed in the nodule transcriptome. Gene duplication analyses revealed that genes originating from tandem and dispersed duplication are significantly over-represented among DEGs. Weighted correlation network analysis (WGCNA) organized expression profiles of the transcripts into 16 modules linked to the analyzed traits, such as nitrogen fixation efficiency or sample-specific modules. Overall, the results obtained broaden our knowledge about transcriptomic landscapes of red clover's root nodules and shift the phenotypic description of BNF efficiency on the level of gene expression in situ.
Keywords: differentially expressed gene; gene duplication; nodule-specific cysteine-rich peptide; transcriptome.
Conflict of interest statement
O.T. is employed by the company Agricultural Research, Ltd., Troubsko, Czech Republic and he declares no conflict of interests. The remaining authors declare no competing interest.
Figures
Similar articles
-
Allelic Variants for Candidate Nitrogen Fixation Genes Revealed by Sequencing in Red Clover (Trifolium pratense L.).Int J Mol Sci. 2019 Nov 2;20(21):5470. doi: 10.3390/ijms20215470. Int J Mol Sci. 2019. PMID: 31684086 Free PMC article.
-
Expression and Variation of the Genes Involved in Rhizobium Nodulation in Red Clover.Plants (Basel). 2022 Oct 28;11(21):2888. doi: 10.3390/plants11212888. Plants (Basel). 2022. PMID: 36365339 Free PMC article.
-
Unveiling the Complexity of Red Clover (Trifolium pratense L.) Transcriptome and Transcriptional Regulation of Isoflavonoid Biosynthesis Using Integrated Long- and Short-Read RNAseq.Int J Mol Sci. 2021 Nov 23;22(23):12625. doi: 10.3390/ijms222312625. Int J Mol Sci. 2021. PMID: 34884432 Free PMC article.
-
Physiological impact of flavonoids on nodulation and ureide metabolism in legume plants.Plant Physiol Biochem. 2021 Sep;166:512-521. doi: 10.1016/j.plaphy.2021.06.007. Epub 2021 Jun 16. Plant Physiol Biochem. 2021. PMID: 34171572 Review.
-
Gene Expression in Nitrogen-Fixing Symbiotic Nodule Cells in Medicago truncatula and Other Nodulating Plants.Plant Cell. 2020 Jan;32(1):42-68. doi: 10.1105/tpc.19.00494. Epub 2019 Nov 11. Plant Cell. 2020. PMID: 31712407 Free PMC article. Review.
References
-
- Lewis G.P., Schrire B.D., Mackinder B.A., Rico L., Clark R. A 2013 Linear Sequence of Legume Genera Set in a Phylogenetic Context—A Tool for Collections Management and Taxon Sampling. South Afr. J. Bot. 2013;89:76–84. doi: 10.1016/j.sajb.2013.06.005. - DOI
-
- Azani N., Babineau M., Bailey C.D., Banks H., Barbosa A.R., Pinto R.B., Boatwright J.S., Borges L.M., Brown G.K., Bruneau A., et al. A New Subfamily Classification of the Leguminosae Based on a Taxonomically Comprehensive Phylogeny—The Legume Phylogeny Working Group (LPWG) Taxon. 2017;66:44–77. doi: 10.12705/661.3. - DOI
Grants and funding
LinkOut - more resources
Full Text Sources
