

Specific Post-Translational Modifications of VDAC3 in ALS-SOD1 Model Cells Identified by High-Resolution Mass Spectrometry
- PMID: 36555496
- PMCID: PMC9784795
- DOI: 10.3390/ijms232415853
Specific Post-Translational Modifications of VDAC3 in ALS-SOD1 Model Cells Identified by High-Resolution Mass Spectrometry
Abstract
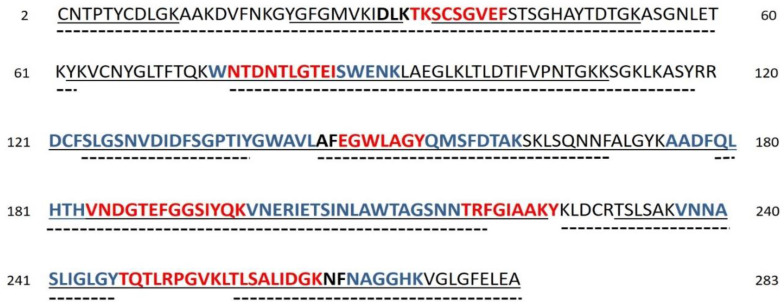
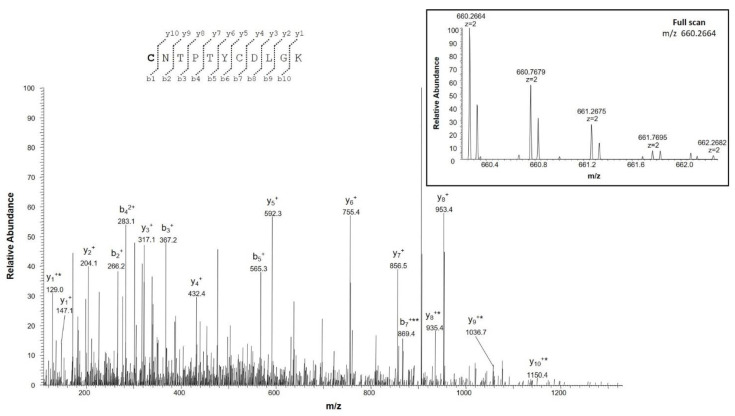
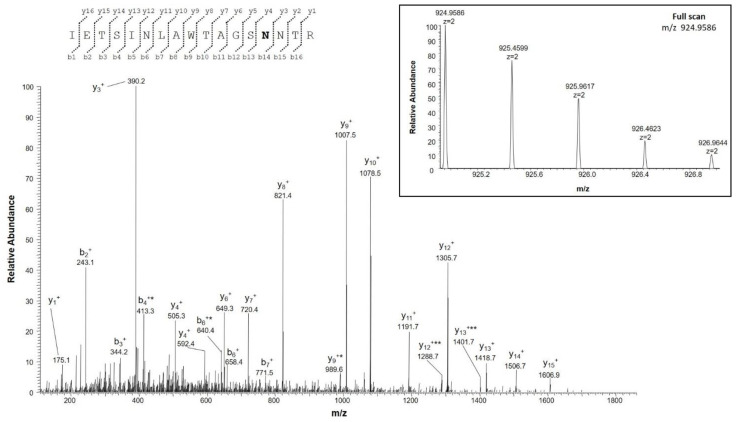
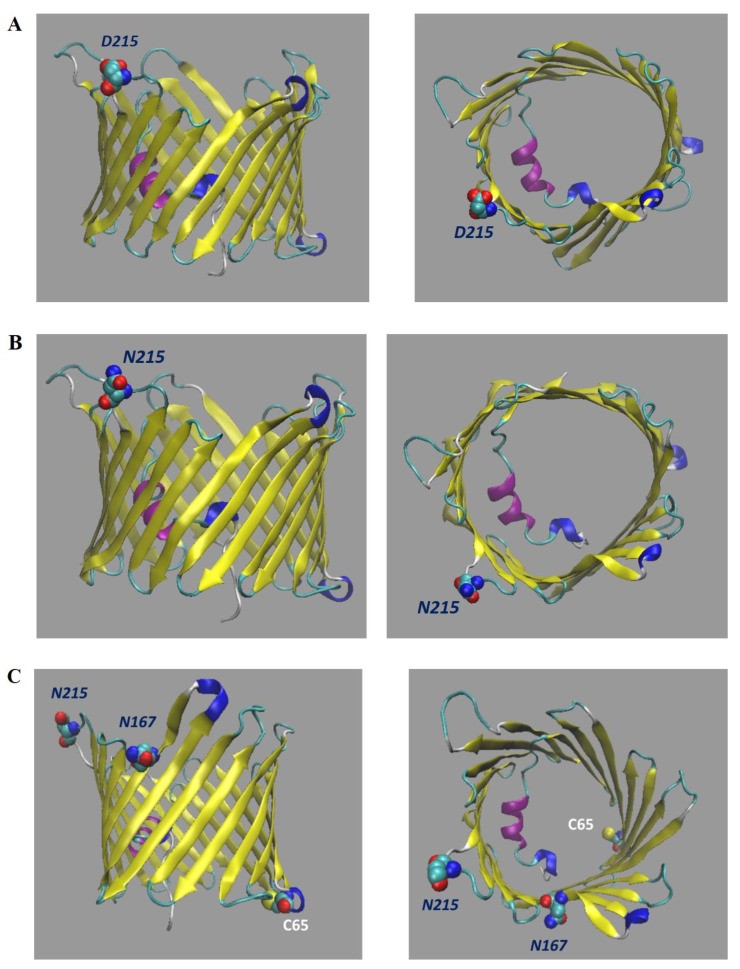
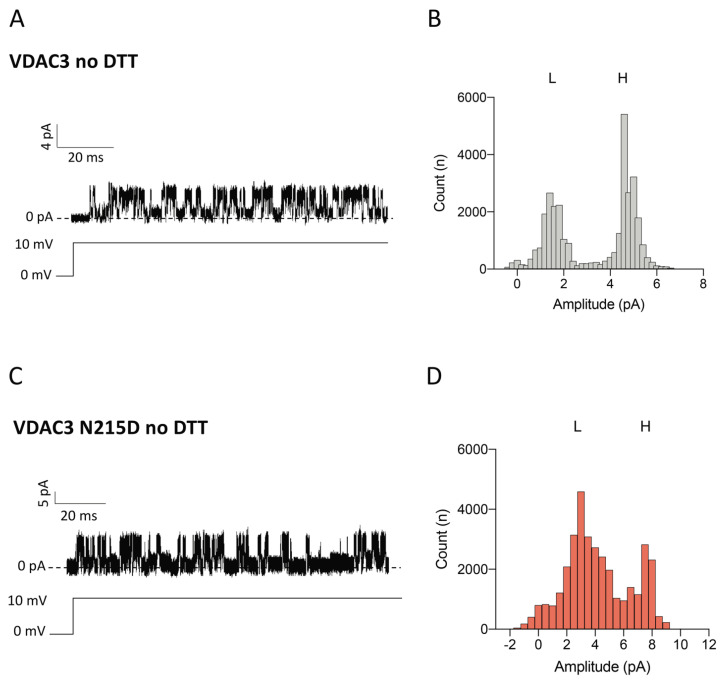
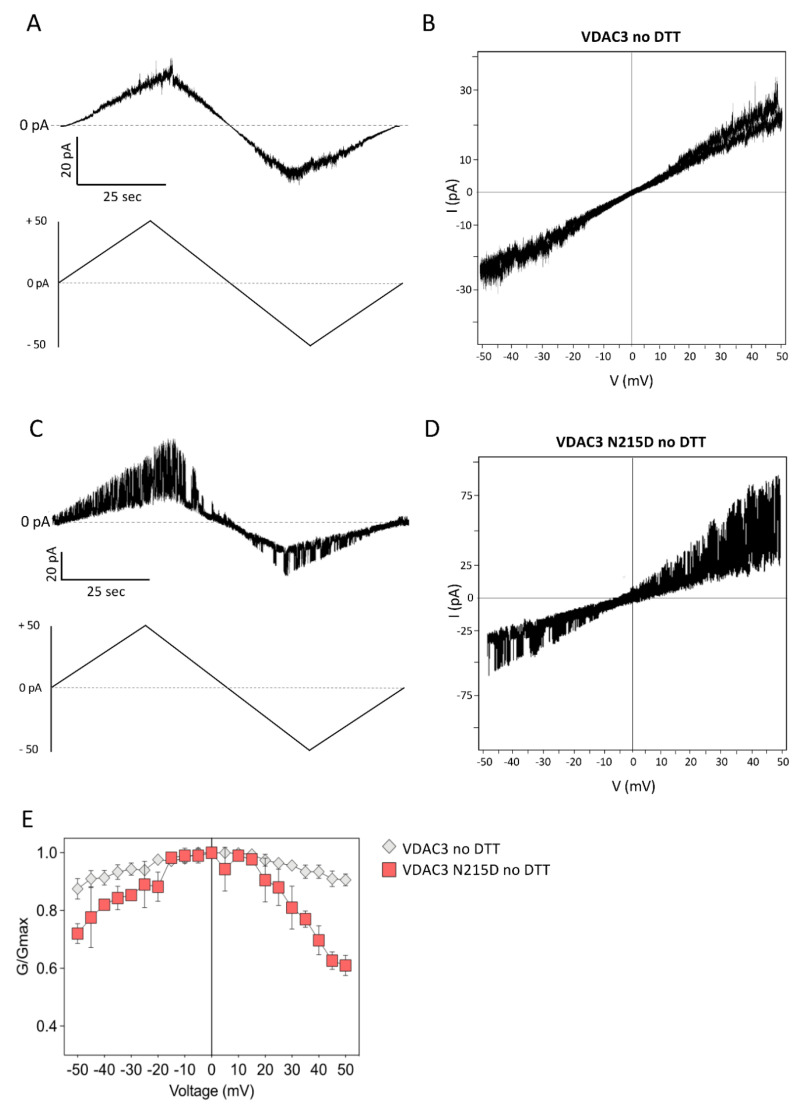
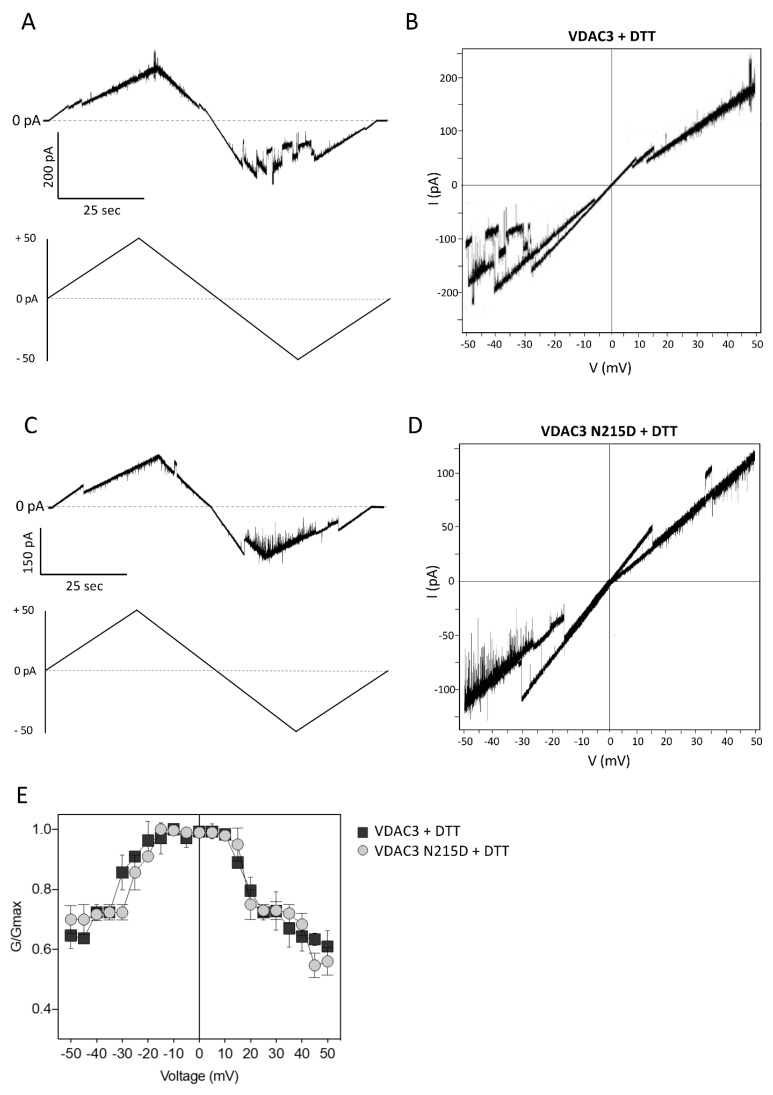
Damage induced by oxidative stress is a key driver of the selective motor neuron death in amyotrophic lateral sclerosis (ALS). Mitochondria are among the main producers of ROS, but they also suffer particularly from their harmful effects. Voltage-dependent anion-selective channels (VDACs) are the most represented proteins of the outer mitochondrial membrane where they form pores controlling the permeation of metabolites responsible for mitochondrial functions. For these reasons, VDACs contribute to mitochondrial quality control and the entire energy metabolism of the cell. In this work we assessed in an ALS cell model whether disease-related oxidative stress induces post-translational modifications (PTMs) in VDAC3, a member of the VDAC family of outer mitochondrial membrane channel proteins, known for its role in redox signaling. At this end, protein samples enriched in VDACs were prepared from mitochondria of an ALS model cell line, NSC34 expressing human SOD1G93A, and analyzed by nUHPLC/High-Resolution nESI-MS/MS. Specific over-oxidation, deamidation, succination events were found in VDAC3 from ALS-related NSC34-SOD1G93A but not in non-ALS cell lines. Additionally, we report evidence that some PTMs may affect VDAC3 functionality. In particular, deamidation of Asn215 alone alters single channel behavior in artificial membranes. Overall, our results suggest modifications of VDAC3 that can impact its protective role against ROS, which is particularly important in the ALS context. Data are available via ProteomeXchange with identifier PXD036728.
Keywords: SOD1; amyotrophic lateral sclerosis; deamidation; high-resolution mass spectrometry; mitochondria; neurodegeneration; over-oxidation; post-translational modifications; succination; voltage dependent anion channel.
Conflict of interest statement
The authors declare no conflict of interest.
Figures
Similar articles
-
Post-Translational Modification Analysis of VDAC1 in ALS-SOD1 Model Cells Reveals Specific Asparagine and Glutamine Deamidation.Antioxidants (Basel). 2020 Dec 2;9(12):1218. doi: 10.3390/antiox9121218. Antioxidants (Basel). 2020. PMID: 33276691 Free PMC article.
-
High resolution mass spectrometry characterization of the oxidation pattern of methionine and cysteine residues in rat liver mitochondria voltage-dependent anion selective channel 3 (VDAC3).Biochim Biophys Acta Biomembr. 2017 Mar;1859(3):301-311. doi: 10.1016/j.bbamem.2016.12.003. Epub 2016 Dec 16. Biochim Biophys Acta Biomembr. 2017. PMID: 27989743
-
A High Resolution Mass Spectrometry Study Reveals the Potential of Disulfide Formation in Human Mitochondrial Voltage-Dependent Anion Selective Channel Isoforms (hVDACs).Int J Mol Sci. 2020 Feb 21;21(4):1468. doi: 10.3390/ijms21041468. Int J Mol Sci. 2020. PMID: 32098132 Free PMC article.
-
VDACs Post-Translational Modifications Discovery by Mass Spectrometry: Impact on Their Hub Function.Int J Mol Sci. 2021 Nov 27;22(23):12833. doi: 10.3390/ijms222312833. Int J Mol Sci. 2021. PMID: 34884639 Free PMC article. Review.
-
SOD1 in neurotoxicity and its controversial roles in SOD1 mutation-negative ALS.Adv Biol Regul. 2016 Jan;60:95-104. doi: 10.1016/j.jbior.2015.10.006. Epub 2015 Oct 31. Adv Biol Regul. 2016. PMID: 26563614 Review.
Cited by
-
Orchestration of Mitochondrial Function and Remodeling by Post-Translational Modifications Provide Insight into Mechanisms of Viral Infection.Biomolecules. 2023 May 20;13(5):869. doi: 10.3390/biom13050869. Biomolecules. 2023. PMID: 37238738 Free PMC article. Review.
-
Expression and prognostic impact of VDAC3 in colorectal adenocarcinoma.Transl Cancer Res. 2024 Sep 30;13(9):4736-4751. doi: 10.21037/tcr-24-402. Epub 2024 Sep 27. Transl Cancer Res. 2024. PMID: 39430839 Free PMC article.
References
MeSH terms
Substances
Grants and funding
LinkOut - more resources
Full Text Sources
Medical
Molecular Biology Databases
Miscellaneous
