Review
. 2022 Dec 16;11(24):4086.
doi: 10.3390/cells11244086.

Visualizing the Genome: Experimental Approaches for Live-Cell Chromatin Imaging

Affiliations
Review

Visualizing the Genome: Experimental Approaches for Live-Cell Chromatin Imaging

Vladimir S Viushkov et al. Cells. .

Abstract

Over the years, our vision of the genome has changed from a linear molecule to that of a complex 3D structure that follows specific patterns and possesses a hierarchical organization. Currently, genomics is becoming "four-dimensional": our attention is increasingly focused on the study of chromatin dynamics over time, in the fourth dimension. Recent methods for visualizing the movements of chromatin loci in living cells by targeting fluorescent proteins can be divided into two groups. The first group requires the insertion of a special sequence into the locus of interest, to which proteins that recognize the sequence are recruited (e.g., FROS and ParB-INT methods). In the methods of the second approach, "programmed" proteins are targeted to the locus of interest (i.e., systems based on CRISPR/Cas, TALE, and zinc finger proteins). In the present review, we discuss these approaches, examine their strengths and weaknesses, and identify the key scientific problems that can be studied using these methods.

Keywords: 3D genome; CRISPR imaging; FROS; ParB-INT; TALE imaging; chromatin dynamics; chromatin visualization; live-cell imaging; zinc finger imaging.


Conflict of interest statement

The authors declare no conflict of interest.

Figures

Figure 1
Figure 1
Functional mobility of chromatin loci. Green and red ellipses show arbitrary genomic loci marked only to illustrate the movements of these loci. (A) Changes in chromatin structure associated with transcription and replication; (B) Relocation of a gene from the nuclear periphery to the nuclear interior associated with transcriptional activation; (C) Movement of a gene to the nuclear pore complex (NPC) associated with transcriptional activation; (D) Movement of a gene to the Cajal body associated with transcriptional activation; (E) Movement of a gene to nuclear speckles associated with transcriptional activation; (F) Loop extrusion by cohesin complex. CTCF sites represent stop signals of extrusion; (G) Damage-induced chromatin dynamics; (H) Interaction of an enhancer and a promoter associated with transcriptional activation; (I) Mobility of viral DNA.
Figure 2
Figure 2
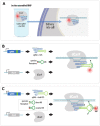
Fluorescent repressor-operator systems (FROS). Arrays of operator sequences (LacO or TetO) of variable size are integrated into the desired genomic loci. Visualization is achieved by the corresponding repressor proteins (LacR or TetR) fused to fluorescent proteins (FP) that are expressed in cells. The use of different types of FROS enables multicolor imaging of several different loci.
Figure 3
Figure 3
ParB-INT system. A small array of ParS sequences (INT array) is integrated into the desired genomic locus. The array is visualized by binding of ParB proteins fused to fluorescent proteins (FP) to ParS sequences, oligomerization, and spreading of ParB-FP on nearby sequences. The use of different types of ParB-INT systems enables multicolor imaging of different loci.
Figure 4
Figure 4
Zinc finger (ZF) imaging. (A) To visualize a repetitive endogenous sequence, an array of ZF modules fused to a fluorescent protein (FP) is expressed in a cell and targets this sequence. Each ZF motif recognizes three nucleotides; (B) Signal amplification by peptide tags. To amplify a signal, ZF modules can be fused to a cluster of peptide tags (e.g., HA-tags or FLAG-tags). These tags are recognized by a single-chain variable fragment (ScFv) fused to a fluorescent protein, which should be also expressed in cells.
Figure 5
Figure 5
TALE imaging. (A) Basic concept. A fused protein consisting of TALE modules and a fluorescent protein (FP) is expressed in a cell and used to recognize and visualize endogenous genomic loci. (B) An approach to increase the signal-to-noise ratio by bimolecular fluorescence complementation strategy. In this case, two parts of a split fluorescent protein (N-FP and C-FP) are joined to two TALE modules that recognize nearby sequences. A functional fluorescent protein is formed only when two TALE modules interact with their target sequences, enabling two parts of an FP to dimerize.
Figure 6
Figure 6
TALE imaging with quantum dots (QDs). (A) A first array of TALE modules fused to a LAP-tag (LplA acceptor peptide) and a LplA (lipoic acid ligase) are expressed in cells. LplA adds a trans-cyclooctene (TCO2) bridge to an LAP-tag. Tetrazine Tz1 conjugated QDs of the first color (QD1) are delivered to cells and Tz1 reacts with TCO2 via Diels-Alder cycloaddition. (B) A second array of TALE modules fused to an AP-tag and a BirA (biotin ligase) can also be expressed in cells. BirA adds biotin to an AP-tag, which interacts with streptavidin-conjugated QD of the second color (QD2) delivered to cells. The two arrays of TALE modules labeled with two types of QDs recognize closely located sequences.
Figure 7
Figure 7
A schematic of a dCas9-sgRNA complex. dCas9, as well as Cas9, binds a sgRNA that directs this protein to a DNA sequence complementary to a guide part of sgRNA (orange). To be successfully bound by dCas9, the target DNA must contain a PAM sequence next to a sequence recognized by sgRNA. The scaffold part of a sgRNA consists of several stem loops that interact with dCas9.
Figure 8
Figure 8
Multicolor imaging by orthologous dCas9-FP. In a basic version of CRISPR imaging, dCas9 fused to a fluorescent protein (FP) is directed to a repeated sequence by an sgRNA. The use of orthologous dCas9 proteins, for example from Streptococcus pyogenes (Sp) and Staphylococcus aureus (Sa), fused to different fluorescent proteins enables simultaneous visualization of two loci in a single cell. Note that orthologous dCas9 proteins require different PAM sequences.
Figure 9
Figure 9
CRISPR imaging with aptamer-binding proteins. In this modification of CRISPR imaging, visualization is achieved by proteins that bind aptamers (stem loops) added to sgRNA. For this purpose, MCP, PCP or λN22 phage proteins can be used that recognize MS2, PP7 or boxB-stem loops, respectively. These proteins are fused to a fluorescent protein (FP) and are expressed in the cell, together with dCas9 and sgRNA with aptamers.
Figure 10
Figure 10
Casilio system. sgRNA is decorated by several copies of a PBS-tag consisting of eight nucleotides. PBS is bound by the PUF protein domain that contains eight motifs, with each motif recognizing one nucleotide in PBS. PUF protein fused to a fluorescent protein (FP), dCas9 and PBS-containing sgRNA are expressed in the cell. By using different PBS/PUF pairs it is possible to visualize multiple different sequences within a single cell (although different fluorescent proteins are needed).
Figure 11
Figure 11
CRISPR imaging with Broccoli aptamers. dCas9 and sgRNA with Broccoli aptamers are expressed in cells. Visualization is achieved by a small molecule (DFHBI-1T) that binds Broccoli aptamers and fluoresces.
Figure 12
Figure 12
Two-color visualization by dCas9 conjugated to organic fluorophores. Recombinant dCas9 molecules fused to SNAP or CLIP tags are conjugated to organic fluorophores and form complexes with in vitro transcribed sgRNAs. These complexes are subsequently delivered into cells for visualization of target loci.
Figure 13
Figure 13
CRISPR imaging with organic fluorophores conjugated to sgRNA or to sgRNA complementary oligonucleotides. (A) A complex of recombinant dCas9, fluorophore-labeled gRNA, and tracrRNA is pre-assembled in vitro and delivered into cells; (B) MB/MTS strategy where dCas9 and sgRNA-containing MTS are expressed in cells. Molecular beacon probe containing a fluorophore and a quencher is transfected into cells. Upon binding of MB to MTS in sgRNA, the fluorophore separates from the quencher and fluoresces; (C) Dual FRET MB strategy. As in B, but two MBs are transfected into cells: donor MB and acceptor MB, each containing a fluorophore and a quencher. Upon binding of these MBs to MTS in sgRNA, fluorophores separate from the quenchers and become juxtaposed, enabling FRET signal emission.
Figure 14
Figure 14
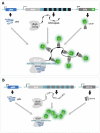
Approaches for increasing the brightness of CRISPR imaging. (A) SunTag technology. An array of GCN4 peptide tags is added to dCas9 expressed in cells. GCN4 repeats are recognized by ScFv fused to a fluorescent protein (FP); (B) Bimolecular fluorescence complementation strategy (Split-FP) in which an array of fluorescent protein fragments (e.g., GFP11) is added to dCas9 expressed in cells. A complementary part of the same fluorescent protein (e.g., GFP1–10) is expressed in cells and forms a whole fluorescent protein on dCas9. Both strategies enable the targeting of multiple copies of a fluorescent protein to dCas9 without a significant increase in the fused protein size.
Figure 15
Figure 15
Increasing brightness and suppressing background fluorescence in CRISPR imaging by a combination of Split-FP and SunTag systems. Up to five genes should be expressed in a cell: dCas9 with GCN4 repeats (SunTag), sgRNA with MS2 stem loops, ScFv fused to a part of a FP (GFP10), MCP fused to a second part of a FP (GFP11) and the remaining part of a FP (GFP1–9). Assembly on a target locus results in the formation of a functional fluorescent protein complex.
Figure 16
Figure 16
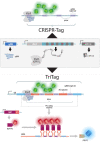
CRISPR-Tag. To visualize a locus without endogenous repeats, an artificial array (tag) of sites for high-affinity guide RNAs is integrated into the locus. This tag is visualized by a dCas9-Split-GFP strategy to increase brightness and suppress background fluorescence (upper part of the figure). An upgraded version of the CRISPR-Tag allows visualizing both a target gene and also imaging its RNA and protein product (lower part of the figure). In this case, the tag is a fluorescent protein coding sequence (FP2) added to a gene of interest (GOI). This sequence contains an intron consisting of alternating MS2-aptamers and sgRNA binding sites. The gene is visualized by dCas9-Split-GFP, its RNA by MCP fused to another FP, and the protein of interest (POI) appears to be fused to FP2.

Similar articles

Cited by

References

    1. Hu Y., Kireev I., Plutz M., Ashourian N., Belmont A.S. Large-scale chromatin structure of inducible genes: Transcription on a condensed, linear template. J. Cell Biol. 2009;185:87–100. doi: 10.1083/jcb.200809196. - DOI - PMC - PubMed
    1. Deng X., Zhironkina O.A., Cherepanynets V.D., Strelkova O.S., Kireev I.I., Belmont A.S. Cytology of DNA Replication Reveals Dynamic Plasticity of Large-Scale Chromatin Fibers. Curr. Biol. 2016;26:2527–2534. doi: 10.1016/j.cub.2016.07.020. - DOI - PMC - PubMed
    1. Chuang C.H., Carpenter A.E., Fuchsova B., Johnson T., de Lanerolle P., Belmont A.S. Long-range directional movement of an interphase chromosome site. Curr. Biol. 2006;16:825–831. doi: 10.1016/j.cub.2006.03.059. - DOI - PubMed
    1. Cabal G.G., Genovesio A., Rodriguez-Navarro S., Zimmer C., Gadal O., Lesne A., Buc H., Feuerbach-Fournier F., Olivo-Marin J.C., Hurt E.C., et al. SAGA interacting factors confine sub-diffusion of transcribed genes to the nuclear envelope. Nature. 2006;441:770–773. doi: 10.1038/nature04752. - DOI - PubMed
    1. Taddei A., Van Houwe G., Hediger F., Kalck V., Cubizolles F., Schober H., Gasser S.M. Nuclear pore association confers optimal expression levels for an inducible yeast gene. Nature. 2006;441:774–778. doi: 10.1038/nature04845. - DOI - PubMed

Publication types

Grants and funding

This research was funded by the Russian Science Foundation, grant number 22-24-00251.

LinkOut - more resources