. 2023 Jan;613(7943):365-374.
doi: 10.1038/s41586-022-05544-w. Epub 2022 Dec 21.

Inheritance of paternal DNA damage by histone-mediated repair restriction

Affiliations

Inheritance of paternal DNA damage by histone-mediated repair restriction

Siyao Wang et al. Nature. 2023 Jan.

Abstract

How paternal exposure to ionizing radiation affects genetic inheritance and disease risk in the offspring has been a long-standing question in radiation biology. In humans, nearly 80% of transmitted mutations arise in the paternal germline1, but the transgenerational effects of ionizing radiation exposure has remained controversial and the mechanisms are unknown. Here we show that in sex-separated Caenorhabditis elegans strains, paternal, but not maternal, exposure to ionizing radiation leads to transgenerational embryonic lethality. The offspring of irradiated males displayed various genome instability phenotypes, including DNA fragmentation, chromosomal rearrangement and aneuploidy. Paternal DNA double strand breaks were repaired by maternally provided error-prone polymerase theta-mediated end joining. Mechanistically, we show that depletion of an orthologue of human histone H1.0, HIS-24, or the heterochromatin protein HPL-1, could significantly reverse the transgenerational embryonic lethality. Removal of HIS-24 or HPL-1 reduced histone 3 lysine 9 dimethylation and enabled error-free homologous recombination repair in the germline of the F1 generation from ionizing radiation-treated P0 males, consequently improving the viability of the F2 generation. This work establishes the mechanistic underpinnings of the heritable consequences of paternal radiation exposure on the health of offspring, which may lead to congenital disorders and cancer in humans.


Conflict of interest statement

B.S. is a co-founder of Agevio Therapeutics.

Figures

Fig. 1
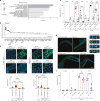
Fig. 1. Paternal exposure to ionizing radiation leads to transgenerational embryonic lethality.
a, Pedigrees of the maternal and paternal exposure to different doses of ionizing radiation and transgenerational characterization. Left, maternal exposure to ionizing radiation (P0 ∆f) leads to intergenerational embryonic lethality in the F1 generation. Except for the group treated with 90 Gy, which has no surviving progeny developing to adulthood, the surviving fog-2 F1 (∆ff and ∆fm) crossed with non-irradiated opposite sexes recovered the embryonic lethality to basal level. n indicates the number of biological replicates; each replicate includes three fog-2 females and three fog-2 males. Right, paternal ionizing radiation exposure (P0 ∆m) leads to a mild increase in embryonic lethality in the F1 generation, and the progeny of the surviving F1 (∆mf and ∆mm) show a transgenerational embryonic lethality in the F2 generation. n indicates the number of biological replicates. Data are median ± 95% confidence interval; P values are shown. Throughout the figures, red bars indicate females and blue bars indicate males. NA, not applicable. b, Pedigrees of paternal ionizing radiation exposure (90 Gy) and the transgenerational lethality characterization for three consequent generations. n = 3 biological replicates, each replicate includes 3 females with 3 males. Data are median ± 95% confidence interval; P values are shown. c, Freshly irradiated P0 adult males and males two days after ionizing radiation exposure show different transgenerational effects. fog-2: n = 3 biological replicates; spe-8: n = 5 biological replicates; each replicate includes 3 females and 3 males. Data are median ± 95% confidence interval; P values are shown. Generalized linear model (GLM) with logit link function and Tukey’s multiple comparisons were used for proportional data, and one-way (a,b) or two-way (c) ANOVA with arcsine transformation was also used to confirm the statistical results (Supplementary Table 1).
Fig. 2
Fig. 2. Paternal exposure to ionizing radiation leads to DNA fragmentation, chromosomal rearrangement and aneuploidy in the F1 generation.
a, Left, male germline DAPI staining. Right, magnified mature sperm. Scale bar, 20 μm. b, Embryonic DAPI staining. Bottom, chromosomal lagging and bridging. Scale bar, 10 μm. c, Intestinal DAPI staining. Bottom, magnified view of two representative cells. Scale bar, 10 μm. d, Telomere fluorescence in situ hybridization (FISH) and DAPI staining in the germline. Bottom, magnified view of fragmented DNA. Right, late diakinesis oocytes. Arrowheads indicate DNA fragmentation. Scale bars, 10 μm. Experiments in ac were repeated three times with similar observations; experiment in d was repeated two times with similar observations. e, Quantification of DAPI-stained bodies in late diakinesis oocytes. Data are mean ± s.d., n = 25 oocytes. f, Quantification of DNA fragmentation (without telomere FISH signal) per late diakinesis oocyte. n represents the number of oocytes. g, Representative circos plots showing chromosomal translocations (inter- or intra-chromosomal fusions) in ∆mf and ∆mm. All translocations are listed in Supplementary Table 3. h, RNAPll p-Ser2, HIM-8 and DAPI staining in dissected germline. Right, three representative nuclei. Scale bar, 20 μm. This experiment was repeated three times with similar observations. IR indicates exposure to ionizing radiation. Drawings illustrate the (a) sperm, (b) F1 embryos, (c) F1 somatic tissues and (d, h) F1 germlines of irradiated males that are investigated in the respective panels.
Fig. 3
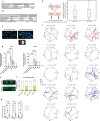
Fig. 3. Paternally inherited DNA damage is mainly repaired by TMEJ.
a, The distribution of translocation footprints in fog-2 F1 adults with paternal exposure to 90 Gy ionizing radiation. Templated inserts are insertions of ≥3 bp in between the fusion sites that have a matching sequence within ±25 bp around one of the 2 break points. Miscellaneous insertions are insertions <3 bp or insertions with no matching sequence within ±25 bp around the breakpoints. n, number of translocations. b, Left, schematic illustration of the type 1 translocations. The sense strand is in blue, and the antisense strand is in red. Numbers indicate the distance of the nucleotide to the breakpoint; yellow boxes indicate positions that show microhomology. Right, heat map representing the sum of all type 1 translocation maps derived from ∆mf and ∆mm (n = 23 translocations), excluding translocations with a templated insertion. Darker shades indicate higher sequence similarity between the corresponding bases. Numbers along the x- and y-axes correspond to those on the left. P values are provided in Supplementary Table 1. c, Progeny lethality of indicated strains. n represents the number of biological replicates. Data are median ± 95% confidence interval. P values are shown. d, Progeny lethality of different parental combinations for polq-1 worms with and without exposure to 90 Gy ionizing radiation. n = 3 biological replicates. Data are median ± 95% confidence interval. P values are shown. GLM with logit link function and Tukey multiple comparisons were used for proportional data, and one-way (c) or two-way (d) ANOVA with arcsine transformation was used to confirm the statistical results. Full statistical analyses are provided in Supplementary Table 1.
Fig. 4
Fig. 4. Removal of histone H1 or HPL-1 alleviates lethality inherited from sperm.
a, Gene Ontology term analysis for biological processes among significantly regulated proteins from a SILAC assay for wild-type worms with or without parental exposure to ionizing radiation. The top four enriched processes are highlighted in grey. FDR, false discovery rate. Values of log10FDR larger than 1.3 correspond to FDR < 0.05. b, Relative expression of proteins involved in chromosome- or DNA-binding processes upon parental exposure to ionizing radiation. The floating bar shows the range of values, and the centre line represents the median. n = 4 biological replicates. c, Progeny lethality characterization of the his-24; fog-2 mutant with or without paternal ionizing radiation irradiation. n indicates the number of biological replicates. Data are median ± 95% confidence interval. P values are shown. d, Left, H3K9me2 (green) and DAPI (blue) staining in the germline of indicated strains. Scale bars, 20 μm. Right, three representative nuclei co-stained with the X chromosome marker HIM-8 (red). Scale bar, 3 μm. e, H3K9me2 (green) and DAPI (blue) staining in the germline of indicated RNAi strains with or without paternal ionizing radiation exposure. Scale bar, 10 μm. Bottom, quantification of H3K9me2 signal intensity. n indicates cell numbers. Data are median ± 95% confidence interval. P values are shown; one-way ANOVA with Bonferroni’s multiple comparisons test. Experiments in d,e were repeated three times with similar observations. EV, empty vector. f, Progeny lethality of fog-2 and hpl-1; fog-2 with or without paternal ionizing radiation irradiation. n indicates the number of biological replicates. Data are median ± 95% confidence interval. P values are shown; GLM with logit link function was used for proportional data (c,f), and two-tailed t-test with arcsine transformation was used to confirm the statistical results. Full statistical analysis is shown in Supplementary Table 1.
Fig. 5
Fig. 5. Depletion of histone H1 or HPL-1 triggers HRR to alleviate transgenerational lethality.
a, RAD-51 immunofluorescence (red) and DAPI staining (blue) in the germlines of EV (RNAi); fog-2, his-24 (RNAi); fog-2 and hpl-1 (RNAi); fog-2 worms with or without paternal exposure to 90 Gy ionizing radiation. Top, pachytene zone of the female germlines. Bottom, transition zone of male germlines. Scale bar, 10 μm. Experiment in a was repeated three times with similar observations. b, Quantification of RAD-51 foci per nucleus in the germline of females and males, with or without paternal exposure to 90 Gy ionizing radiation. More than 15 nuclei were counted for each germline; n represents the number of germlines. Each dot shows the mean of the number of RAD-51 foci per nucleus in one germline. Bars show median ± 95% confidence interval. P values are shown; nested one-way ANOVA with Bonferroni’s multiple comparisons test, reflecting the variation between different germlines. c, Progeny lethality characterization of empty vector, his-24 and hpl-1 RNAi on fog-2 and brc-1; fog-2 mutants with or without paternal ionizing radiation irradiation (90 Gy). Control, ∆m: n = 3; ∆mf, ∆mm: n = 5 biological replicates. Data are median ± 95%confidence interval. P values are shown; GLM with logit link function and Tukey multiple comparisons; one-way ANOVA with arcsine transformation was used for the proportional data to confirm the statistical results and are included in the full statistical results (Supplementary Table 1).
Fig. 6
Fig. 6. Schematic model for the transgenerational effect of the paternal exposure to ionizing radiation.
Ionizing radiation (IR) exposure of male C. elegans leads to DNA DSBs in the mature sperm, which carries the fragmented DNA into the fertilized (un-irradiated) oocyte. The maternal oocyte provides the TMEJ machinery to repair the paternal DNA damage, resulting in various chromosomal aberrations. In the germline of the F1 offspring, linker histone H1-mediated heterochromatin structures accumulate in the chromatin of the germ cells, which prevents the DNA DSBs from being detected and repaired by the error-free HRR. Specifically in the female F1 (∆mf), X chromosome translocations and fragmentations prevent MSCI, thus further aggravating the embryonic lethality in the progeny. Together, paternal exposure to ionizing radiation leads to transgenerational embryonic lethality via heterochromatization-restricted DNA repair access.
Extended Data Fig. 1
Extended Data Fig. 1. IR exposure of hermaphrodite WT in the late L4 stage leads to extended transgenerational embryonic lethality.
a. Transgenerational lethality characterization for IR treated WT hermaphrodites at the L3 (start of spermatogenesis), young L4 (ongoing spermatogenesis) and late L4 stage (mature sperm is stored in the spermatheca). Ten worms were included for each biological replicate, and n = 3 biological replicates. Error bars indicate median with 95% CI. b. Progeny lethality characterization for multiple generations upon IR treatment at the late L4 stage of hermaphrodites P0. Ten worms for each dosage group were included for each biological replicate, and n = 3 biological replicates. Error bars indicate median with 95% CI.
Extended Data Fig. 2
Extended Data Fig. 2. Paternal exposure to IR leads to genome instability in the F1 generation.
a. Quantification of “comet” like sperm (p-values and n number indicating sperm are shown, Chi-square test was performed). b. Quantification of the chromosomal aberrations in the F1 of paternal and maternal exposure to IR (p-values and n number indicating embryos are shown, Fisher’s exact test was performed). c. Representative fluorescence microscopic images of DAPI (blue) in the fog-2 embryos derived from the control or irradiated females. Zoomed image of chromosomal fragmentation is shown below, fragmented DNA is indicated with arrowheads. Scale bar = 10 μm. d. Quantification of the intestinal chromosomal bridges in the F1 progenies of irradiated males and females (n fog-2 = 9, n spe-8 = 10 intestines, medians with 95% CI are shown, p-values are shown, two-factor GLM with logit link function and Tukey multiple comparisons were used). Two-way ANOVA with arcsine transformation was also used for the proportion data to confirm the statistical results and included in the full statistic results shown in Supplementary Table 1. e. Representative fluorescence microscopic images of hermaphrodite WTs’ intestinal cells expressing H2B::GFP with or without parental IR irradiation (90 Gy). Chromosomal bridging was observed in the F1’s intestinal cells. Scale bar = 10 μm. c and e were repeated three times with similar results. f. Developmental stages were determined 48h post L1 stage of control group of fog-2 and spe-8 and the F1 generation of fog-2 and spe-8 with paternal IR exposure, and n = 30 individuals were analyzed per experiment (n = 3 independent experiments per strain, p-values are shown, two-tailed t-test was performed). Full statistic results are shown in Supplementary Table 1. g. Quantification of apoptotic corpses per germline of unirradiated control, 90Gy treated ∆f and ∆mf of WT, fog-2 and spe-8 mutants (n = 9 germline, Medians with 95% CI are shown, p-values are shown, Two-way ANOVA with Bonferroni’s multiple comparisons test were used). Full statistic results are shown in Supplementary Table 1. h. Number of new chromosomal translocations in ∆mf (n = 6 worms) and ∆mm (n = 8 worms). The box depicts the Median with the top and bottom quartiles, the whiskers extend to 1.5 IQR. New translocations and mapped reads per sample are shown in Supplementary Table 2. i. and j. Circos plots showing the novel chromosomal translocations in six fog-2 ∆mf (i) and eight fog-2 ∆mm (j). The list of all translocations is shown in Supplementary Table 3.
Extended Data Fig. 3
Extended Data Fig. 3. Gene set enrichment analysis on Chromosome I to Chromosome V of SILAC proteomic data from hermaphrodites WT (F1) with parental IR exposure.
Gene set enrichment analysis (GSEA) of SILAC proteomic data from hermaphrodites WT (F1) with parental IR exposure (90 Gy) for chromosomes I to V. The top of each panel shows the log2 fold changes of the proteomics data in a ranked order. The bottom panels show the running enrichment score as a green line. The dashed red line depicts the positions furthest from 0. None of the chromosomes, except the X chromosome, is significantly different from a random distribution. The full statistics for each chromosome is provided in the Supplementary Table 4.
Extended Data Fig. 4
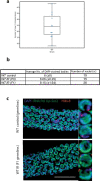
Extended Data Fig. 4. IR exposure in the late L4 stage of hermaphrodite WT leads to chromosomal rearrangement.
a. Whole-genome sequencing analysis shows the number of new chromosomal translocations in the hermaphrodites WT adults (F1) with parental IR exposure (90 Gy), normalized to untreated control. n = 11 worms, the box depicts the Median with the top and bottom quartiles, while the whiskers extend to 1.5 IQR. The number of new translocations and of mapped reads per sample is shown in Supplementary Table 2. b. Characterization of the DAPI-stained bodies in the late diakinesis oocytes of hermaphrodites WT adults (F1) with or without parental IR exposure (90 Gy). c. Merged images of immunofluorescence co-staining RNA Pol ll p-Ser2 (green), HIM-8 (red) and DAPI (blue) of dissected germlines from hermaphrodite WT adult (F1) with or without parental IR exposure (90 Gy). Three representative nuclei are shown on the right side. Scale bar = 20 μm. This experiment was repeated three times with similar results.
Extended Data Fig. 5
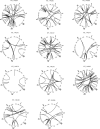
Extended Data Fig. 5. Circos plots showing the chromosomal translocations in ten hermaphrodites WT (F1) with parental IR (90 Gy) exposure.
The list of all translocations is shown in Supplementary Table 3.
Extended Data Fig. 6
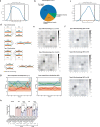
Extended Data Fig. 6. Hermaphrodite WT animals use TMEJ to repair the inherited DNA damage.
a. Density plot showing the distribution of the template positions of the insertions found in between the translocation sites of fog-2 adults (F1) with paternal exposure to IR (90 Gy). Only insertions are included that are at least 3 bp and whose templates were found within ±25 bp around one of the breakpoints (corresponding to the templated insertions in Fig. 3A). The orange ticks on the x-axis show the positions where the templates were found. The blue curve depicts the kernel density estimation as a non-parametric way to estimate the probability density function of the found positions. The black lines indicate the distance cutoff of ±25 bp from the breakpoints. b. Distribution of translocation footprints in the WT adults (F1) with paternal exposure to IR (90 Gy). Templated inserts are insertions of ≥ 3 bp in between the fusion sites that have a matching sequence within ±25 bp around one of the 2 breakpoints. Miscellaneous insertions are insertions < 3 bp or insertions with no matching sequence within ±25 bp around the breakpoints. c. The same density plot as in (A) but for WT adults (F1) with paternal exposure to IR (90 Gy) (corresponding to the templated insertions in Extended Data Fig. 3B). d. Schematic illustration of the type 2 (top) and type 4 (bottom) translocations. The sense strand is in blue, while the anti-sense strand is in red. The numbers indicate the nucleotide distance to the breakpoints. Type 2 translocations are fusions between the 3′ sense strand with the 5′ anti-sense strand. Type 4 translocations are fusions between the 3′ anti-sense strand with the 5′ sense strand. The yellow boxes indicate the positions that show a microhomology. Type 2 shows a microhomology of the breakpoint of the left flank with the second base of the negative strand of the right flank. Type 4 shows a microhomology of the second to last base of the excluded part of the right flank, and the last base of the excluded part of the left flank. The microhomology of type 4 is therefore not in the regions that get fused. e. The heatmaps represent the sum of all type 2 (top, n = 51 translocations), respective type 4 (bottom, n = 45 translocations), translocation maps derived from the fog-2 adults (F1) with paternal exposure to IR (90 Gy), excluding translocations with a templated insertion. Color-coded is the ratio of similarity. A darker color shows a higher sequence similarity between the corresponding bases. The numbers on the x- and y-axes are the same as in the explanation in Extended Data Fig. 3D. f. Similar to (e) but for WT adults (F1) with parental exposure to IF (90 G y). Type 1 (n = 65 translocations), type 2 (n = 57 translocations) and type 4 (n = 58 translocations) translocation maps derived from the WT adults (F1) with parental exposure to IR (90 Gy), excluding translocation with a templated insertion. g. Base composition around the breakpoints of the translocations with a microhomology of length 1 for fog-2 (left, n = 35) or WT (right, n = 58). Position 0 indicates the break point. Negative numbers are bases not included after the fusion, while positive numbers depict the distance from the fusion site and are included after the fusion. Color-coded are the 4 bases, the shadow in the background shows the distribution of AT, respective CG, for 25.000 permutations. The y-axis shows the percentage of the corresponding base at the given position. h. Knockdown of EV, brc-1, cku-80 and polq-1 by RNAi on the fog-2 mutant with or without paternal IR exposure. n indicating biological replicates are shown. Medians with 95% CI are shown (p-values are shown. GLM with logit link function and Tukey multiple comparisons were used). One-way ANOVA with arcsine transformation was also used for the proportion data to confirm the statistical results and included in the full statistical results shown in Supplementary Table 1.
Extended Data Fig. 7
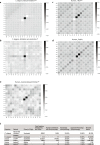
Extended Data Fig. 7. Analysis of public C. elegans and human datasets.
The heatmaps represent the sum of all base similarities of the microhomology deletion break sites. Color-coded is the ratio of similarity. A darker color shows a higher sequence similarity between the corresponding bases. The x-axis is the right, the y-axis the left flank of the deletion break site. Positive values indicate the flanking sequences, negative values the deleted sequences, i.e. -1 is the first deleted base a. The heatmap represents the sum of deletion sites with a length ≤ 200 bp and a 1 bp-microhomology of 540 natural isolates of the CeNDR dataset (22.6% show a 1 bp-microhomology, expected are 16.66 %, binomial p-value = 5e-324, total deletions n = 68062). b. The heatmap shows the sum of deletion sites with a length ≤ 200 bp and a 1 bp-microhomology of samples without mutagen treatment of the public mutation accumulation dataset (24.5% show a 1 bp-microhomology, 16.66 % expected, binomial p-value = 0.00035, total deletions n = 314). c. The heatmap represents the sum of deletion sites with a length ≤ 200 bp and a 2-6 bp microhomology of the human 1000 genome project (28% show a 2-6 bp-microhomology, expected 8.3%, binomial p-value = 1e-323, total deletions n = 501024). d. The heatmap shows the sum of the de novo deletion sites with a length ≤ 200bp and a 2-6 bp microhomology of the de novo structural variants in the children of trios of the Polaris dataset (https://github.com/Illumina/Polaris) (19.5% show a 2-6 bp-microhomology, expected 8.3%, binomial p-value = 1.36e-292, total deletions n = 10883). e. The heatmap shows the sum of the de novo paternally-induced deletions with a length ≤ 200 bp and a 2-6 bp microhomology of 1548 trios from Iceland with known gamete-of-origin (44.2% show a 2-6 bp-microhomology, expected 8.3%, binomial p-value = 3.42e-10, total deletions n = 43). For more details, see Fig. 3E. f. Table shows the microhomology results of the re-analysis of the public C. elegans and human genome sequencing datasets. The heatmap plots are shown in Extended Data Fig. 7 a-e. Binomial test was used, p-values are shown.
Extended Data Fig. 8
Extended Data Fig. 8. HIS-24 regulates the paternally inherited embryonic lethality.
a. RNAi screening of ten DNA-associated protein candidates in hermaphrodite WT animals for the paternally inherited transgenerational embryonic lethality. Knockdown of his-24 significantly reduced the progeny lethality in the F1 generation. n = 3 biological replicates, medians with 95% CI are shown (p-values are shown. GLM with logit link function and Tukey multiple comparisons were used). b. Progeny lethality characterization of EV (RNAi); fog-2 and his-24 (RNAi); fog-2 with or without paternal IR irradiation (60 Gy and 90 Gy). n indicating biological replicates are shown. Medians with 95% CI are shown (p-values are shown. GLM with logit link function was used). c. Progeny lethality characterization of EV (RNAi); fog-2, his-24 (RNAi); fog-2, and hpl-1 (RNAi); fog-2 with or without paternal IR irradiation (90 Gy). n indicating biological replicates are shown. Medians with 95% CI are shown (p-values are shown, GLM with logit link function and Tukey multiple comparisons were used). d. Knockdown of EV, his-24, hpl-1 and hpl-2 in hermaphrodite WT and brc-1 mutants with parental IR exposure (90 Gy) at the late L4 stage, and characterization of the progeny lethality in the F1 generation. Medians with 95% CI are shown (n indicating biological replicates are shown, p-values are shown. GLM with logit link function and Tukey multiple comparisons were used). One-way ANOVA (a and c) Two-way ANOVA (d) and two-tailed t-test (b) with arcsine transformation were also used for the proportion data to confirm the statistical results and are included in the full statistical results shown in Supplementary table 1.

Comment in

Similar articles

Cited by

References

    1. Kong A, et al. Rate of de novo mutations and the importance of father’s age to disease risk. Nature. 2012;488:471–475. doi: 10.1038/nature11396. - DOI - PMC - PubMed
    1. UNSCEAR. Hereditary Effects of Radiation. 2001 Report to the General Assembly, with Scientific Annex (United Nations, 2001).
    1. Schumacher B, Pothof J, Vijg J, Hoeijmakers JHJ. The central role of DNA damage in the ageing process. Nature. 2021;592:695–703. doi: 10.1038/s41586-021-03307-7. - DOI - PMC - PubMed
    1. Vijg J, Dong X. Pathogenic mechanisms of somatic mutation and genome mosaicism in aging. Cell. 2020;182:12–23. doi: 10.1016/j.cell.2020.06.024. - DOI - PMC - PubMed
    1. Wright, S. The Roles of Mutation, Inbreeding, Crossbreeding, and Selection in Evolution. In: Proc. of the XI International Congress of Genetics8, 209–222 (1932).

Publication types