Observational Study
. 2023 Jan;4(1):81-95.
doi: 10.1038/s43018-022-00502-x. Epub 2022 Dec 21.

Potent high-avidity neutralizing antibodies and T cell responses after COVID-19 vaccination in individuals with B cell lymphoma and multiple myeloma

Affiliations
Observational Study

Potent high-avidity neutralizing antibodies and T cell responses after COVID-19 vaccination in individuals with B cell lymphoma and multiple myeloma

Andrea Keppler-Hafkemeyer et al. Nat Cancer. 2023 Jan.

Abstract

Individuals with hematologic malignancies are at increased risk for severe coronavirus disease 2019 (COVID-19), yet profound analyses of COVID-19 vaccine-induced immunity are scarce. Here we present an observational study with expanded methodological analysis of a longitudinal, primarily BNT162b2 mRNA-vaccinated cohort of 60 infection-naive individuals with B cell lymphomas and multiple myeloma. We show that many of these individuals, despite markedly lower anti-spike IgG titers, rapidly develop potent infection neutralization capacities against several severe acute respiratory syndrome coronavirus 2 variants of concern (VoCs). The observed increased neutralization capacity per anti-spike antibody unit was paralleled by an early step increase in antibody avidity between the second and third vaccination. All individuals with hematologic malignancies, including those depleted of B cells and individuals with multiple myeloma, exhibited a robust T cell response to peptides derived from the spike protein of VoCs Delta and Omicron (BA.1). Consistently, breakthrough infections were mainly of mild to moderate severity. We conclude that COVID-19 vaccination can induce broad antiviral immunity including ultrapotent neutralizing antibodies with high avidity in different hematologic malignancies.


Conflict of interest statement

The authors declare no competing interests.

Figures
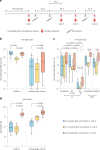
Fig. 1
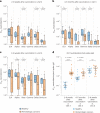
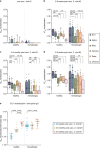
Fig. 1. Study time chart, anti-spike IgG levels and IgG avidity in individuals with hematologic neoplasia and in healthy individuals at different time points after COVID-19 vaccination.
a, Time chart of the study depicting time points of vaccination and blood sample collection in a cohort of individuals with hematologic cancers. Prevaccination samples were collected shortly before vaccination 1 (visit 1). Visit 2 occurred 2–8 weeks (median of 35 d) after vaccination 2. Visit 3 occurred 4–5 months (median of 149 d) after vaccination 2. Visit 4 occurred 2–8 weeks (median of 40 d) after vaccination 3. Vaccinations 1 and 2 were administered 6 weeks apart (median of 42 d); vaccinations 2 and 3 were 6 months apart (median of 189 d). bd, Data are depicted as box plots with median, bounds between upper and lower quartiles and whiskers between the 10th and 90th percentiles. Differences between time points (visit 2, blue; visit 3, yellow; visit 4, red) were analyzed for statistical significance using the Kruskal–Wallis test with Dunn’s multiple-testing correction. Brackets show statistically significant differences, and precise numerical P values are indicated. Absence of brackets indicates absence of significance. b, Anti-spike S1 domain IgG titers in BAU per ml at different time points after vaccinations 2 and 3. The following samples were analyzed for groups of healthy individuals and individuals with hematologic neoplasia: 2–8 weeks after vaccination 2 (visit 2, blue; N = 21/N = 57), 4–5 months after vaccination 2 (visit 3, yellow; N = 20/N = 42) and 2–8 weeks after vaccination 3 (visit 4, red; N = 19/N = 42). c, Levels of antibody specific to the spike S1 domain after vaccinations 2 and 3 comparing subgroups of individuals with hematologic neoplasia; untreated LY (visit 2, N = 9; visit 3, N = 6; visit 4, N = 8)/LYs treated with Rx 12–60 months before receiving the first vaccination (Rx 12–60; visit 2, N = 9; visit 3, N = 7; visit 4, N = 6)/LYs treated with Rx in the last 12 months before the first vaccination (Rx < 12; visit 2, N = 14; visit 3, N = 10; visit 4, N = 9)/untreated MM (visit 2, N = 9; visit 3, N = 9; visit 4, N = 8)/treated MM (visit 2, N = 12; visit 3, N = 8; visit 4, N = 9). d, Avidity of anti-spike IgG at different time points after vaccinations 2 and 3; healthy individuals: visit 2 (N = 20)/visit 3 (N = 21)/visit 4 (N = 11); individuals with hematologic malignancies: visit 2 (N = 20)/visit 3 (N = 12)/visit 4 (N = 23). Source data
Fig. 2
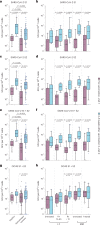
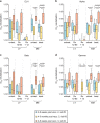
Fig. 2. Comparison of infection neutralization activities for SARS-CoV-2 VoCs in individuals with hematologic neoplasia and healthy individuals at different time points after COVID-19 vaccination.
Serum dilutions for half-maximal infection neutralization capacities normalized to 107 viral RNA copies (neutralization IC50 values) are depicted for different SARS-CoV-2 variants as box plots with median, bounds between upper and lower quartiles and whiskers between the 10th and 90th percentiles. Differences between groups were tested for their statistical significance using the Mann–Whitney test. Brackets show statistically significant differences, and precise numerical P values are indicated. Absence of brackets or P values indicates absence of significance. a, Neutralization IC50 values at 2–8 weeks after vaccination 2 (visit 2) for SARS-CoV-2 variants in healthy individuals (N = 21) versus in individuals with hematologic malignancies (N = 56). b, Neutralization IC50 values at 4–5 months after vaccination 2 (visit 3) for SARS-CoV-2 variants (EU1, Alpha, Beta, Gamma, Delta and Omicron BA.1, respectively) in healthy individuals (N = 21, 21, 21, 21, 21 and 21, respectively) versus in individuals with hematologic malignancies (N = 36, 36, 36, 36, 36 and 36, respectively). c, Neutralization IC50 values at 2–8 weeks after vaccination 3 (visit 4) for SARS-CoV-2 variants (EU1, Alpha, Beta, Gamma, Delta and Omicron BA.1, respectively) in healthy individuals (N = 19, 19, 19, 19, 19 and 19, respectively) versus in individuals with hematologic malignancies (N = 42, 42, 42, 42, 42 and 42, respectively). d, Ratios between infection neutralization IC50 values for EU1 values and anti-spike S1 domain titers at visits 2, 3 and 4, respectively, comparing vaccinated healthy individuals (N = 18, 20 and 19, respectively) and individuals with hematologic malignancies (N = 34, 22 and 21, respectively). Medians and IQRs (error bars) are depicted. Source data
Fig. 3
Fig. 3. Longitudinal comparison of infection neutralization activities against Delta and Omicron in sera from subgroups of individuals with hematologic neoplasia.
a, Infection neutralization IC50 values for the Delta VoC. b, Infection neutralization IC50 values for the Omicron (BA.1) VoC. Neutralization IC50 values in serum are depicted for different SARS-CoV-2 variants as box plots with median, bounds between upper and lower quartiles and whiskers between the 10th and 90th percentiles. Differences between time points were tested for their statistical significance using the Kruskal–Wallis test with Dunn’s multiple-testing correction. Brackets show statistically significant differences, and precise numerical P values are indicated. Absence of brackets or P values indicates absence of statistical significance. Sera from the following subgroups of individuals were analyzed at visit 2 (blue), visit 3 (yellow) and visit 4 (red); untreated LY (Delta VoC: visit 2/visit 3/visit 4: N = 8/6/8, respectively; Omicron (BA.1) VoC: visit 2/visit 3/visit 4: N = 8/6/8, respectively); individuals with LY treated with Rx 12–60 months before receiving the first vaccination (Rx 12–60; Delta: visit 2/visit 3/visit 4: N = 9/7/6, respectively; Omicron (BA.1): visit 2/visit 3/visit 4: N = 9/7/6, respectively); individuals with LY treated with Rx in the last 12 months before the first vaccination (Rx < 12; Delta: visit 2/visit 3/visit 4: N = 14/9/10, respectively; Omicron (BA.1): visit 2/visit 3/visit 4: N = 14/9/9, respectively); untreated MM (Delta: visit 2/visit 3/visit 4: N = 9/9/8, respectively; Omicron (BA.1): visit 2/visit 3/visit 4: N = 9/8/8, respectively); treated MM (Delta: visit 2/visit 3/visit 4: N = 12/8/9, respectively; Omicron (BA.1): visit 2/visit 3/visit 4: N = 12/8/9, respectively). Source data
Fig. 4
Fig. 4. SARS-CoV-2- and OC43-specific T cell responses in individuals with hematologic malignancies before and after two-dose COVID-19 mRNA vaccination.
T cell responses analyzed by IFNγ ELISpot and expressed as SFU per 106 T cells are shown as box plots with median, bounds between upper and lower quartiles and whiskers between the 10th and 90th percentiles. Samples were obtained before vaccination 1 (visit 1) or at 2–8 weeks after vaccination 2 (visit 2). Differences between time points were analyzed for statistical significance using the Wilcoxon matched-pairs signed-rank test, and differences between healthy donors and individuals with hematologic malignancies were analyzed using the Mann–Whitney test. Brackets show statistically significant differences, and precise numerical P values are indicated. Absence of brackets or P values indicates absence of statistical significance. a,b, T cell responses to SARS-CoV-2 spike S1. c,d, T cell responses to SARS-CoV-2 spike S2. e,f, Sum of T cell responses to SARS-CoV-2 spike S1 and S2. g,h, Sum of T cell responses to human coronavirus OC43 spike S1 and S2. Results in a, c, e and g are shown for infection-naive healthy individuals (visit 1: N = 12/visit 2: N = 12) versus individuals with hematologic malignancies (visit 1: N = 53/visit 2: N = 53). Results in b, d, f and h are shown for infection-naive individuals with hematologic malignancies split into five subgroups: individuals with LY never treated with Rx or last treated more than 5 years before vaccination (untreated), individuals with LY last treated with Rx 12–60 months before vaccination (Rx 12–60), individuals with LY treated with Rx within 12 months before vaccination (LY < 12), individuals with MM not receiving therapy at the time of vaccination (untreated) and individuals with MM receiving therapy at the time of vaccination (treated). The number of individuals with hematologic neoplasia in these subgroups was as follows: untreated LY (visit 1, N = 9; visit 2, N = 9)/Rx 12–60 (visit 1, N = 8; visit 2, N = 8)/Rx < 12 (visit 1, N = 13; visit 2, N = 13)/untreated MM (visit 1, N = 8; visit 2, N = 8)/treated MM (visit 1, N = 11; visit 2, N = 11). Source data
Fig. 5
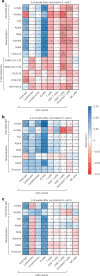
Fig. 5. Comparison of humoral and T cell responses, leukocyte and leukocyte subgroup counts and total serum IgG in individuals with hematologic malignancies.
ac, IgG-type anti-SARS-CoV-2 spike levels, antibody avidity, serum neutralization activity against different SARS-CoV-2 variants and specific T cell responses against peptides derived from SARS-CoV-2 and OC43 spike and adenovirus (AdV) 5 hexon protein measured in individuals with hematologic malignancies were compared to counts of leukocytes, lymphocytes, B cells, T cells, CD4+ T cells, CD8+ T cells, activated T cells and natural killer (NK) cells and total serum IgG concentrations. Spearman’s correlation analysis was performed using an asymptotic two-sided test of the null hypothesis r = 0 versus r ≠ 0 based on the t distribution with n – 2 d.f. Spearman’s correlation coefficients (r) between SARS-CoV-2-specific immune responses and cell counts as well as total IgG concentrations are depicted as heat maps for the following time points: 2–8 weeks after vaccination 2 (visit 2; a), 4–5 months after vaccination 2 (visit 3; b) and 2–8 weeks after vaccination 3 (visit 4; c). P values are depicted for all significant correlations. Absence of P values indicates absence of significance; n indicates the number of pairs analyzed. Source data
Extended Data Fig. 1
Extended Data Fig. 1. Comparison of IgG-type antibody levels and avidity in healthy individuals and patients with hematologic neoplasia at different time points before and after COVID-19 vaccination.
Data is depicted as boxplots with median, bounds between upper and lower quartiles, and whiskers between the 10th and 90th percentile. Differences between groups (healthy individuals/ patients with hematologic malignancies) were analyzed for statistical significance using the Mann-Whitney test. Brackets show statistically significant differences. Absence of brackets or p-values indicate absence of significance. a, Anti-spike S1 domain IgG titers in BAU/mL prior to vaccination in patients with hematologic malignancies (n = 56). b, Anti-spike S1 domain IgG antibody levels at different time points after COVID-19 vaccinations #2 and #3 in healthy individuals (visit #2/ visit# 3/ visit #4: n = 21/20/19, respectively) and in cancer patients (visit #2/ visit# 3/ visit #4: n = 57/42/42, respectively). c, Anti-spike IgG antibody avidity at different time points after vaccinations #2 and #3. Healthy individuals: visit #2 (n = 20)/ visit #3 (n = 21)/ visit #4 (n = 11); Hematologic malignancies: visit #2 (n = 20/ visit #3 (n = 12)/ visit #4 (n = 23). Source data
Extended Data Fig. 2
Extended Data Fig. 2. Variant-centered comparison of infection-neutralization activities against SARS-CoV-2 in healthy individuals and patients with hematologic neoplasia at different time points before and after vaccination, and longitudinal evaluation of ratios between infection-neutralization and anti-spike antibody levels.
Serum dilutions for half-maximal infection-neutralization capacities normalized to 107 viral RNA copies (neutralization IC50-values) are depicted for different SARS-CoV-2 variants as box plots with median, bounds between upper and lower quartiles, and whiskers between the 10th and 90th percentiles. a, Neutralization IC50-values pre-vaccination (visit #1) from healthy individuals (n = 12) and from patients with hematologic neoplasia (n = 53) were analyzed. b, Neutralization IC50-values 2-8 weeks post vaccination #2 (visit #2) from healthy individuals (n = 21) and patients with hematologic neoplasia (n = 56) were analyzed. c, Neutralization IC50-values 4-5 months post vaccination #2 (visit #3) from healthy individuals (n = 21) and from patients with hematologic neoplasia (n = 36) were analyzed. d, Neutralization IC50-values 2-8 weeks post vaccination #3 (visit #4) from healthy individuals (n = 19) and from patients with hematologic neoplasia (n = 42) were analyzed. e, Longitudinal evaluation of ratios between infection-neutralization IC50 values for EU1 and anti-spike S1 domain antibody titers for EU1 in vaccinated healthy individuals (visits #2, #3 and #4: n = 18/20/19, respectively) and hematologic patients (visits #2, #3 and #4: n = 34/22/21, respectively). Medians and interquartile ranges (error bars) are depicted. Differences between groups were tested for their statistical significance using the two-tailed Friedman test with Dunn’s multiple testing correction in (a-d), and the Kruskal-Wallis-test with Dunn’s multiple testing correction in (e). Brackets show statistically significant differences. Absence of brackets or p-values indicates absence of significance. Source data
Extended Data Fig. 3
Extended Data Fig. 3. Longitudinal comparison of infection-neutralization activities against SARS-CoV-2 variants EU1, Alpha, Beta, and Gamma in subgroups of patients with hematologic neoplasia.
Serum dilutions for half-maximal infection-neutralization capacities normalized to 107 viral RNA copies (neutralization IC50-values) are depicted for different SARS-CoV-2 variants as box plots with median, bounds between upper and lower quartiles, and whiskers between the 10th and 90th percentiles. Differences between time points were tested for their statistical significance using the Kruskal-Wallis-test with Dunn’s multiple testing correction. Brackets show statistically significant differences. Absence of brackets or p-values indicates absence of significance. Sera from the following subgroups of patients were analyzed at visit #2 (blue), visit #3 (yellow) and visit #4 (red). a, Neutralization IC50-values for SARS-CoV-2 variant EU1. b, Neutralization IC50-values for VoC Alpha. c, Neutralization IC50-values for VoC Beta. d, Neutralization IC50-values for VoC Gamma: Untreated LY (visit #2/ visit #3/ visit #4: n = 8/6/8, respectively); Rx 12-60 (visit #2/ visit #3/ visit #4: n = 9/7/6, respectively); Rx <12 (visit #2/ visit #3/ visit #4: n = 14/9/9, respectively); untreated MM (visit #2/ visit #3/ visit #4: n = 9/9/8, respectively) and treated MM (visit #2/ visit #3/ visit #4: n = 12/8/9, respectively). Source data
Extended Data Fig. 4
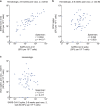
Extended Data Fig. 4. Correlation analysis of T-cell and antibody responses in hematologic patients at different time points before and after COVID-19 vaccination.
Dot plots of T-cell responses analyzed by IFN-γ ELISpot and expressed as spot-forming units (SFU) per 106 T cells as well as anti-SARS-CoV-2 spike S1 domain antibody responses in BAU/mL. Two-tailed Spearman’s rank correlation analysis was performed to calculate correlation coefficients (r) and analyze statistical significance. a, Correlation of T-cell responses to peptide pools for SARS-CoV-2 VoC delta spike S1 and S2 domain in 53 patients with hematologic neoplasia at 2-8 weeks post vaccination #2. b, Correlation of T-cell responses to peptide pools for Delta spike or for human coronavirus (hCoV) OC43 in 53 patients with hematologic neoplasia at 2-8 weeks post vaccination #2. c, Correlation of T-cell responses to peptide pools for Delta spike, 2-8 weeks post vaccination #2, and for hCoV-OC43 prior to vaccination in 53 patients with different hematologic neoplasia. Source data
Extended Data Fig. 5
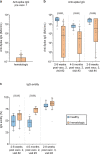
Extended Data Fig. 5. SARS-CoV-2 nucleocapsid- and adenovirus 5 hexon-specific T-cell responses in healthy individuals and patients with hematologic malignancies before and after the second COVID-19 vaccination.
T-cell responses analyzed by IFN-γ ELISpot and expressed as spot-forming units (SFU) per 106 T cells are shown as box plots with median, bounds between upper and lower quartiles, and whiskers between the 10th and 90th percentiles. Results from infection-naive healthy individuals and patients with hematologic malignancies before vaccination (visit #1, purple) and after the second vaccine dose (visit #2, blue) are shown in (a, b): Responses to a peptide pool for SARS-CoV-2 nucleocapsid (hematological patients: visit #1/visit #2: n = 45/45, respectively) are shown in (a), and to a peptide pool for adenovirus 5 hexon protein (healthy individuals: visit #1/visit #2: n = 12/12, respectively; hematological patients: visit #1/visit #2: n = 47/47, respectively; the six patients who had received a dose of the adenoviral AstraZeneca vaccine were excluded) in (b). Brackets show statistically significant differences. Absence of brackets or p-values indicates absence of significance. Source data
Extended Data Fig. 6
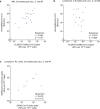
Extended Data Fig. 6. Correlation analysis of T-cell and antibody responses in patients with MM or LY at different time points after COVID-19 vaccination.
Correlation of T-cell responses to peptide pools for Delta spike and levels of antibodies against the spike S1-domain 2-8 weeks post vaccination #2 in 19 patients with MM. b, Correlation of T-cell responses to peptide pools for Delta spike and levels of antibodies against the spike S1-domain 2-8 weeks post vaccination #2 in 30 patients with LY. c, Correlation of T-cell responses to peptide pools for spike from Delta and Omicron (BA.1) 2-8 weeks post vaccination #3 in 8 patients with LY last treated with Rx 12-60 months before vaccination. Source data
Extended Data Fig. 7
Extended Data Fig. 7. T-cell responses to VoCs Delta and Omicron in patients with lymphomas at different time points after the second and third COVID-19 mRNA vaccination.
Responses to peptide pools spanning Delta spike (S1 + S2) or Omicron (BA.1) spike (S1 + S2) are shown in patients (n = 8) who received Rx treatment 12–60 months before vaccination are shown in (a) and combined responses to Delta and Omicron (BA.1) spike peptides in (b). Patients were studied 2-8 weeks post vaccination #2 (visit #2), 4-5 months post vaccination #2 (visit #3), and 2-8 weeks post vaccination #3 (visit #4). Differences between time points were analyzed for statistical significance using the Friedman test with Dunn’s multiple testing correction. However, no statistically significant differences were detected. Source data
Extended Data Fig. 8
Extended Data Fig. 8. Comparison of vaccine-induced neutralization responses, anti-spike IgG antibody avidities and T-cell responses.
a, IgG-type anti-spike antibody avidities were compared to serum neutralization activities against different SARS-CoV-2 variants in healthy individuals and hematologic patients 2-8 weeks after vaccination #2 (visit #2), 4-5 months after vaccination #2 (visit #3), and 2-8 weeks after vaccination #3 (visit #4). b, 2-9 weeks after vaccination #2 (visit #2) anti-SARS-CoV-2 spike antibody levels, antibody avidity and serum neutralization activity against different SARS-CoV-2 variants were compared with specific T-cell responses against peptides derived from SARS-CoV-2 and OC43 spike as well as adenovirus 5 hexon protein in hematologic patients. Spearman’s correlation analysis in (a, b) was performed using an asymptotic two-sided test of the null hypothesis r = 0 vs r ≠ 0 based on the t distribution with n-2 degrees of freedom. Spearman’s correlation coefficients (r) are depicted as heatmaps for the indicated time-points. P-values are depicted for all significant correlations. Absence of p-values indicates absence of significance. n – number of pairs analyzed. Source data

Comment in

Similar articles

Cited by

References

    1. Lee LYW, et al. COVID-19 prevalence and mortality in patients with cancer and the effect of primary tumour subtype and patient demographics: a prospective cohort study. Lancet Oncol. 2020;21:1309–1316. doi: 10.1016/S1470-2045(20)30442-3. - DOI - PMC - PubMed
    1. Bange EM, et al. CD8+ T cells contribute to survival in patients with COVID-19 and hematologic cancer. Nat. Med. 2021;27:1280–1289. doi: 10.1038/s41591-021-01386-7. - DOI - PMC - PubMed
    1. Grivas P, et al. Association of clinical factors and recent anticancer therapy with COVID-19 severity among patients with cancer: a report from the COVID-19 and Cancer Consortium. Ann. Oncol. 2021;32:787–800. doi: 10.1016/j.annonc.2021.02.024. - DOI - PMC - PubMed
    1. Rugge M, Zorzi M, Guzzinati S. SARS-CoV-2 infection in the Italian Veneto region: adverse outcomes in patients with cancer. Nat. Cancer. 2020;1:784–788. doi: 10.1038/s43018-020-0104-9. - DOI - PubMed
    1. Albiges L, et al. Determinants of the outcomes of patients with cancer infected with SARS-CoV-2: results from the Gustave Roussy cohort. Nat. Cancer. 2020;1:965–975. doi: 10.1038/s43018-020-00120-5. - DOI - PubMed

Publication types

Supplementary concepts