. 2022 Dec 21;13(12):1063.
doi: 10.1038/s41419-022-05457-6.

Functional investigation of SLC1A2 variants associated with epilepsy

Affiliations

Functional investigation of SLC1A2 variants associated with epilepsy

Qi Qu et al. Cell Death Dis. .

Abstract

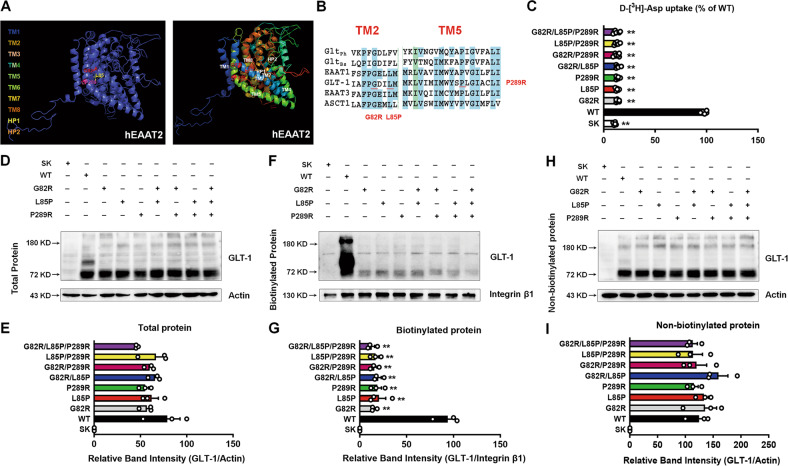
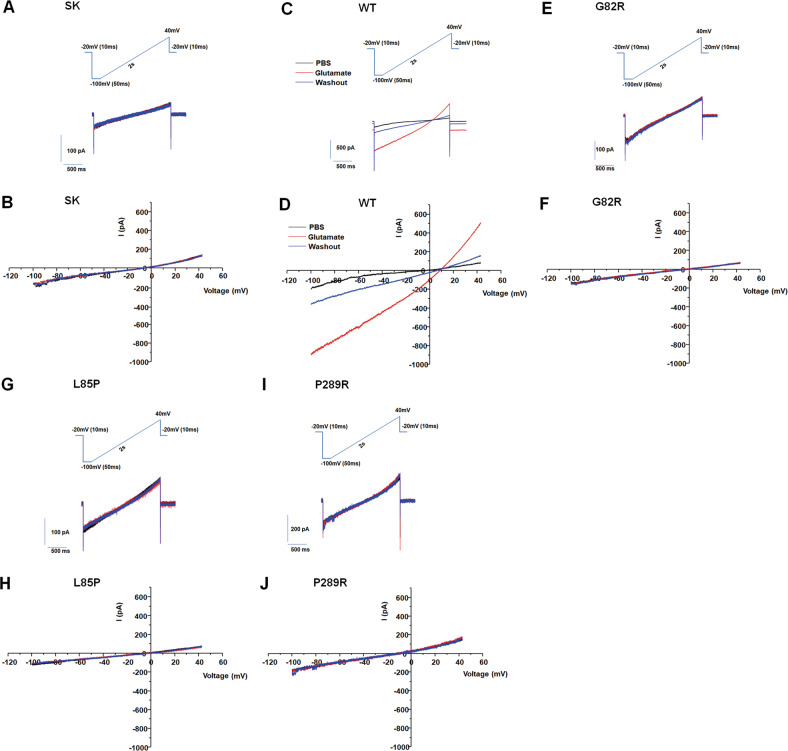
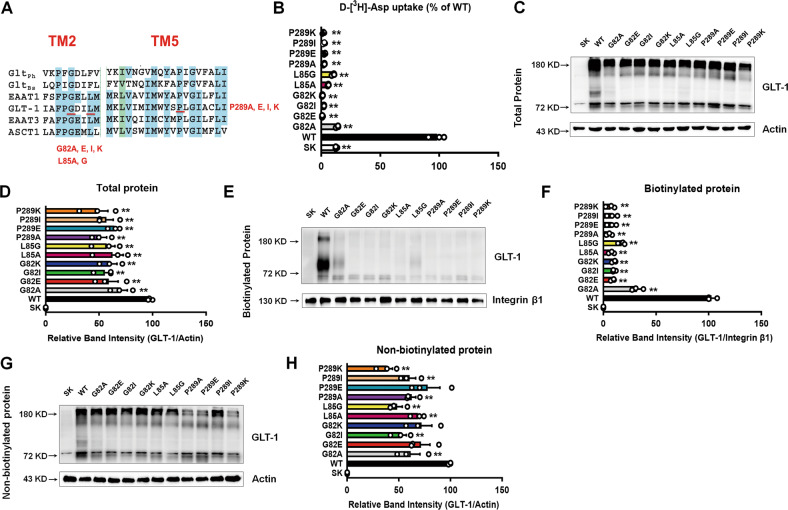
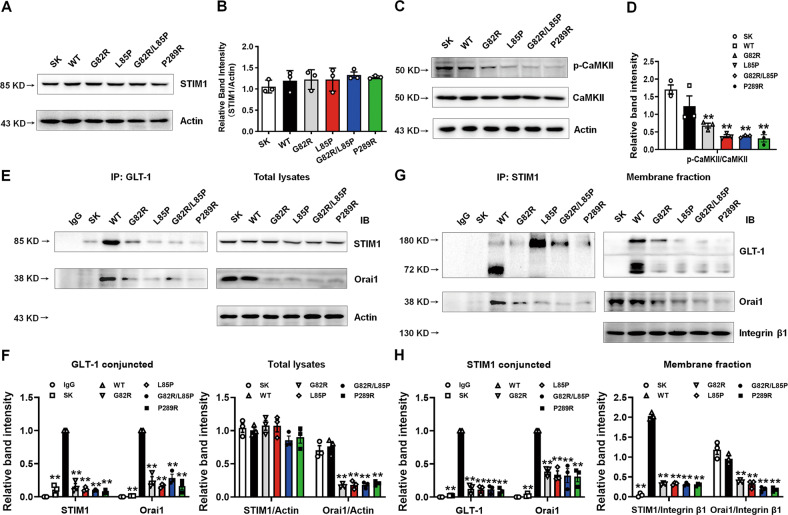
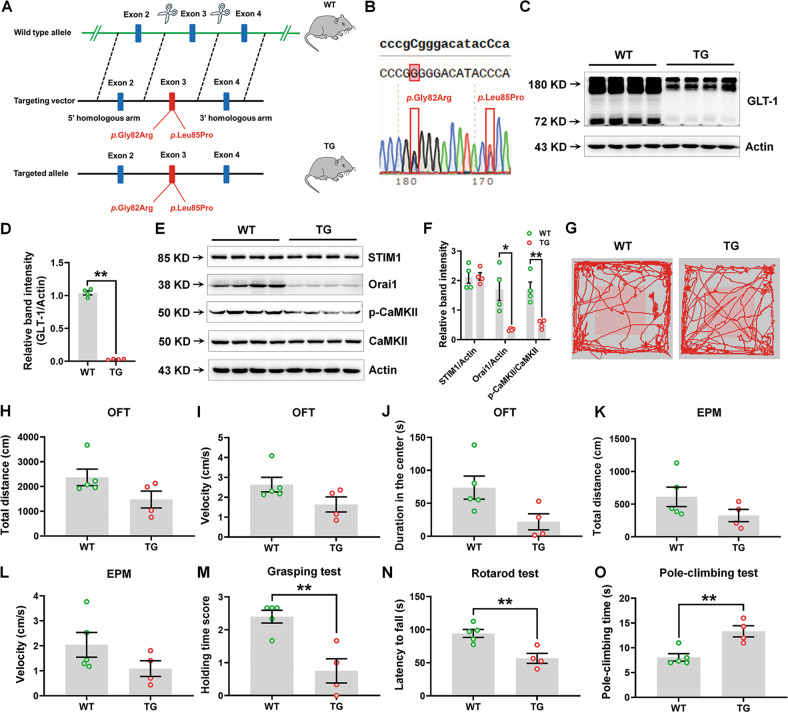
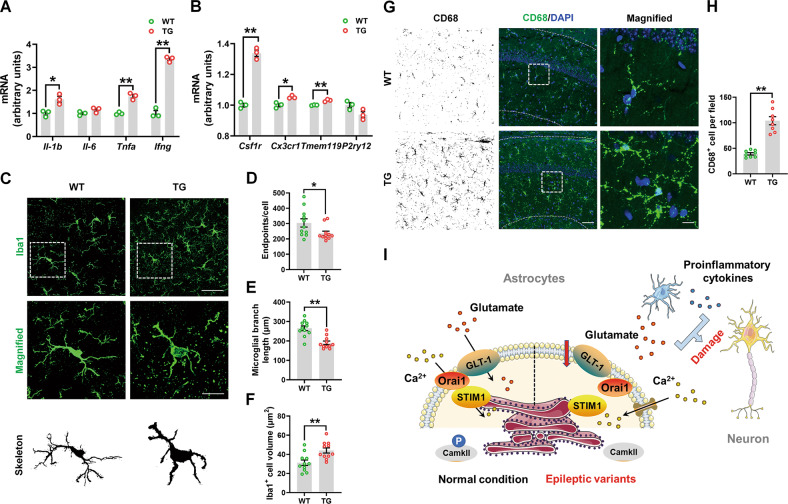
Epilepsy is a common neurological disorder and glutamate excitotoxicity plays a key role in epileptic pathogenesis. Astrocytic glutamate transporter GLT-1 is responsible for preventing excitotoxicity via clearing extracellular accumulated glutamate. Previously, three variants (G82R, L85P, and P289R) in SLC1A2 (encoding GLT-1) have been clinically reported to be associated with epilepsy. However, the functional validation and underlying mechanism of these GLT-1 variants in epilepsy remain undetermined. In this study, we reported that these disease-linked mutants significantly decrease glutamate uptake, cell membrane expression of the glutamate transporter, and glutamate-elicited current. Additionally, we found that these variants may disturbed stromal-interacting molecule 1 (STIM1)/Orai1-mediated store-operated Ca2+ entry (SOCE) machinery in the endoplasmic reticulum (ER), in which GLT-1 may be a new partner of SOCE. Furthermore, knock-in mice with disease-associated variants showed a hyperactive phenotype accompanied by reduced glutamate transporter expression. Therefore, GLT-1 is a promising and reliable therapeutic target for epilepsy interventions.


Conflict of interest statement

The authors declare no competing interests.

Figures

Fig. 1
Fig. 1. Epileptic variants decrease the expression and function of GLT-1.
A Topological location of Gly-82, Leu-85, and Pro-289 residues in human EAAT2. B Comparison of the amino acid sequences of epileptic variants (G82R, L85P, and P289R) between Gltph and EAATs. Regions of high homology of GltPh and EAATs are highlighted in blue. C D-[3H]-Asp uptake activity after transfection with different plasmids (SK, WT, G82R, L85P, P289R, G82R/L85P, G82R/P289R, L85P/P289R, and G82R/L85P/P289R) were determined. n = 6 per group. The representative blots and quantification of total proteins (D, E), biotinylated membrane proteins (F, G), and non-biotinylated proteins (H, I) of GLT-1 were measured by Western blot. n = 3 per group. Results are expressed as mean ± SD. **P < 0.01 vs. WT. Statistical significance was determined using one-way ANOVA and Tukey’s test for post hoc comparisons.
Fig. 2
Fig. 2. Epileptic variants inhibited glutamate-elicited currents.
Glutamate-elicited inward currents after transfection with different plasmids, including SK (A, B), WT (C, D), G82R (E, F), L85P (G, H), and P289R (I, J), were evaluated by electrophysiology. Representative traces of PBS, glutamate, and washout are presented in (A, C, E, G, and I).
Fig. 3
Fig. 3. Epileptic variants did not affect the side-chain structure of GLT-1.
A The three epileptic variants were mutated with amino acids with similar properties as the original amino acids (G82A, G82E, G82I, G82K; L85A, L85G; P289A, P289E, P289I, P289K). B After transfection with different plasmids, D-[3H]-Asp uptake activity was determined. n = 3 per group. The representative blots and quantification of total proteins (C, D), biotinylated membrane proteins (E, F), and non-biotinylated proteins (G, H) of GLT-1 were measured by Western blot. n = 3 per group. Results are expressed as mean ± SD. **P < 0.01 vs. WT. Statistical significance was determined using one-way ANOVA and Tukey’s tests for post hoc comparisons.
Fig. 4
Fig. 4. Epileptic variants affected the STIM1/Orai1 complex.
A, B The representative blots and quantification of STIM1 after transfection with different plasmids (SK, WT, G82R, L85P, G82R/L85P, and P289R) in HeLa cells were determined by Western blot. n = 3 per group. C, D The representative blots and quantification of the phosphorylation of CaMKII and total CaMKII after transfection with different plasmids in HeLa cells were determined by Western blot. n = 3 per group. E, F The interaction between GLT-1 and STIM1 or Orai1 was determined by a Co-IP assay using GLT-1 as the capture antibody. G, H The interaction between GLT-1 and STIM1 or Orai1 was determined by a Co-IP assay using STIM1 as the capture antibody. n = 3 per group. Results are expressed as mean ± SD. **P < 0.01 vs. WT. Statistical significance was determined using one-way ANOVA and Tukey’s tests for post hoc comparisons.
Fig. 5
Fig. 5. Disease-related variants altered the morphology of the endoplasmic reticulum (ER).
After transfection with different plasmids (SK, WT, G82R, L85P, G82R/L85P, and P289R) in HeLa cells, the morphology of ER was observed using TEM (AF). The epileptic variants induced ER swelling (as indicated by the red arrows in (CF). Scale bar, 1 μm. Magnified images are shown in the column of (af). Scale bar, 200 nm.
Fig. 6
Fig. 6. Establishment of G82R/L85P variant knock-in mice.
A, B Strategy of establishing the G82R/L85P variant knock-in mice. C, D Representative blots and quantification of GLT-1 in the hippocampus of WT and TG mice were determined by Western blot. n = 4 per group. E, F The representative blots and quantification of STIM1, Orai1, phosphorylation of CaMKII, and total CaMKII in the hippocampus of WT and TG mice were determined by Western blot. n = 4 per group. G The representative trace mice traveled in the open field. The total traveled distance (H), movement speed (I) in the OFT, and duration in the center zone of open field (J) are shown. K, L The total traveled distance and movement speed in the EPM test. M The grasping test was used to examine the grip strength of mice. N The rotarod test was used to examine the motor coordination of mice. O The pole-climbing test was used to examine bradykinesia in mice. n = 5 for WT mice (four males and one female) and n = 4 for TG mice (three males and one female). Results are expressed as mean ± SD. **P < 0.01, **P < 0.05 vs. WT. Statistical significance was determined using Student’s t test.
Fig. 7
Fig. 7. Transcriptome analysis of G82R/L85P variant knock-in mice.
A PCA score plots revealed a distinct separation between components in WT and TG mice. B DEGs between WT and TG mice are shown in a volcano plot. C, D The representative GO pathways enriched by down- and up-regulated DEGs between WT and TG mice are shown. E Downregulated DEGs enriched in “Glial cell development” and “Mitochondrial ATP synthesis coupled electron transport” pathways are shown. F Upregulated DEGs enriched in the “Cytokine-mediated signaling pathway” are shown.
Fig. 8
Fig. 8. G82R/L85P variant knock-in mice had neuroinflammation.
A, B The mRNA expression levels of Il-1b, Il-6, Tnfa, Ifng, Csf1r, Cx3cr1, Tmem119, and P2ry12 were determined by qRT-PCR. C Immunofluorescence staining of Iba1-positive cells in the hippocampus of WT and TG mice. Scale bar, 20 μm. Magnified Iba1-positive cells are shown in the middle column of panel (C), and their skeletal images are shown in the bottom column of panel (C). Scale bar, 5 μm. DF Quantification of endpoints per cell, branch length, and the volume of Iba1-positive cells in panel (C). n = 11 per group. G Immunofluorescence staining of CD68-positive cells in the hippocampus of WT and TG mice. Scale bar, 50 μm. Magnified CD68-positive cells are shown in the right column of panel (G). Scale bar, 10 μm. H Quantification of the numbers of CD68-positive cells in panel (G). n = 8 per group. I Schematic model of the study. In the normal condition, GLT-1 is responsible for glutamate uptake and interacts with STIM1/Orai1 to maintain the Ca2+ refilling and phosphorylation of CaMKII in the ER. However, epileptic variants (G82R, L85P, and P289R) decrease the expression and function of GLT-1 and inhibit STIM1/Orai1-mediated SOCE together with the phosphorylation of CaMKII. Glutamate excitotoxicity and microglia-released proinflammatory cytokines damage the hippocampal neurons and induce epilepsy. Results are expressed as mean ± SD. **P < 0.01, **P < 0.05 vs. WT. Statistical significance was determined using Student’s t test.

Similar articles

Cited by

References

    1. Thijs RD, Surges R, O’Brien TJ, Sander JW. Epilepsy in adults. Lancet. 2019;393:689–701. doi: 10.1016/S0140-6736(18)32596-0. - DOI - PubMed
    1. Fisher RS, Acevedo C, Arzimanoglou A, Bogacz A, Cross JH, Elger CE, et al. ILAE official report: a practical clinical definition of epilepsy. Epilepsia. 2014;55:475–82. doi: 10.1111/epi.12550. - DOI - PubMed
    1. Kanner AM, Bicchi MM. Antiseizure medications for adults with epilepsy: a review. Jama. 2022;327:1269–81. doi: 10.1001/jama.2022.3880. - DOI - PubMed
    1. Vezzani A, Fujinami RS, White HS, Preux PM, Blumcke I, Sander JW, et al. Infections, inflammation and epilepsy. Acta Neuropathol. 2016;131:211–34. doi: 10.1007/s00401-015-1481-5. - DOI - PMC - PubMed
    1. Dahlin M, Prast-Nielsen S. The gut microbiome and epilepsy. EBioMedicine. 2019;44:741–6. doi: 10.1016/j.ebiom.2019.05.024. - DOI - PMC - PubMed

Publication types