. 2022 Nov 30:10:1042403.
doi: 10.3389/fcell.2022.1042403. eCollection 2022.

The guanine nucleotide exchange factor Vav3 intervenes in the migration pathway of oligodendrocyte precursor cells on tenascin-C

Affiliations

The guanine nucleotide exchange factor Vav3 intervenes in the migration pathway of oligodendrocyte precursor cells on tenascin-C

Ina Schäfer et al. Front Cell Dev Biol. .

Abstract

Oligodendrocyte precursor cells (OPCs) are the exclusive source of myelination in the central nervous system (CNS). Prior to myelination, OPCs migrate to target areas and mature into myelinating oligodendrocytes. This process is underpinned by drastic changes of the cytoskeleton and partially driven by pathways involving small GTPases of the Rho subfamily. In general, the myelination process requires migration, proliferation and differentiation of OPCs. Presently, these processes are only partially understood. In this study, we analyzed the impact of the guanine nucleotide exchange factor (GEF) Vav3 on the migration behavior of OPCs. Vav3 is known to regulate RhoA, Rac1 and RhoG activity and is therefore a promising candidate with regard to a regulatory role concerning the rearrangement of the cytoskeleton. Our study focused on the Vav3 knockout mouse and revealed an enhanced migration capacity of Vav3 -/- OPCs on the extracellular matrix (ECM) glycoprotein tenascin-C (TnC). The migration behavior of individual OPCs on further ECM molecules such as laminin-1 (Ln1), laminin-2 (Ln2) and tenascin-R (TnR) was not affected by the elimination of Vav3. The migration process was further investigated with regard to intracellular signal transmission by pharmacological blockade of downstream pathways of specific Rho GTPases. Our data suggest that activation of RhoA GTPase signaling compromises migration, as inhibition of RhoA-signaling promoted migration behavior. This study provides novel insights into the control of OPC migration, which could be useful for further understanding of the complex differentiation and myelination process.

Keywords: Rho GTPase; Vav3; extracellular matrix; glia; laminin; migration; oligodendrocyte precursor cell; tenascin.


Conflict of interest statement

The authors declare that the research was conducted in the absence of any commercial or financial relationships that could be construed as a potential conflict of interest.

Figures
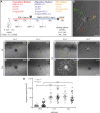
FIGURE 1
FIGURE 1
Generation of oligospheres and migration speed of OPCs on PDL and laminins. (A) Protocol for the generation of OPCs and the migration assay. (B) Representative image of a plated oligosphere with tracked cells and their individual traces. (C + C′) Plated Vav3-expressing (Vav3 +/+) and Vav3-deficient (Vav3 −/−) oligospheres on PDL substrate (control) at timepoint 0 h. (D + D′) Plated oligospheres of either genotype on PDL after 24 h of migration time. (E + E′) Oligospheres of either genotype on laminin-1 (Ln1) substrate after 24 h of migration. (F + F′) Both genotypes of oligospheres plated on laminin-2 (Ln2) after 24 h of migration. (G) The quantification of migration speed [in µm/h] revealed no genotype-dependent effect of OPCs on different substrates but indicated a significantly increased migration velocity of OPCs on laminins compared to the control PDL. Data are expressed as mean ± SEM. Single values are depicted as data points. ANOVA was performed and depending on normal distribution of values, Bonferroni post test or Kruskal–Wallis and Dunn’s post test followed (***p ≤ 0.001). PDL: N = 10, n = 50; laminins: N = 5, n = 25. Scale: 200 µm.
FIGURE 2
FIGURE 2
Migration of OPCs from oligospheres on PDL and laminins. (A + A′) Vav3-expressing (Vav3 +/+) and Vav3-deficient (Vav3 −/−) oligospheres on PDL after 24 h of migration. (B + B′) Successful migration of OPCs from oligospheres of either genotype on laminin-1 (Ln1) after 24 h. (C + C′) Migration success of OPCs from Vav3 +/+ and Vav3 −/− oligospheres on laminin-2 (Ln2) after 24 h. (D) The quantification of halo distance [in µm] revealed that OPCs on laminins covered significantly longer distances compared to the OPCs on the control substrate. (E) The quantification of total cell numbers (#) migrating on the different substrates again demonstrated a significantly higher number of moving OPCs on laminins compared to the control. Data is expressed as mean ± SEM. Student’s t-test was performed (***p ≤ 0.001). N = 5, n = 5. Scale: 200 µm.
FIGURE 3
FIGURE 3
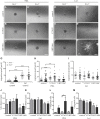
Effect of inhibited Rho GTPase signaling on OPC migration on PDL and laminin-1. (A + A′) Control condition of oligospheres of either genotype on PDL without treatment (after 24 h). (B + B′) Blockage of ROCK by treatment with Y27632 inhibitor in oligospheres of both genotypes on PDL after 24 h. (C + C′) Blockage of Rac1 by treatment with EHT 1864 inhibitor in oligospheres of both genotypes on PDL after 24 h. (D + D′) Control condition of oligospheres of either genotype on Ln1 without treatment (after 24 h). (E + E′) Blockage of ROCK by treatment with Y27632 inhibitor in oligospheres of both genotypes on Ln1 after 24 h. (F + F′) Blockage of Rac1 by treatment with EHT 1864 inhibitor in oligospheres of both genotypes on Ln1 after 24 h. (G) Quantified migration speed of PDL and Ln1 control conditions without treatment. Significantly impaired migration speed was observed on PDL compared to Ln1 in both genotypes. (H) The quantification of the migration speed of OPCs from oligospheres of either genotype on PDL indicated a RhoA-related migration behavior, independent of Vav3. (I) The quantification of migration speed of OPCs from oligospheres of either genotype on Ln1 indicated a very mild involvement of Rac1, as migration speed was not heavily affected by Rac1 inhibition. (J) The halo distance slightly supported a restrained involvement of RhoA in migration behavior of OPCs of either genotype on PDL. Inhibition of Rac1 caused a decreased halo distance that was statistically not significant. (K) The halo distance of OPCs of either genotype supported the involvement of Rac1 in migration behavior. Although the changes were not statistically significant. (L) The number of migrated cells (#) on PDL demonstrated low numbers in Vav3 +/+ OPC cultures. In comparison the numbers of migrated Vav3 −/− cells were increased in every condition, with a significant effect after ROCK inhibition. (M) The number of migrated cells (#) on Ln1 revealed a slight, non-significant decrease after EHT 1864 treatment, again supporting the observation of an influence of Rac1 in migration behavior of OPCs of either genotype on Ln1. Most effects seen were independent from the Vav3 genotype. Data are expressed as mean ± SEM. ANOVA was performed and depending on normal distribution of values, Bonferroni post test or Kruskal–Wallis and Dunn’s post test followed. Additionally, Student’s t-test was performed for halos and cell numbers. *p ≤ 0.05, ** 0.01 ≥ p ≥ 0.001, ***p ≤ 0.001. Migration assay: PDL control N = 10, n = 50, PDL and Ln1 N = 5, n = 25; halos and cell numbers: N = 5, n = 5. Scale: 200 µm.
FIGURE 4
FIGURE 4
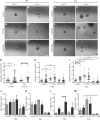
Migration speed of OPCs from oligospheres on PDL and tenascins. (A + A′) Plated Vav3-expressing (Vav3 +/+) and Vav3-deficient (Vav3 −/−) oligospheres on PDL substrate (control) at timepoint 0 h. (B + B′) Plated oligospheres of either genotype on PDL after 24 h of migration time. (C + C′) Oligospheres of either genotype on tenascin-C (TnC) substrate after 24 h of migration. (D + D′) Oligospheres of both genotypes plated on tenascin-R (TnR) after 24 h of migration. (E) The quantification of migration speed [in µm/h] revealed not only significantly increased migration velocities on tenascins compared to PDL, but also a significant, Vav3-dependent effect on TnC: Vav3 −/− OPCs migrated significantly faster than Vav3 +/+ OPCs. Data are expressed as mean ± SEM. Single values are depicted as data points. ANOVA was performed and depending on normal distribution of values, Bonferroni post test or Kruskal–Wallis and Dunn’s post test followed (***p ≤ 0.001; ** 0.01 ≥ p ≥ 0.001; *p ≤ 0.05). PDL: N = 10, n = 50; tenascins: N = 5, n = 25. Scale: 200 µm.
FIGURE 5
FIGURE 5
Migration of OPCs from oligospheres on PDL and tenascins. (A + A′) Vav3-expressing (Vav3 +/+) and Vav3-deficient (Vav3 −/−) oligospheres on PDL after 24 h of migration. (B + B′) Migration success of OPCs from oligospheres of either genotype on tenascin-C (TnC) after 24 h. (C + C′) Migration success of OPCs from Vav3 +/+ and Vav3 −/− oligospheres on tenascin-R (TnR) after 24 h. (D) The quantification of halo distance [in µm] revealed that OPCs on tenascins covered similar distances as OPCs on PDL. (E) The quantification of total cell numbers (#) migrating on the different substrates again demonstrated similar numbers of moving OPCs on tenascins compared to the control. Data are expressed as mean ± SEM. Student’s t-test was performed. N = 5, n = 5. Scale: 200 µm.
FIGURE 6
FIGURE 6
Effect of inhibited Rho GTPase signaling on OPC migration on PDL and tenascins. (A + A′) Control condition of oligospheres of either genotype on PDL without treatment (after 24 h). (B + B′) Blockage of ROCK by treating oligospheres of both genotypes on PDL with the inhibitor Y27632 after 24 h. (C + C′) Blockage of Rac1 by a treatment of oligospheres of both genotypes on PDL with the inhibitor EHT 1864 after 24 h. (D + D′) Control condition of oligospheres of either genotype on TnC without treatment (after 24 h). (E + E′) Blockage of ROCK by a treatment of oligospheres on TnC with the inhibitor Y27632 after 24 h. (F + F′) Blockage of Rac1 by treating oligospheres of both genotypes on TnC with the inhibitor EHT 1864 after 24 h. (G) Quantified migration speed of PDL and TnC control conditions without treatment. A significantly lower migration speed was observed for Vav3 +/+ OPCs compared to Vav3 −/− on TnC, whereas velocities on PDL compared to TnC were similar in general. (H) The quantification of the migration speed of OPCs indicated a RhoA related migration behavior on PDL, with significantly higher velocities seen after ROCK inhibition in both genotypes. (I) The quantification of the migration speed of OPCs from oligospheres of either genotype on TnC indicated a strong Rac1-dependent and also RhoA-related migration speed. (J) The halo distance slightly supported a restrained involvement of RhoA in migration behavior of OPCs of either genotype on PDL. Inhibition of Rac1 caused a decreased halo distance that was statistically not significant. (K) The halo distance of OPCs of either genotype supported the involvement of Rac1 in migration behavior on TnC. Also here the effect was not statistically significant. (L) The number of migrated cells (#) on PDL demonstrated low numbers of migrated Vav3 +/+ OPCs. In comparison, the numbers of migrated Vav3 −/− cells were increased in every condition, with a significant difference between both genotypes after ROCK inhibition. (M) The number of migrated cells (#) on TnC revealed a strong decrease after EHT 1864 treatment, again supporting the observation of an influence of Rac1 on migration behavior of OPCs of either genotype on TnC. Data are expressed as mean ± SEM. ANOVA was performed and depending on normal distribution of values, Bonferroni post test or Kruskal–Wallis and Dunn’s post test followed. Additionally, Student’s t-test was performed for halos and cell numbers and additionally for TnC migration speed. *p ≤ 0.05, ** 0.01 ≥ p ≥ 0.001, ***p ≤ 0.001. Migration assay: PDL control N = 10, n = 50, PDL and Ln1 N = 5, n = 25; halos and cell numbers: N = 5, n = 5. Scale: 200 µm.

Similar articles

Cited by

References

    1. Aoki K., Nakamura T., Fujikawa K., Matsuda M. (2005). Local phosphatidylinositol 3, 4, 5-trisphosphate accumulation recruits Vav2 and Vav3 to activate Rac1/Cdc42 and initiate neurite outgrowth in nerve growth factor-stimulated PC12 cells. Mol. Biol. Cell 16 (5), 2207–2217. 10.1091/mbc.E04-10-0904 - DOI - PMC - PubMed
    1. Barateiro A., Fernandes A. (2014). Temporal oligodendrocyte lineage progression: In vitro models of proliferation, differentiation and myelination. Biochim. Biophys. Acta 1843 (9), 1917–1929. 10.1016/j.bbamcr.2014.04.018 - DOI - PubMed
    1. Bartsch U., Faissner A., Trotter J., Dörries U., Bartsch S., Mohajeri H., et al. (1994). Tenascin demarcates the boundary between the myelinated and nonmyelinated part of retinal ganglion cell axons in the developing and adult mouse. J. Neurosci. 14 (8), 4756–4768. 10.1523/jneurosci.14-08-04756.1994 - DOI - PMC - PubMed
    1. Bauch J., Vom Ort S., Ulc A., Faissner A. (2022). Tenascins interfere with remyelination in an ex vivo cerebellar explant model of demyelination. Front. Cell Dev. Biol. 10, 819967. 10.3389/fcell.2022.819967 - DOI - PMC - PubMed
    1. Bergles D. E., Richardson W. D. (2016). Oligodendrocyte development and plasticity. Cold Spring Harb. Perspect. Biol. 8 (2), a020453. 10.1101/cshperspect.a020453 - DOI - PMC - PubMed