. 2022 Dec 2:12:981827.
doi: 10.3389/fcimb.2022.981827. eCollection 2022.

Persistence of Mycobacterium tuberculosis in response to infection burden and host-induced stressors

Affiliations

Persistence of Mycobacterium tuberculosis in response to infection burden and host-induced stressors

Trisha Parbhoo et al. Front Cell Infect Microbiol. .

Abstract

Introduction: As infection with Mycobacterium tuberculosis progresses, the bacilli experience various degrees of host stressors in the macrophage phagosome such as low pH, nutrient deprivation, or exposure to toxic agents, which promotes cell-to-cell phenotypic variation. This includes a physiologically viable but non- or slowly replicating persister subpopulation, which is characterised by a loss of growth on solid media, while remaining metabolically active. Persisters additionally evade the host immune response and macrophage antimicrobial processes by adapting their metabolic pathways to maintain survival and persistence in the host.

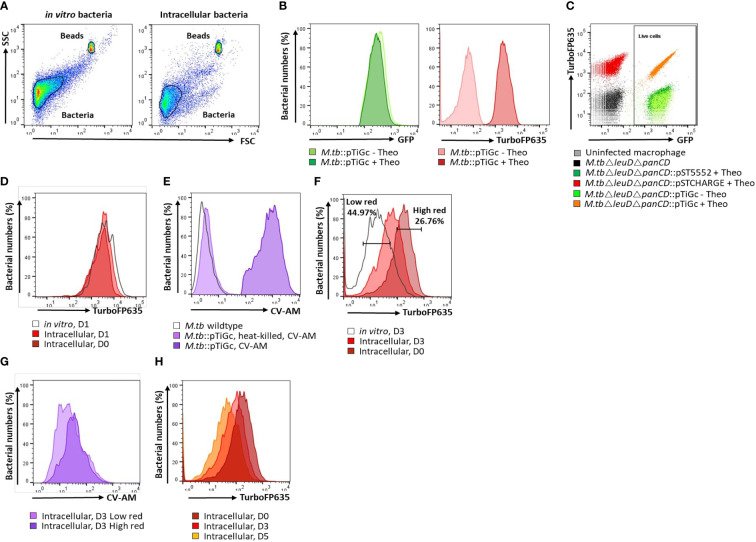
Methods: A flow cytometry-based dual-fluorescent replication reporter assay, termed fluorescence dilution, provided a culture-independent method to characterize the single-cell replication dynamics of M. tuberculosis persisters following macrophage infection. Fluorescence dilution in combination with reference counting beads and a metabolic esterase reactive probe, calcein violet AM, provided an effective approach to enumerate and characterize the phenotypic heterogeneity within M. tuberculosis following macrophage infection.

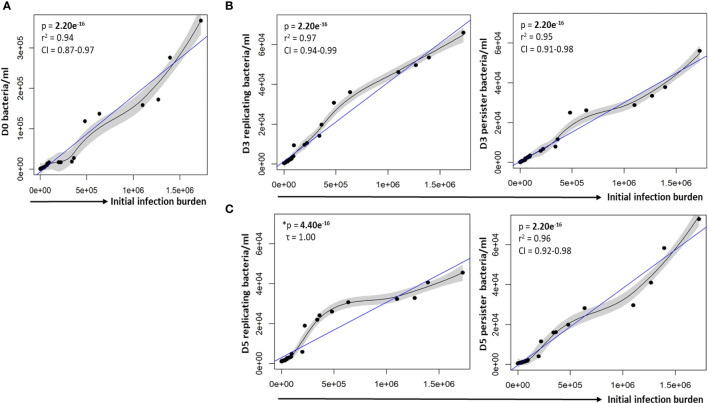
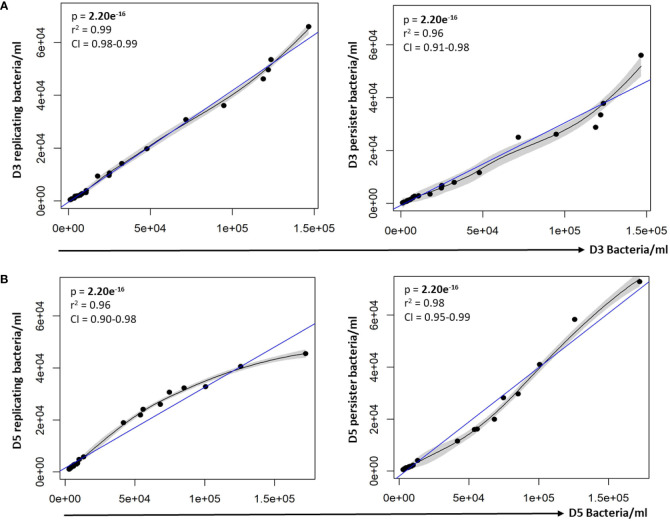
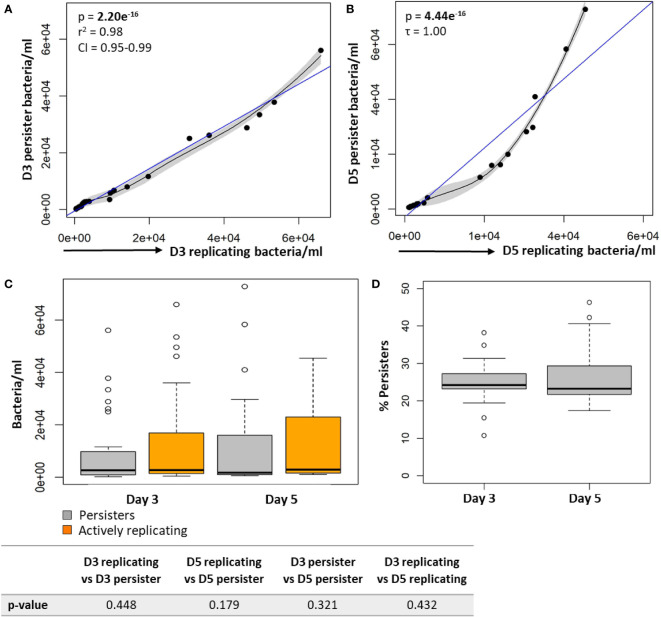
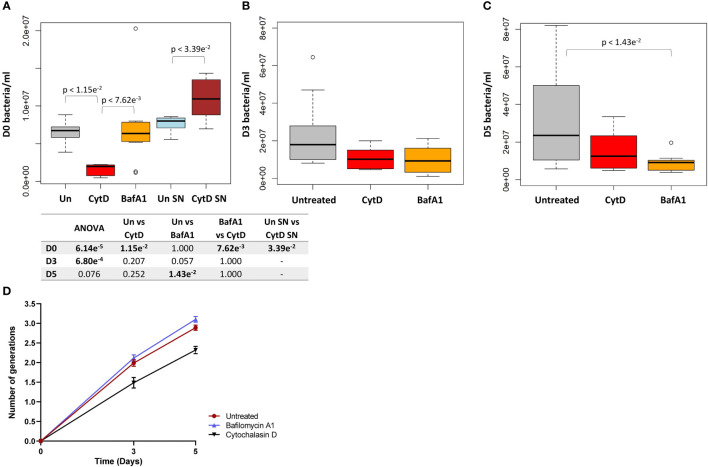
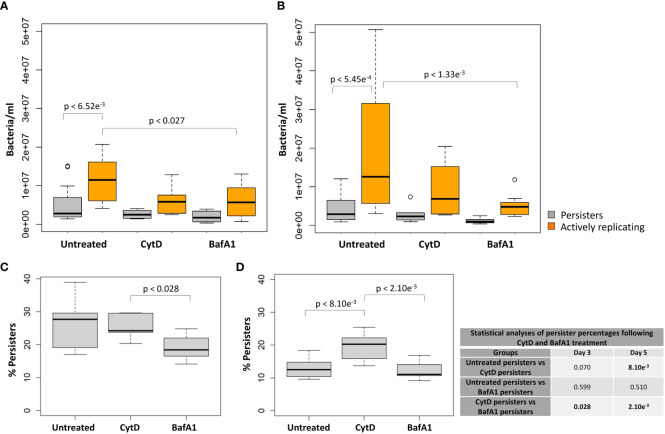
Results: Persister formation appeared dependent on the initial infection burden and intracellular bacterial burden. However, inhibition of phagocytosis by cytochalasin D treatment resulted in a significantly higher median percentage of persisters compared to inhibition of phagosome acidification by bafilomycin A1 treatment.

Discussion: Our results suggest that different host factors differentially impact the intracellular bacterial burden, adaptive mechanisms and entry into persistence in macrophages.

Keywords: Mycobacterium tuberculosis; bacterial heterogeneity; host-pathogen interaction; persistence; persisters; phagocytosis; phagosome acidification.


Conflict of interest statement

The authors declare that the research was conducted in the absence of any commercial or financial relationships that could be construed as a potential conflict of interest.

Figures

Figure 1
Figure 1
Flow cytometry gating strategy. (A) A primary gate was applied to the bacterial population according to forward scatter (FSC) and side scatter (SSC) properties. For cell enumeration, a secondary gate was applied to the non-fluorescent bead population. (B) M. tuberculosisΔleuDΔpanCD::pTiGc was cultured in the presence of 4 mM theophylline to allow induction of the riboswitch-based promoter for expression of TurboFP635. Constitutive expression of GFP is observed, whilst fluorescence of TurboFP635 is observed following induction with theophylline. (C) Selecting on the bacterial population, a rectangle gate was created to select for live cells, according to their GFP positivity. Single colour controls ensured optimal voltage settings for positive fluorescence of GFP (pST5552) and TurboFP635 (pSTCHARGE), above that of the autofluorescence of unstained cells. (D) The fluorescence dilution technique allows monitoring of bacterial replication for 5 generations. To improve detection of the fluorescent signal to allow measurement over 5 days, theophylline, was retained in culture for 24 hours. Bacterial replication could thus effectively be monitored from day 2 onwards since the fluorescent signal remained stable in vitro and intracellularly between day 0 and day 1. (E) Following harvesting of intracellular bacteria, cells were stained with CV-AM for analyses of metabolic esterase activity. CV-AM is a non-polar, cell permeable fluorogenic probe that is rapidly hydrolysed to a polar, fluorescent compound by intracellular esterases of live cells. Dead cells no longer possess esterase activity, and will thus not convert to the fluorescent calcein, whilst calcein is stably retained in live cells. (F) Selecting on the live cells population, dilution of the TurboFP635 fluorescent signal provided an indication of bacterial replication following removal of the inducer, theophylline (Theo). The high red gate was created based on maximum TurboFP635 fluorescence observed at D0 using the range tool and used to detect mycobacteria that retain their TurboFP635 fluorescence from later time points (D3 and D5), representing slow or non-growing bacteria. The low TurboFP635 gate was created to distinguish replicating intracellular bacteria, as visually assessed when overlayed with in vitro day 3 or day 5 bacteria. (G) Selecting on the high and low TurboFP635 subpopulations, the esterase activity of intracellular bacteria was assessed by overlaying on a histogram plot. (H) Fluorescence dilution of the TurboFP635 signal over time. The geometric median fluorescent intensity (MFI) of TurboFP635 enabled determination of the number of bacterial generations during infection. CV-AM, calcein violet AM.
Figure 2
Figure 2
Correlation between the infection burden and growth of intracellular bacteria. (A) Macrophages were infected with varying bacterial burdens. Cell enumeration using reference counting beads was used to establish the correlation between the initial infection burden (D0 in vitro bacteria/ml) and intracellular bacteria following uptake. Significant positive correlations between the initial infection burden and actively replicating bacteria or persisters was observed at (B) day 3 and (C) day 5. Data was assessed using the Pearson’s product-moment correlation (linear) and is representative of data independently conducted in 7 biological experiments, including technical triplicates. *The Kendall’s Tau correlation was used to determine the non-linear correlation coefficient tau (τ). Significant p-values (p < 0.05) are shown in bold. The blue line represents the regression line for the correlation analyses (Pearson and Kendall), while the black line and associated shaded area represents the local non-linear regression and 95% confidence interval. r2, Pearson’s correlation coefficient squared; CI, 95% confidence interval; SEM, standard error of mean.
Figure 3
Figure 3
Persister numbers correlated with respective intracellular bacterial numbers. A strong correlation between the infection burden observed at (A) day 3 and (B) day 5 in relation to the respective persister numbers was observed on the scatter plot. Data was assessed using the Pearson’s product-moment correlation (linear) and is representative of data independently conducted in 7 biological experiments, including technical triplicates. Significant p-values (p < 0.05) are shown in bold. The blue line represents the regression line for the correlation analyses (Pearson), while the black line and associated shaded area represents the local non-linear regression and 95% confidence interval. r2, Pearson’s correlation coefficient squared; CI, 95% confidence interval.
Figure 4
Figure 4
Persister numbers correlated with the number of intracellular growing mycobacteria in macrophages. Significant positive correlations were observed between actively replicating bacteria and respective persister numbers at (A) day 3 and (B) day 5. (C) No significant difference between bacterial numbers was observed between day 3 and day 5 (Wilcoxon test). (D) The median percentage of persisters in relation to the respective intracellular bacterial numbers was assessed. No significant differences in the median percentage of persisters between days 3 and 5 was observed (p = 0.784; Wilcoxon test). Correlations were assessed using the Pearson’s product-moment (linear), or Kendall’s Tau correlation (non-linear). The blue line represents the regression line for the correlation analyses (Pearson and Kendall), while the black line and associated shaded area represents the local non-linear regression and 95% confidence interval. Box and whisker plots express distribution of data, indicating the median (bold line), interquartile range (box), and range (whiskers). The data was independently conducted in 7 biological experiments, including technical triplicates. Significant p-values (p < 0.05) are shown in bold. r2, Pearson’s correlation coefficient squared; CI, 95% confidence interval; τ, Tau correlation coefficient.
Figure 5
Figure 5
Intracellular bacterial growth following treatment with inhibitors of phagocytosis and phagosome acidification. Macrophages were either untreated or pre-treated with 6 μM CytD or 10 nM BafA1 for 40 min prior to infection with M. tuberculosisΔleuDΔpanCD::pTiGc pre-induced with 4 mM theophylline. (A) Following internalization, macrophages were lysed and intracellular bacteria was harvested for flow cytometry. A 3.42 fold decrease in the median bacterial uptake was detected following CytD treatment compared to untreated macrophages at day 0 (p = 1.15e-2). The supernatant following bacterial uptake displayed significantly increased bacterial numbers following CytD treatment (p = 3.39e-2), confirming inhibition of phagocytosis of M. tuberculosisΔleuDΔpanCD::pTiGc. Uptake of bacteria was unaffected by BafA1 treatment compared to bacterial numbers harvested from untreated macrophages (p = 1.000). The effect of the inhibitors on bacterial growth were assessed at (B) day 3 and (C) day 5 post infection. Bacterial numbers following CytD treatment remained similar to untreated macrophages at day 3 and day 5 (p-values > 0.207), whilst a significant decrease in bacterial numbers following BafA1 treatment was observed at day 5 compared to untreated macrophages (p = 1.43e-2). Box and whisker plots express distribution of data independently conducted in biological triplicate, including technical triplicates, indicating the median (bold line), interquartile range (box), and range (whiskers). Significance testing between groups was assessed by repeated measures ANOVA and pairwise Students t-test with Bonferroni correction; significant p-values (p < 0.05) are shown in bold. (D) The number of intracellular bacterial generations from day 3 to day 5 for untreated (1.989 ± 0.083 to 2.890 ± 0.066), CytD (1.486 ± 0.133 to 2.320 ± 0.093), and BafA1 (2.115 ± 0.082 to 3.103 ± 0.074) increased over time. Despite lower bacterial numbers recorded following CytD treatment, the number of bacterial generations steadily increased, similarly to the untreated and BafA1-treated group. Plots represent data independently conducted in 4 biological experiments, including technical triplicates, indicating mean ± SEM. Un, untreated; SN, supernatant; SEM standard error of mean.
Figure 6
Figure 6
pH calibration of pHrodo Green. (A) Exponentially growing M. tuberculosisΔleuDΔpanCD::pSTCHARGE was labelled with 0.5 mM pHrodo Green, exposed to potassium phosphate buffers ranging between pH 4.5-7.5, and visualized spectrophotometrically. A sigmoidal line of best fit was applied to the graph using GraphPad Prism, generating a pH lookup table to accurately determine the pH ( Supplementary Table 2 ). Results are representative of triplicate samples, displaying geometric mean ± SD, and involved the removal of background fluorescence from unstained cells. (B) Unfixed macrophages infected with unlabelled or pHrodo-labelled M. tuberculosisΔleuDΔpanCD::pSTCHARGE pre-induced with 4 mM theophylline were harvested and exposed for 60 min to pH 4.5 and pH 7.5 potassium phosphate buffers to determine whether a change in intracellular fluorescence could be observed using flow cytometry. The increase in pHrodo MFI reflects the decrease in pH. (C) Macrophages were pre-treated with increasing concentrations of BafA1 40 min prior to infection with pHrodo-labelled M. tuberculosis ΔleuDΔpanCD::pSTCHARGE pre-induced with 4 mM theophylline. Intact macrophages were harvested following internalization and resuspended in HBSS buffer (unfixed) prior to analysis using flow cytometry. Live cells were gated according to TurboFP635 positivity, thereafter pHrodo fluorescence was assessed. Increasing BafA1 concentrations led to a decrease in pH as detected by the decreasing pHrodo MFI. To minimize possible adverse effects associated with higher DMSO concentrations, 10 nM BafA1 was applied to subsequent experiments. Results are representative of data independently conducted in biological triplicate, including technical triplicates. MFI, median fluorescence intensity; RFU, relative fluorescence units.
Figure 7
Figure 7
Macrophage antimicrobial processes impact M. tuberculosis persister formation. The persister subpopulation was visually assessed using flow cytometry at day 3 and day 5. Significant differences between groups was observed at (A) day 3 (p = 0.006) and (B) day 5 (p = 0.034; repeated measures ANOVA). p-values are listed in Table 3 . The median percentage of persisters in relation to the respective intracellular bacterial numbers was assessed at (C) day 3 and (D) day 5. Significance testing between persister percentages was assessed using a pairwise Students t-test (unpaired) with Bonferroni correction; significant p-values (p < 0.05) are shown in bold. Box and whisker plots express distribution of data independently conducted in 4 biological experiments, including technical triplicates, indicating the median (bold line), interquartile range (box), and range (whiskers).
Figure 8
Figure 8
Correlation between the esterase activity of actively replicating bacteria and persisters. The esterase activity of intracellular bacteria was assessed following CV-AM staining and flow cytometric analysis. Significant positive correlations were observed between the esterase activity of actively replicating bacteria and persisters at (A) day 3 and (B) day 5. Data was assessed using the Pearson’s product-moment correlation (linear) and is representative of data independently conducted in 7 biological experiments, including technical triplicates. Significant p-values (p < 0.05) are shown in bold. The blue line represents the regression line for the correlation analyses (Pearson), while the black line and associated shaded area represents the local non-linear regression and 95% confidence interval. r2, Pearson’s correlation coefficient squared; CI, 95% confidence interval; MFI, median fluorescent intensity.
Figure 9
Figure 9
Metabolic esterase activity of persisters is influenced by macrophage antimicrobial processes. The MFI of CV-AM from the actively replicating and persister subpopulations was assessed at day 3 and day 5. No significant differences between groups was observed at (A) day 3 (p = 0.198), (B) whilst significant differences between groups was observed at day 5 (p = 7.35e-8; repeated measures ANOVA). Significance testing between groups is listed in Table 5 and 6. Box and whisker plots express distribution of data independently conducted in 4 biological experiments, including technical triplicates, indicating the median (bold line), interquartile range (box), and range (whiskers). MFI, median fluorescent intensity.

Similar articles

Cited by

References

    1. Balaban N. Q., Helaine S., Lewis K., Ackermann M., Aldridge B., Andersson D. I., et al. . (2019). Definitions and guidelines for research on antibiotic persistence. Nat. Rev. Microbiol. 17, 441–448. doi: 10.1038/s41579-019-0196-3 - DOI - PMC - PubMed
    1. Basu S., Pathak S. K., Banerjee A., Pathak S., Bhattacharyya A., Yang Z., et al. . (2007). Execution of macrophage apoptosis by PE_PGRS33 of mycobacterium tuberculosis is mediated by toll-like receptor 2-dependent release of tumor necrosis factor-α *. J. Biol. Chem. 282, 1039–1050. doi: 10.1074/jbc.M604379200 - DOI - PubMed
    1. Bhaskar A., Chawla M., Mehta M., Parikh P., Chandra P., Bhave D., et al. . (2014). Reengineering redox sensitive GFP to measure mycothiol redox potential of mycobacterium tuberculosis during infection. PloS Pathog. 10, e1003902. doi: 10.1371/journal.ppat.1003902 - DOI - PMC - PubMed
    1. Chengalroyen M. D., Beukes G. M., Gordhan B. G., Streicher E. M., Churchyard G., Hafner R., et al. . (2016). Detection and quantification of differentially culturable tubercle bacteria in sputum from patients with tuberculosis. Am. J. Respir. Crit. Care Med. 194, 1532–1540. doi: 10.1164/rccm.201604-0769OC - DOI - PMC - PubMed
    1. Ding A., Yu H., Yang J., Shi S., Ehrt S. (2005). Induction of macrophage-derived SLPI by mycobacterium tuberculosis depends on TLR2 but not MyD88. Immunology 116, 381–389. doi: 10.1111/j.1365-2567.2005.02238.x - DOI - PMC - PubMed

Publication types