. 2023 Aug;51(4):967-980.
doi: 10.1007/s15010-022-01962-0. Epub 2022 Dec 13.

Tumor necrosis factor-alpha blockade suppresses BK polyomavirus replication

Affiliations

Tumor necrosis factor-alpha blockade suppresses BK polyomavirus replication

Yi-Jung Li et al. Infection. 2023 Aug.

Abstract

Purpose: BK Polyomavirus (BKPyV) infection manifests as renal inflammation and can cause kidney damage. Tumor necrosis factor-α (TNF-α) is increased in renal inflammation and injury. The aim of this study was to investigate the effect of TNF-α blockade on BKPyV infection.

Methods: Urine specimens from 22 patients with BKPyV-associated nephropathy (BKPyVN) and 35 non-BKPyVN kidney transplant recipients were analyzed.

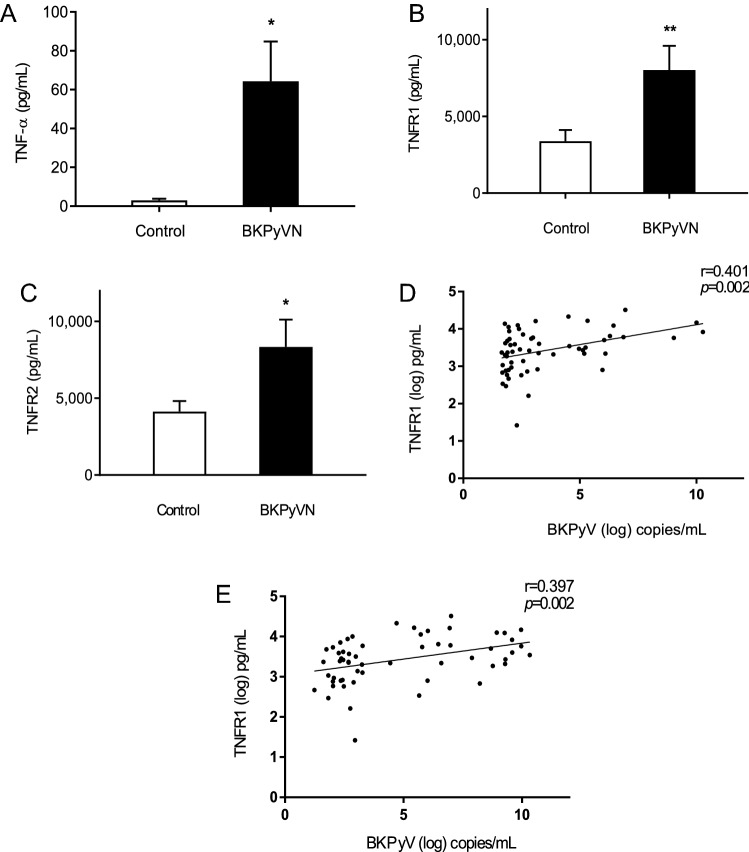
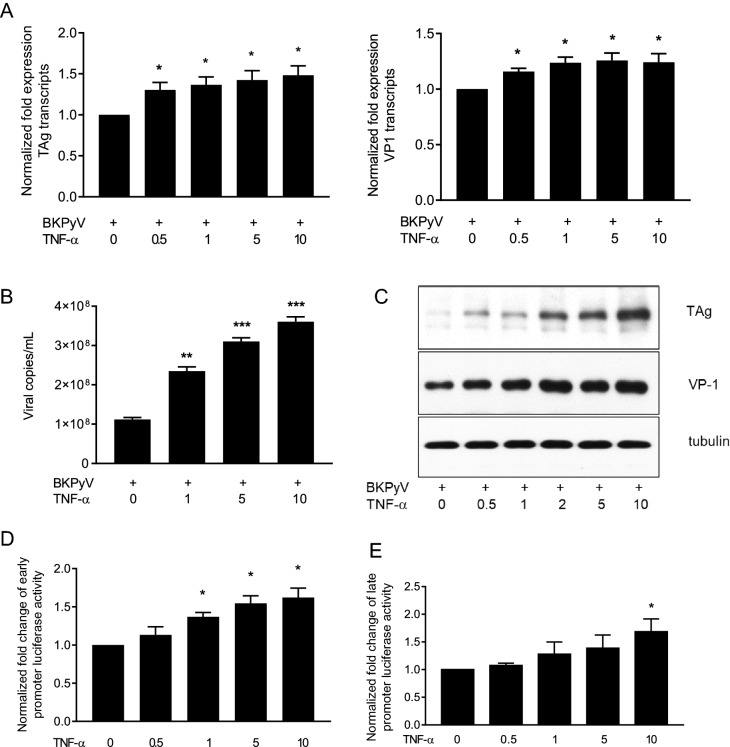
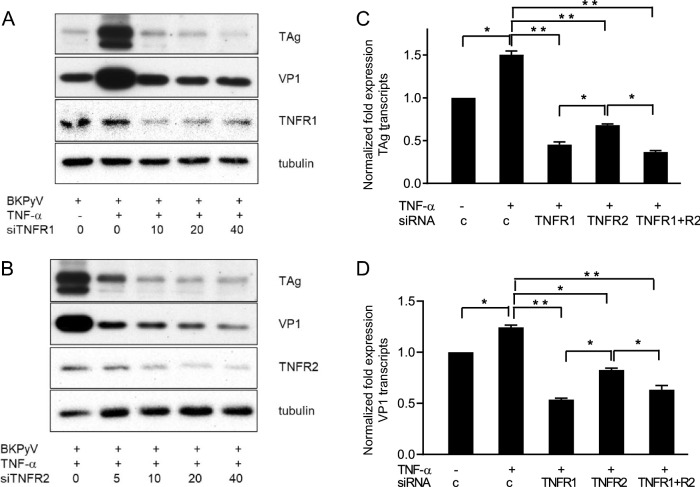
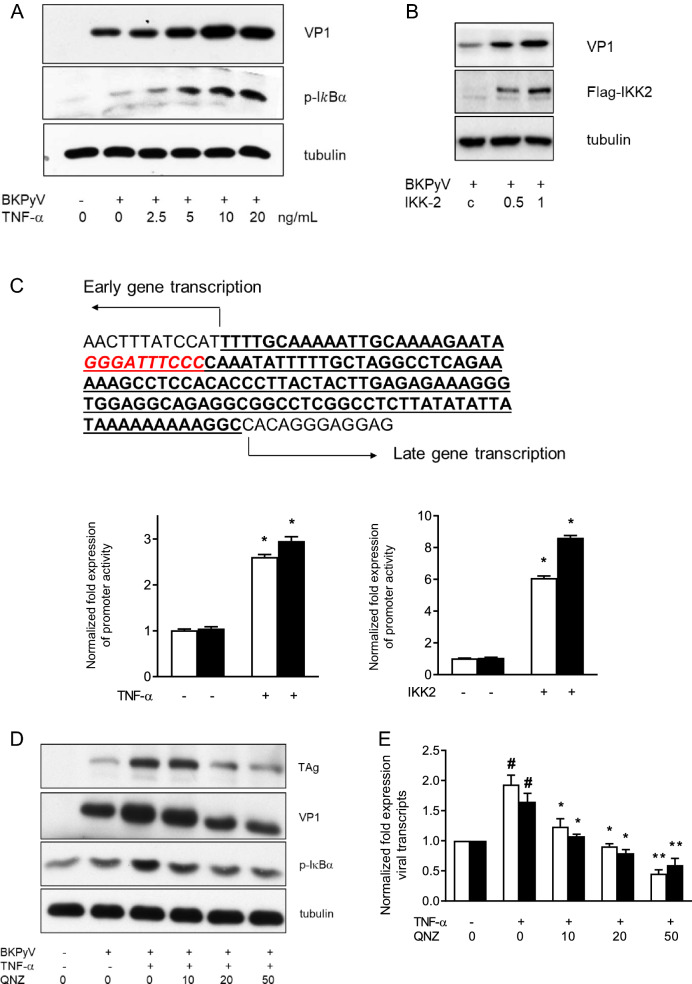
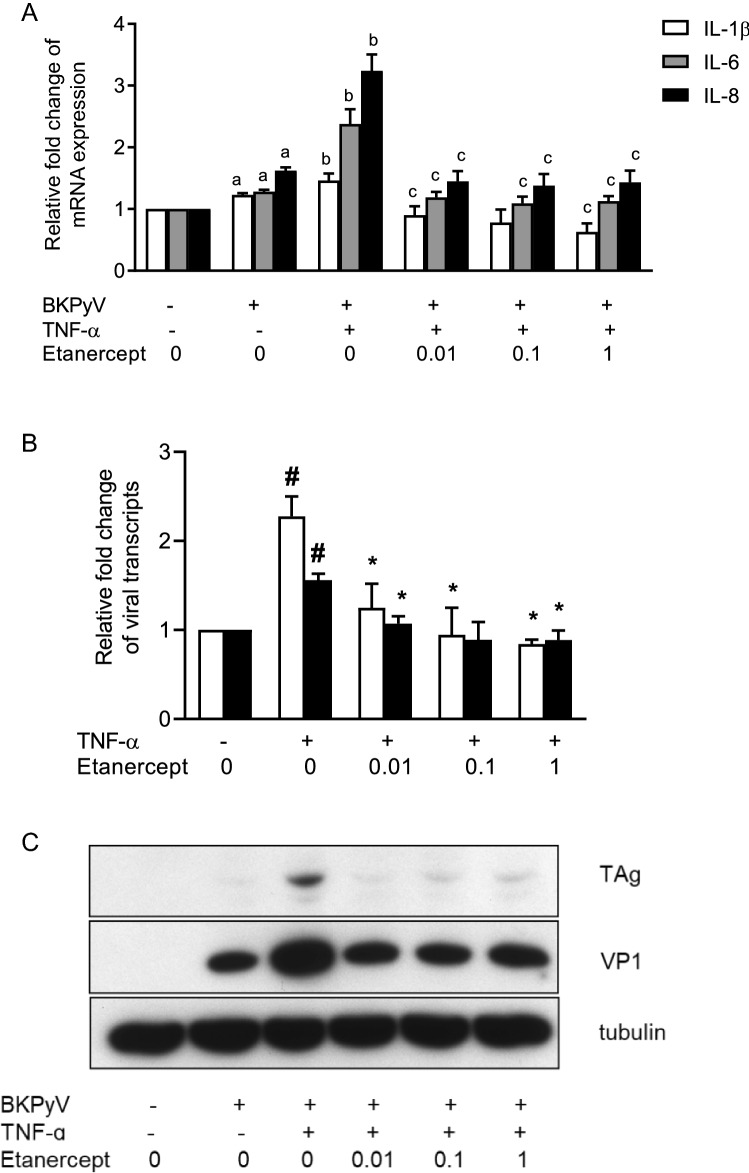
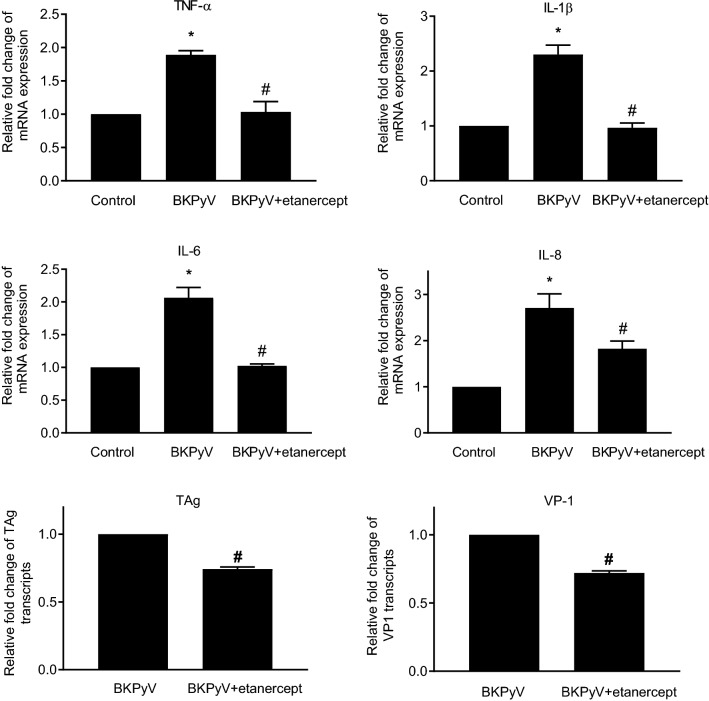
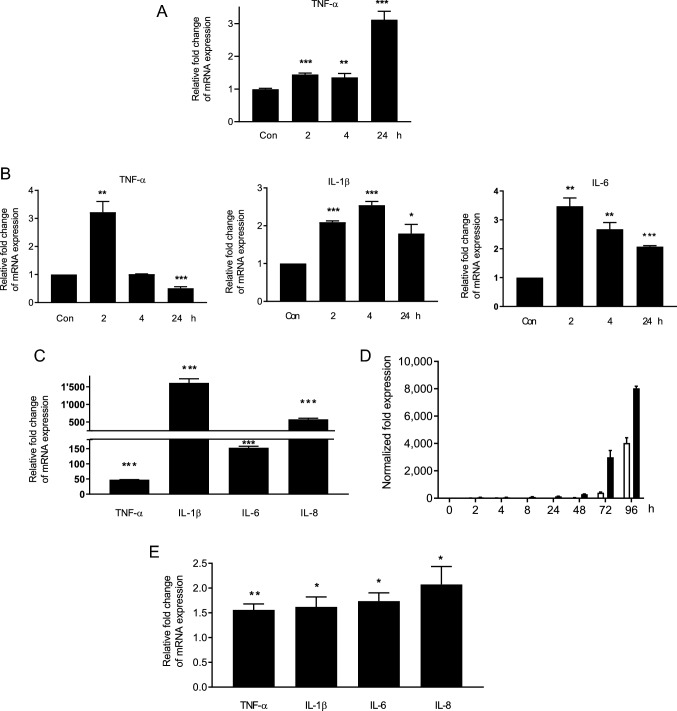
Results: We demonstrated increased urinary levels of TNF-α and its receptors, TNFR1 and TNFR2, in BKPyVN patients. Treating BKPyV-infected human proximal tubular cells (HRPTECs) with TNF-α stimulated the expression of large T antigen and viral capsid protein-1 mRNA and proteins and BKPyV promoter activity. Knockdown of TNFR1 or TNFR2 expression caused a reduction in TNF-α-stimulated viral replication. NF-κB activation induced by overexpression of constitutively active IKK2 significantly increased viral replication and the activity of the BKPyV promoter containing an NF-κB binding site. The addition of a NF-κB inhibitor on BKPyV-infected cells suppressed viral replication. Blockade of TNF-α functionality by etanercept reduced BKPyV-stimulated expression of TNF-α, interleukin-1β (IL-1β), IL-6 and IL-8 and suppressed TNF-α-stimulated viral replication. In cultured HRPTECs and THP-1 cells, BKPyV infection led to increased expression of TNF-α, interleukin-1 β (IL-1β), IL-6 and TNFR1 and TNFR2 but the stimulated magnitude was far less than that induced by poly(I:C). This may suggest that BKPyV-mediated autocrine effect is not a major source of TNFα.

Conclusion: TNF-α stimulates BKPyV replication and inhibition of its signal cascade or functionality attenuates its stimulatory effect. Our study provides a therapeutic anti-BKPyV target.

Keywords: BK polyomavirus; BKPyV-associated nephropathy; Large T antigen; Nuclear factor-κB; Tumor necrosis factor-α.


Conflict of interest statement

All authors declare no conflict of interest. No financial or non-financial interests are directly or indirectly related to the work.

Figures

Fig. 1
Fig. 1
Urinary TNF-α, TNFR1 and TNFR2 levels in kidney transplant recipients with and without BKPyVN treatment. ac Urine specimens from 57 kidney transplant recipients with BKPyVN (n = 22) and without BKPyVN (n = 35) were collected for measurements of TNF-α (a), TNFR1 (b) and TNFR2 (c) concentrations by ELISA. *p < 0.05; **p < 0.01. d Correlations between urinary TNFR1 level (log10) and BKPyV load (log10). e Correlation between urinary TNFR2 level (log10) and BKPyV load (log10)
Fig. 2
Fig. 2
Stimulatory effect of TNF-α on BKPyV replication. a HRPTECs were seeded to 6-well plates (5 × 104 cells/per well) and grown to confluence. Cells were then infected with BKPyV (1 × 106 copies/mL) for 2 h and subsequently incubated in the presence or absence of TNF-α (0.5–10 ng/mL) for 24 h. TAg and VP1 mRNA expression levels were determined by qPCR (n = 3). bd HRPTECs were seeded to 6-well plates (5 × 104 cells/per well) for 1 day, followed by infection with BKPyV (1 × 106 copies/mL) for 2 h and subsequent incubation in the presence or absence of TNF-α as indicated in the figure for 72 h. The viral load in the culture medium (b) was determined as described in the “Materials and methods” (n = 4). TAg and VP1 protein expression levels were assessed by immunoblotting analysis and one of three replicates was shown (c). d, e Cells were transfected with the full-length NCCR-luciferase reporter in early orientation (d) and late orientation (e) overnight followed by the addition of TNF-α (0.5–10 ng/mL) for an additional 24 h. The activity of the BKPyV NCCR reporter was measured by the luciferase assay (n = 4). The fold change of viral transcripts (a) and luciferase activity (d, e) was normalized to the control (no addition of TNF-α) in each experiment. *p < 0.05; **p < 0.01; ***p < 0.001
Fig. 3
Fig. 3
Inhibition of TNF-α-stimulated BKPyV replication by knockdown of TNFR1 and TNFR2 expression. a, b HRPTECs were seeded to 6-well plates (5 × 104 cells/per well) overnight. Cells were then transfected with TNFR1 (a) or TNFR2 (b) siRNA (10–40 nM/mL) for 24 h followed by infection with BKPyV (1 × 106 copies/mL) for 2 h and further incubated in serum-free medium containing TNF-α (10 ng/mL) for 72 h. TAg and VP1 protein expression levels were assessed by Western blot analysis and one of three replicates was shown. C&D. Cells were transfected with TNFR1 (20 nM/mL), TNFR2 (20 nM/mL) or a combination of TNFR1 (20 nM/mL) and TNFR2 (20 nM/mL) for 24 h followed by infection with BKPyV (1 × 106 copies/mL) for 2 h and stimulation with TNF-α (10 ng/mL) for an additional 24 h. TAg (c) and VP1 (d) mRNA expression levels were analyzed by qPCR (n = 3). The fold change of viral transcripts (c, d) was normalized to the control (no addition of TNF-α) in each experiment. *p < 0.05; **p < 0.01
Fig. 4
Fig. 4
Suppression of BKPyV replication by NF-κB inhibition. a HRPTECs were seeded to 6-well plates (5 × 104 cells/per well) overnight and infected with BKPyV (1 × 106 copies/mL), followed by incubation in the presence or absence of TNF-α (2.5–20 ng/mL) for 72 h. VP1 and p-IκB expression levels were determined by Western blot analysis and one of three replicates was shown. b Confluent cells were transfected with a constitutively active IKK2-expressing vector (0.5, 1 μg/mL) or a control vector (1 μg/mL) overnight followed by infection with BKPyV (1 × 106 copies/mL) and incubated for an additional 72 h. VP1 and flag-tagged IKK2 expression levels were assessed by Western blot analysis and one of three replicates was shown (b). c The picture depicts the gene between the start codon of TAg and the origin of replication (Tag-Ori), and the NF-kb binding site is displayed in red color and italicized font. HRPTECs were seeded to 6-well plates (5 × 104 cells/per well) overnight and then cotransfected with the TAg-Ori luciferase reporter vectors (white bar: early orientation; black bar: late orientation) or the control luciferase reporter vector and the Renilla luciferase reporter vector overnight followed by stimulation with TNF-α (10 ng/mL) for additional 24 h. The reporter activity was normalized by the Renilla luciferase activity (n = 4). d, e Cells seeded on 6-well plates (5 × 104 cells/per well) overnight were pretreated with QNZ (10–50 ng/mL) for 2 h followed by infection with BKPyV (1 × 106 copies/mL) and further incubated in the presence or absence of TNF-α (10 ng/mL) for 72 h (d) or 24 h (e). The expression levels of TAg and VP1 proteins were assessed by Western blot analysis and one of three replicates was shown (d). The mRNA expression levels of TAg (white bar) and VP1 (black bar) were assessed by qPCR (n = 4) (e). The fold change of viral transcripts (e) was normalized to the control (no addition of TNF-α and QNA) in each experiment. # indicates TNF-α vs. control p < 0.05. *QNZ vs. TNF-α alone p < 0.05; **QNZ vs. TNF-α alone p < 0.01
Fig. 5
Fig. 5
Inhibition of TNF-α-stimulated inflammatory cytokines and viral replication by TNF-α blockade. HRPTECs were seeded to 6-well plates (5 × 104 cells/per well) and grown to confluence. Cells were infected with BKPyV (1 × 106 copies/mL) followed by incubation in the presence or absence of TNF-α (10 ng/mL) for 24 h, and then, etanercept at doses ranging from 0.01–1 μg/mL was added for an additional 24 h. The mRNA expression levels of IL-1β, IL-6 and IL-8 (a) and of TAg (white bar) and VP1 (black bar) (b) were assessed by qPCR (n = 3). TAg and VP1 protein expression levels were determined by Western blot analysis and one of three replicates was shown (c). The fold change of IL-1β, IL-6 and IL-8 mRNA expressions (a) and viral transcripts (b) was normalized to the control (no addition of TNF-α and etanercept) in each experiment. aBKPyV vs. the non-BKPyV control p < 0.05; bBKPyV vs. BKPyV + TNF-α p < 0.05; cTNF-α + etanercept vs. TNF-α alone p < 0.05, #TNF-α vs. control p < 0.05, and *TNF-α + etanercept vs. TNF-α alone p < 0.05
Fig. 6
Fig. 6
Inhibition of BKPyV-stimulated inflammatory cytokines and viral replication by TNF-α blockade. HRPTECs were seeded to 6-well plates (5 × 104 cells/per well) and grown to confluence. Cells were then infected with BKPyV (1 × 106 copies/mL) for 2 h and cultured in the presence or absence of etanercept (0.1 μg/mL) for an additional 24 h. The mRNA expression levels of IL-1β, IL-6, IL-8, TAg and VP1 were determined by qPCR (n = 3). The fold change of TNF-α, IL-1β, IL-6 and IL-8 mRNA expressions was normalized to the control (no addition of etanercept and no BKPyV infection) in each experiment. The fold change of viral transcripts was normalized to the control (BKPyV infection only). *TNF-α vs. control p < 0.05; #TNF-α + etanercept vs. TNF-α alone p < 0.05
Fig. 7
Fig. 7
Proinflammatory cytokines induced by poly(I:C) or BKPyV infection in THP-1 cells and HRPTECs. a THP-1 cells were seeded to 6-well plates (2 × 105 cells/per well) and grown for 1 day. Cells were then activated by PMA (100 nM) for 24 h and stimulated with 10 μg/mL of poly(I:C) for an additional 24 h. TNF-α mRNA expression was determined by qPCR (n = 3). b Similarly, PMA-activated THP-1 cells were infected with BKPyV (1 × 106 copies/mL) in serum-free medium for 24 h. The control in A&B was PMA-stimulated TPH-1 cells without poly(I:C) stimulation or BKPyV infection in serum-free medium for 24 h (con). The mRNA expression levels of IL-1β, IL-6 and TNF-α were assessed by qPCR (n = 3). The fold change of TNF-α, IL-1β and IL-6 mRNA expressions was normalized to the control [no stimulation with poly(I:C) (a) or no BKPyV infection (b)] in each experiment. ce HRPTECs were seeded to 6-well plates (5 × 104 cells/per well) for 1 day and were then stimulated with 10 μg/mL of poly(I:C) for 24 h (c) or infected with BKPyV (1 × 106 copies/mL) for 96 h (d, e). TAg (white bar) and VP1 (black bar) mRNA expression levels were analyzed by qPCR (n = 3) (d). The folds of mRNA expression levels of TNF-α, IL-1β, IL-6 and IL-8 were normalized to the unstimulated control at 24 h (c, e). *p < 0.05; **p < 0.01; and ***p < 0.001 or less

Similar articles

References

    1. Nickeleit V, Singh HK, Randhawa P, Drachenberg CB, Bhatnagar R, Bracamonte E, et al. The Banff Working Group classification of definitive polyomavirus nephropathy: morphologic definitions and clinical correlations. J Am Soc Nephrol. 2018;29:680–693. doi: 10.1681/ASN.2017050477. - DOI - PMC - PubMed
    1. Hirsch HH, Vincenti F, Friman S, Tuncer M, Citterio F, Wiecek A, et al. Polyomavirus BK replication in de novo kidney transplant patients receiving tacrolimus or cyclosporine: a prospective, randomized, multicenter study. Am J Transplant. 2013;13:136–145. doi: 10.1111/j.1600-6143.2012.04320.x. - DOI - PMC - PubMed
    1. Lamarche C, Orio J, Collette S, Senecal L, Hebert MJ, Renoult E, et al. BK polyomavirus and the transplanted kidney: immunopathology and therapeutic approaches. Transplantation. 2016;100:2276–2287. doi: 10.1097/TP.0000000000001333. - DOI - PMC - PubMed
    1. Li YJ, Wu HH, Chen CH, Wang HH, Chiang YJ, Hsu HH, et al. High incidence and early onset of urinary tract cancers in patients with BK polyomavirus associated nephropathy. Viruses. 2021;13:476. doi: 10.3390/v13030476. - DOI - PMC - PubMed
    1. Kenan DJ, Mieczkowski PA, Latulippe E, Cote I, Singh HK, Nickeleit V. BK polyomavirus genomic integration and large T antigen expression: evolving paradigms in human oncogenesis. Am J Transplant. 2017;17:1674–1680. doi: 10.1111/ajt.14191. - DOI - PubMed

Substances