

Structural mass spectrometry approaches to understand multidrug efflux systems
- PMID: 36504255
- PMCID: PMC10070475
- DOI: 10.1042/EBC20220190
Structural mass spectrometry approaches to understand multidrug efflux systems
Abstract
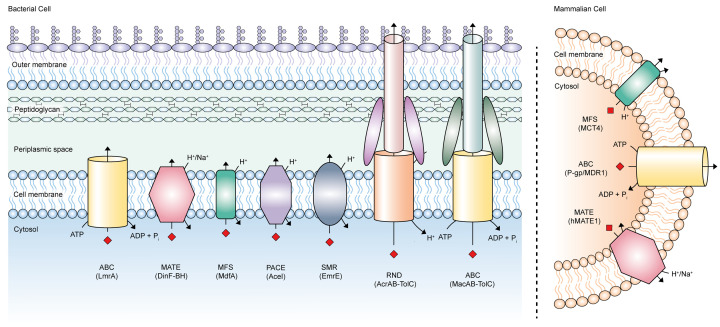
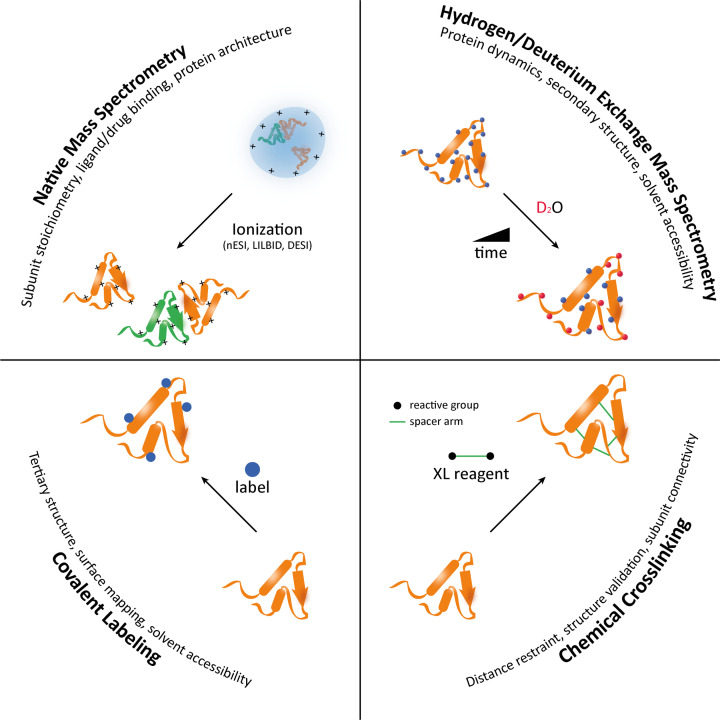
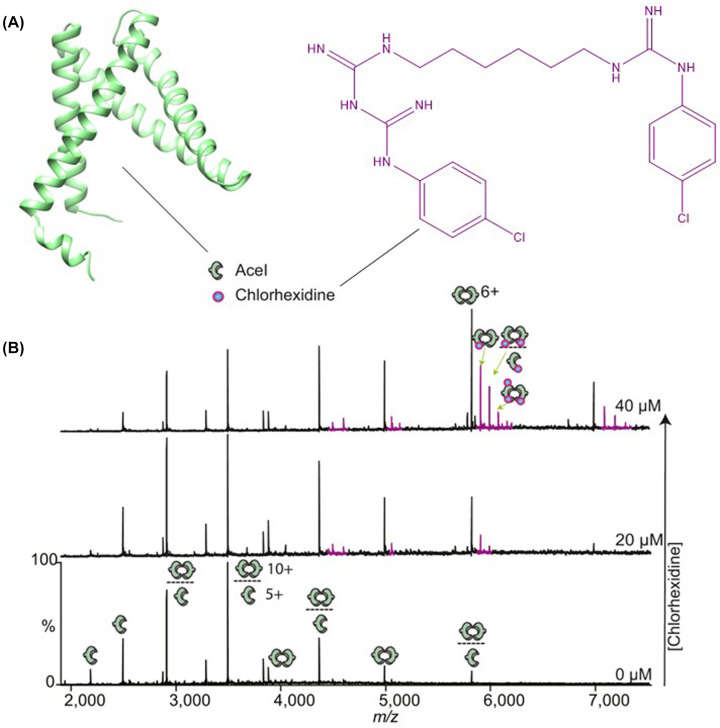
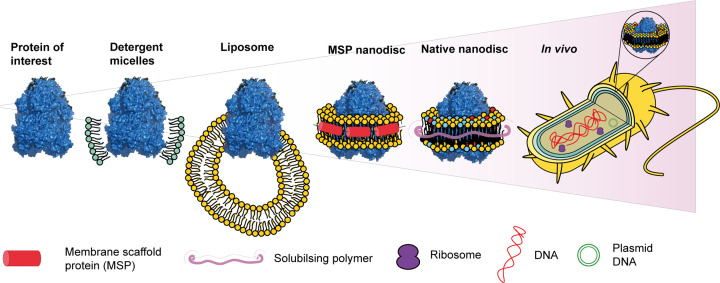
Multidrug efflux pumps are ubiquitous across both eukaryotes and prokaryotes, and have major implications in antimicrobial and multidrug resistance. They reside within cellular membranes and have proven difficult to study owing to their hydrophobic character and relationship with their compositionally complex lipid environment. Advances in structural mass spectrometry (MS) techniques have made it possible to study these systems to elucidate critical information on their structure-function relationships. For example, MS techniques can report on protein structural dynamics, stoichiometry, connectivity, solvent accessibility, and binding interactions with ligands, lipids, and other proteins. This information proving powerful when used in conjunction with complementary structural biology methods and molecular dynamics (MD) simulations. In the present review, aimed at those not experts in MS techniques, we report on the current uses of MS in studying multidrug efflux systems, practical considerations to consider, and the future direction of the field. In the first section, we highlight the importance of studying multidrug efflux proteins, and introduce a range of different MS techniques and explain what information they yield. In the second section, we review recent studies that have utilised MS techniques to study and characterise a range of different multidrug efflux systems.
Keywords: antimicrobial resistance; drug efflux; mass spectrometry; membrane proteins.
© 2023 The Author(s).
Conflict of interest statement
The authors declare that there are no competing interests associated with the manuscript.
Figures


Similar articles
-
An overview of bacterial efflux pumps and computational approaches to study efflux pump inhibitors.Future Med Chem. 2016;8(2):195-210. doi: 10.4155/fmc.15.173. Epub 2016 Jan 29. Future Med Chem. 2016. PMID: 26824720 Review.
-
Perturbed structural dynamics underlie inhibition and altered efflux of the multidrug resistance pump AcrB.Nat Commun. 2020 Nov 4;11(1):5565. doi: 10.1038/s41467-020-19397-2. Nat Commun. 2020. PMID: 33149158 Free PMC article.
-
A Unique Sequence Is Essential for Efficient Multidrug Efflux Function of the MtrD Protein of Neisseria gonorrhoeae.mBio. 2021 Aug 31;12(4):e0167521. doi: 10.1128/mBio.01675-21. Epub 2021 Aug 31. mBio. 2021. PMID: 34465021 Free PMC article.
-
Multidrug Resistance in Neisseria gonorrhoeae: Identification of Functionally Important Residues in the MtrD Efflux Protein.mBio. 2019 Nov 19;10(6):e02277-19. doi: 10.1128/mBio.02277-19. mBio. 2019. PMID: 31744915 Free PMC article.
-
Bacterial Multidrug Efflux Pumps of the Major Facilitator Superfamily as Targets for Modulation.Infect Disord Drug Targets. 2016;16(1):28-43. doi: 10.2174/1871526516666160407113848. Infect Disord Drug Targets. 2016. PMID: 27052334 Review.
Cited by
-
The lipid composition of extracellular vesicles: applications in diagnostics and therapeutic delivery.Front Mol Biosci. 2023 Jul 13;10:1198044. doi: 10.3389/fmolb.2023.1198044. eCollection 2023. Front Mol Biosci. 2023. PMID: 37520326 Free PMC article. Review.
-
A special issue of Essays in Biochemistry on structural mass spectrometry.Essays Biochem. 2023 Mar 29;67(2):147-149. doi: 10.1042/EBC20230006. Essays Biochem. 2023. PMID: 36988080 Free PMC article.
References
-
- Saier M.H., Paulsen I.T., Sliwinski M.K., Pao S.S., Skurray R.A. and Nikaido H. (1998) Evolutionary origins of multidrug and drug-specific efflux pumps in bacteria. FASEB J. 12, 265–274 - PubMed
Publication types
MeSH terms
Substances
Grants and funding
LinkOut - more resources
Full Text Sources
Medical