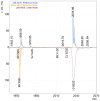
Quantitative Assessment of Serine-8 Phosphorylated β-Amyloid Using MALDI-TOF Mass Spectrometry
- PMID: 36500498
- PMCID: PMC9740911
- DOI: 10.3390/molecules27238406
Quantitative Assessment of Serine-8 Phosphorylated β-Amyloid Using MALDI-TOF Mass Spectrometry
Abstract
The study of the molecular mechanisms of the pathogenesis of Alzheimer's disease (AD) is extremely important for identifying potential therapeutic targets as well as early markers. In this regard, the study of the role of post-translational modifications (PTMs) of β-amyloid (Aβ) peptides is of particular relevance. Serine-8 phosphorylated forms (pSer8-Aβ) have been shown to have an increased aggregation capacity and may reflect the severity of amyloidosis. Here, an approach for quantitative assessment of pSer8-Aβ based on matrix-assisted laser desorption/ionization time-of-flight mass spectrometry (MALDI-TOF MS) is proposed. The relative fraction of pSer8-Aβ was estimated in the total Aβ-pool with a detection limit of 1 fmol for pSer8-Aβ (1-16) and an accuracy of 2% for measurements in the reflectron mode. The sensitivity of the developed method is suitable for determining the proportion of phosphorylated peptides in biological samples.
Keywords: MALDI-TOF; amyloid-beta; phosphopeptide.
Conflict of interest statement
The authors declare no conflict of interest.
Figures


Similar articles
-
Matrix Development for the Detection of Phosphorylated Amyloid-β Peptides by MALDI-TOF-MS.J Am Soc Mass Spectrom. 2023 Mar 1;34(3):505-512. doi: 10.1021/jasms.2c00270. Epub 2023 Jan 27. J Am Soc Mass Spectrom. 2023. PMID: 36706152 Free PMC article.
-
Evaluation of MALDI-TOF/TOF Mass Spectrometry Approach for Quantitative Determination of Aspartate Residue Isomerization in the Amyloid-β Peptide.J Am Soc Mass Spectrom. 2019 Jul;30(7):1325-1329. doi: 10.1007/s13361-019-02199-2. Epub 2019 May 9. J Am Soc Mass Spectrom. 2019. PMID: 31073890
-
Probing amyloid-β pathology in transgenic Alzheimer's disease (tgArcSwe) mice using MALDI imaging mass spectrometry.J Neurochem. 2016 Aug;138(3):469-78. doi: 10.1111/jnc.13645. Epub 2016 May 26. J Neurochem. 2016. PMID: 27115712
-
Mass spectrometric studies of the variety of beta-amyloid proteoforms in Alzheimer's disease.Mass Spectrom Rev. 2022 Mar 28:e21775. doi: 10.1002/mas.21775. Online ahead of print. Mass Spectrom Rev. 2022. PMID: 35347731 Review.
-
Stoichiometry of Heavy Metal Binding to Peptides Involved in Alzheimer's Disease: Mass Spectrometric Evidence.Adv Exp Med Biol. 2019;1140:401-415. doi: 10.1007/978-3-030-15950-4_23. Adv Exp Med Biol. 2019. PMID: 31347061 Review.
Cited by
-
Matrix Development for the Detection of Phosphorylated Amyloid-β Peptides by MALDI-TOF-MS.J Am Soc Mass Spectrom. 2023 Mar 1;34(3):505-512. doi: 10.1021/jasms.2c00270. Epub 2023 Jan 27. J Am Soc Mass Spectrom. 2023. PMID: 36706152 Free PMC article.
-
Enhanced-Precision Measurement of Glutathionyl Hemoglobin by MALDI-ToF MS.Molecules. 2023 Jan 4;28(2):497. doi: 10.3390/molecules28020497. Molecules. 2023. PMID: 36677554 Free PMC article.
References
-
- Zakharova N.V., Kononikhin A.S., Indeykina M.I., Bugrova A.E., Strelnikova P., Pekov S., Kozin S.A., Popov I.A., Mitkevich V., Makarov A.A., et al. Mass Spectrometric Studies of the Variety of Beta-Amyloid Proteoforms in Alzheimer’s Disease. Mass Spectrom. Rev. 2022:e21775. doi: 10.1002/mas.21775. - DOI - PubMed
-
- Kumar S., Rezaei-Ghaleh N., Terwel D., Thal D.R., Richard M., Hoch M., Mc Donald J.M., Wüllner U., Glebov K., Heneka M.T., et al. Extracellular Phosphorylation of the Amyloid β 2-Peptide Promotes Formation of Toxic Aggregates during the Pathogenesis of Alzheimer’s Disease. EMBO J. 2011;30:2255–2265. doi: 10.1038/emboj.2011.138. - DOI - PMC - PubMed
MeSH terms
Substances
Grants and funding
LinkOut - more resources
Full Text Sources
Medical
Miscellaneous

