Review
. 2023 Mar;18(3):700-731.
doi: 10.1038/s41596-022-00780-w. Epub 2022 Dec 9.

High-quality and robust protein quantification in large clinical/pharmaceutical cohorts with IonStar proteomics investigation

Affiliations
Review

High-quality and robust protein quantification in large clinical/pharmaceutical cohorts with IonStar proteomics investigation

Shichen Shen et al. Nat Protoc. 2023 Mar.

Abstract

Robust, reliable quantification of large sample cohorts is often essential for meaningful clinical or pharmaceutical proteomics investigations, but it is technically challenging. When analyzing very large numbers of samples, isotope labeling approaches may suffer from substantial batch effects, and even with label-free methods, it becomes evident that low-abundance proteins are not reliably measured owing to unsufficient reproducibility for quantification. The MS1-based quantitative proteomics pipeline IonStar was designed to address these challenges. IonStar is a label-free approach that takes advantage of the high sensitivity/selectivity attainable by ultrahigh-resolution (UHR)-MS1 acquisition (e.g., 120-240k full width at half maximum at m/z = 200) which is now widely available on ultrahigh-field Orbitrap instruments. By selectively and accurately procuring quantitative features of peptides within precisely defined, very narrow m/z windows corresponding to the UHR-MS1 resolution, the method minimizes co-eluted interferences and substantially enhances signal-to-noise ratio of low-abundance species by decreasing noise level. This feature results in high sensitivity, selectivity, accuracy and precision for quantification of low-abundance proteins, as well as fewer missing data and fewer false positives. This protocol also emphasizes the importance of well-controlled, robust experimental procedures to achieve high-quality quantification across a large cohort. It includes a surfactant cocktail-aided sample preparation procedure that achieves high/reproducible protein/peptide recoveries among many samples, and a trapping nano-liquid chromatography-mass spectrometry strategy for sensitive and reproducible acquisition of UHR-MS1 peptide signal robustly across a large cohort. Data processing and quality evaluation are illustrated using an example dataset ( http://proteomecentral.proteomexchange.org ), and example results from pharmaceutical project and one clinical project (patients with acute respiratory distress syndrome) are shown. The complete IonStar pipeline takes ~1-2 weeks for a sample cohort containing ~50-100 samples.


Figures

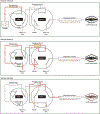
Extended Data Fig. 1 |
Extended Data Fig. 1 |. Graphic scheme of the trapping nano-LC system.
A large-i.d. trapping column (300 μm i.d.) and 65-cm-long, 75 μm i.d. C18 separation column, heated at 50 °C, are connected and operated by a six-port valve. The unique selective trapping-delivery strategy consists of three stages, including sample injection, cleanup and delivery. The red lines and arrows indicate the flow of the peptide sample in each stage.
Extended Data Fig. 2 |
Extended Data Fig. 2 |. Schematic illustration of the IonStar data processing workflow.
The IonStar data processing workflow encompasses the following components: first, generation of precisely defined UHR-MS1 quantitative features with an extremely narrow m/z window; second, accurate assignment of peptide IDs to the quantitative features after peptide/protein identification; third, a stringent post-feature-generation QC procedure to eliminate low-quality quantitative data at both feature and peptide level, followed by aggregation of the data to protein level; finally, a series of postprocessing data analysis tools for assessment of data quality, visualization of the quantitative results, statistical analysis and discovery of significantly changed proteins.
Extended Data Fig. 3 |
Extended Data Fig. 3 |. Quantitative precision and accuracy of proteins uniquely quantified by IonStar and of the lowest 25% abundance.
a, Intragroup CV (i.e., precision) of proteins that are uniquely quantified by IonStar that are of the lowest 25% in abundances. The numbers above the boxplots denote the number of proteins with the lowest 25% abundances that are uniquely quantified by IonStar. b, Relative quantitative errors of protein ratios (i.e., accuracy) of E. coli proteins with the lowest 25% abundance that uniquely quantified by IonStar. The number above the boxplots denotes the number of E. coli proteins uniquely quantified by IonStar and with the lowest 25% abundance.
Fig. 1 |
Fig. 1 |. The scheme of the IonStar protocol.
The protocol emphasizes on the critical importance of well-controlled, robust and reproducible experimental procedures to high-quality quantification in large cohorts. a,b, As good examples, here two straightforward, standardized experimental procedures are provided: a SEPOD protocol achieving efficient and reproducible sample preparation across large cohorts (a) and a trapping nano-LC ultra-high-resolution (UHR) Orbitrap MS system for extensive and sensitive peptide analysis, robustly for large sample sets (b). RPLC, reversed-phase LC. c, The unique data processing pipeline of IonStar also takes advantage of the high sensitivity/selectivity of UHR-MS1 and enables highly reproducible and accurate protein measurement across a large cohort.
Fig. 2 |
Fig. 2 |. IonStar substantially improves the specificity, accuracy and precision for quantification of low-abundance proteins by taking advantage of the high sensitivity and selectivity attainable by UHR-MS1 (e.g., 120–240k FWHM at m/z = 200), which is now widely available on Orbitrap instruments.
IonStar selectively and accurately extracts the quantitative features of peptides within precisely defined, extremely narrow m/z windows that are appropriate to the UHR-MS1 (i.e., inclusion of >95% of target signal), which minimizes interferences from peptides with close m/z. This capacity brings scores of important benefits, including high quantitative sensitivity, selectivity, accuracy and precision for low-abundance proteins, as well as low missing data and low false-positive rates (the ‘experimental data’ is from the 25-sample technical evaluation set, as described in ‘Anticipated results’).
Fig. 3 |
Fig. 3 |. An illustration of the design of LC–MS analysis sequence for a relatively large cohort, using a project containing 80 analytical samples (AS, eight groups, N = 10 biological subjects per group) as the example.
Four types of sample are included in same batch. AS and ENS (to estimate the level of false-positive discovery of changed proteins, optional, detailed in a previous publication specified in text) are divided into ten blocks (‘block number’ represents number of biological replicates per group); within each block, one AS from each group was randomly selected. The sample sequence is further randomized within each block. QS are analyzed once every two blocks (18 LC–MS runs). BS are analyzed at the beginning and end of the sequence. Description of the types of sample is provided in Box 2.
Fig. 4 |
Fig. 4 |. Performance evaluation of proteomic quantification by IonStar and several popular label-free quantitative approaches.
a, An example of the Pearson correlation plots of protein intensities quantified in two randomly selected LC–MS replicate runs of the same sample. IonStar achieved more in-depth proteome coverage and substantially better quantitative reproducibility, especially for proteins with the lowest 25% intensities. b, Heatmaps of protein intensities quantified in the 25-sample technical evaluation sample set (five groups, five LC–MS technical replicates per group). In this case, missing data arise only from technical reasons. A substantially lower level of missing data was observed by IonStar compared with other methods.
Fig. 5 |
Fig. 5 |. Comparison of the quantitative accuracy, precision and discovery of significantly different proteins for proteins with the lowest 25% abundances by IonStar (IS) and several popular label-free quantitative approaches, including spectral counting (SpC, NSAF), the newest version of MaxQuant (MQ) and PEAKS (PK) using the 25-sample, mixed-proteome benchmark set (N = 5 per group, five groups).
a, Intragroup CV (i.e., precision) of protein intensities in the five groups. The numbers above the boxplots denote the total number of low-abundance proteins quantified by each method. b, Relative quantitative errors (i.e., accuracy) of protein ratios (i.e., B/A, C/A, D/A and E/A) for low-abundance proteins. The numbers above the boxplots denote the total number of low-abundance E. coli proteins quantified by each method. Boxes show 25th to 75th percentile range with the median indicated by a horizontal line. Whiskers extend to the 5th and 95th percentile range. c, The number of significantly changed low-abundance E. coli proteins (i.e., correctly identified TPs) discovered by each method.
Fig. 6 |
Fig. 6 |. Comparison of quantitative accuracy, precision and discovery of TPs for all proteins by IonStar (IS) and several popular label-free quantitative approaches, including spectral counting (SpC, NSAF), MaxQuant (MQ) and PEAKS (PK).
a, Intragroup CV (i.e., precision) of protein intensities in the five groups. The numbers above the boxplots denote the total number of proteins quantified by each method. b, Relative quantitative errors (i.e., accuracy) of the ratios of protein quantitative values between two groups (i.e., B/A, C/A, D/A and E/A). The numbers above the boxplots denote the total number of E. coli proteins quantified by each method. Boxes show 25th to 75th percentile range with the median indicated by a horizontal line. Whiskers extend to the 5th and 95th percentile range. c, The number of significantly changed E. coli proteins (i.e., correctly identified TPs) discovered in each method.
Fig. 7 |
Fig. 7 |. Application of IonStar in one preclinical project involving 100 rat brain tissue samples.
a, Volcano plots of protein ratios and two-sided Student t-test P values between different disease/treatment conditions and healthy control.Four different disease/treatment conditions were involved in the study, including disease severity I (Dis. I), disease severity II (Dis. II), Dis. II with treatment A (Dis. II + Tr. A) and Dis. II with treatment B (Dis. II + Tr. B). b, Intensity heatmap of the >7,000 proteins quantified in the 100 rat brain tissue samples. Region- and disease/treatment-specific proteomic patterns were revealed by the application of IonStar. b adapted with permission from ref. .
Fig. 8 |
Fig. 8 |. Application of IonStar in one clinical project involving serum samples from 60 human subjects with ARDS.
a, The total percentage of serum proteins quantified with no missing data in the 60 human serum samples. b, Intragroup CV levels of LC–MS replicates, MARS14 depletion replicates and in 60 clinical samples. Excellent LC–MS reproducibility was achieved by IonStar. c, Gene Ontology (GO) analysis of proteins quantified in the 60 human serum samples. Distinct GO biological process terms were enriched from proteins with different abundance.

Similar articles

Cited by

References

    1. Wang X, Shen S, Rasam SS & Qu J. MS1 ion current-based quantitative proteomics: a promising solution for reliable analysis of large biological cohorts. Mass Spectrom. Rev. 38, 461–482 (2019). - PMC - PubMed
    1. Rifai N, Gillette MA & Carr SA Protein biomarker discovery and validation: the long and uncertain path to clinical utility. Nat. Biotechnol. 24, 971–983 (2006). - PubMed
    1. Mallick P. & Kuster B. Proteomics: a pragmatic perspective. Nat. Biotechnol. 28, 695–709 (2010). - PubMed
    1. Overmyer KA et al. Large-scale multi-omic analysis of COVID-19 severity. Cell Syst. 12, 23–40 (2021). - PMC - PubMed
    1. Shen B. et al. Proteomic and metabolomic characterization of COVID-19 patient sera. Cell 182, 59–72. e15 (2020). - PMC - PubMed

Publication types