. 2022 Oct 31:12:998907.
doi: 10.3389/fonc.2022.998907. eCollection 2022.

Consequences of somatic mutations of GIRK1 detected in primary malign tumors on expression and function of G-protein activated, inwardly rectifying, K+ channels

Affiliations

Consequences of somatic mutations of GIRK1 detected in primary malign tumors on expression and function of G-protein activated, inwardly rectifying, K+ channels

Brigitte Pelzmann et al. Front Oncol. .

Abstract

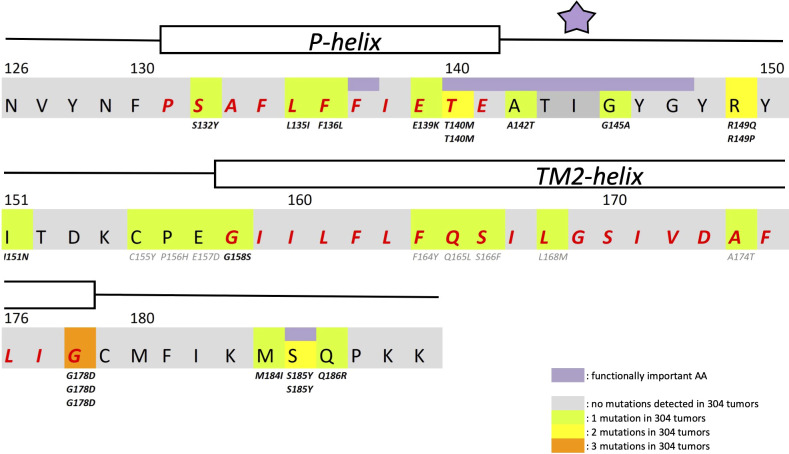
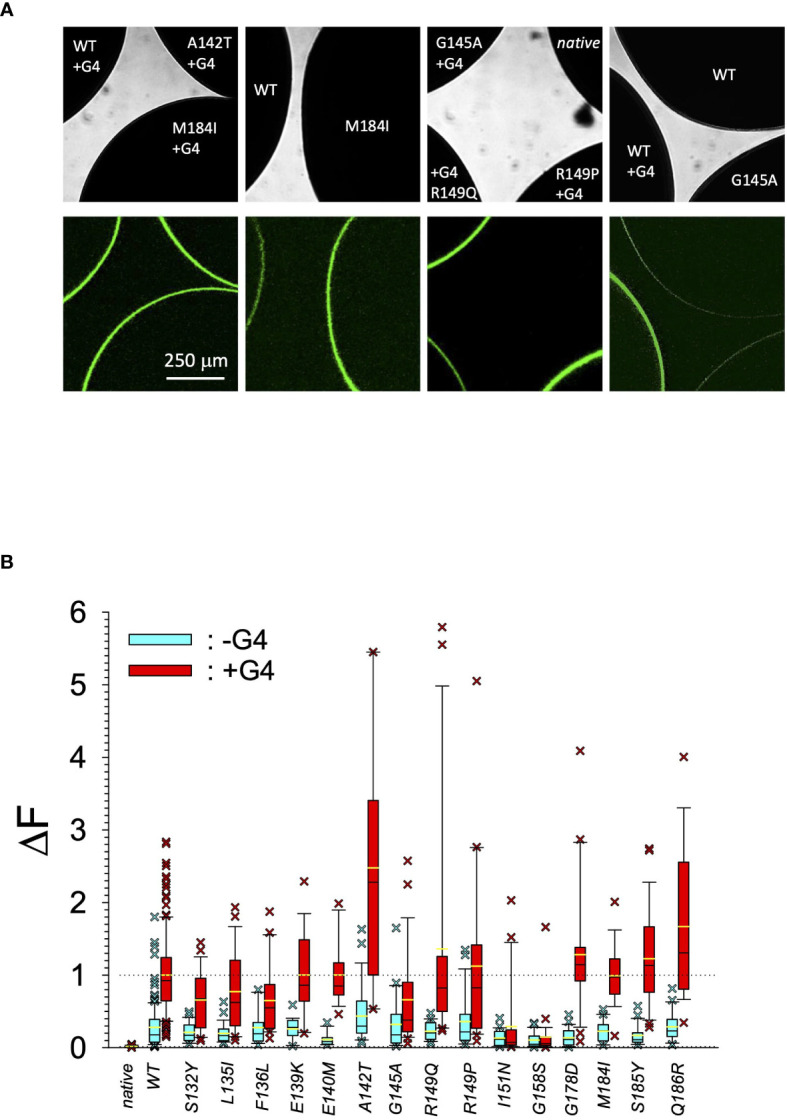
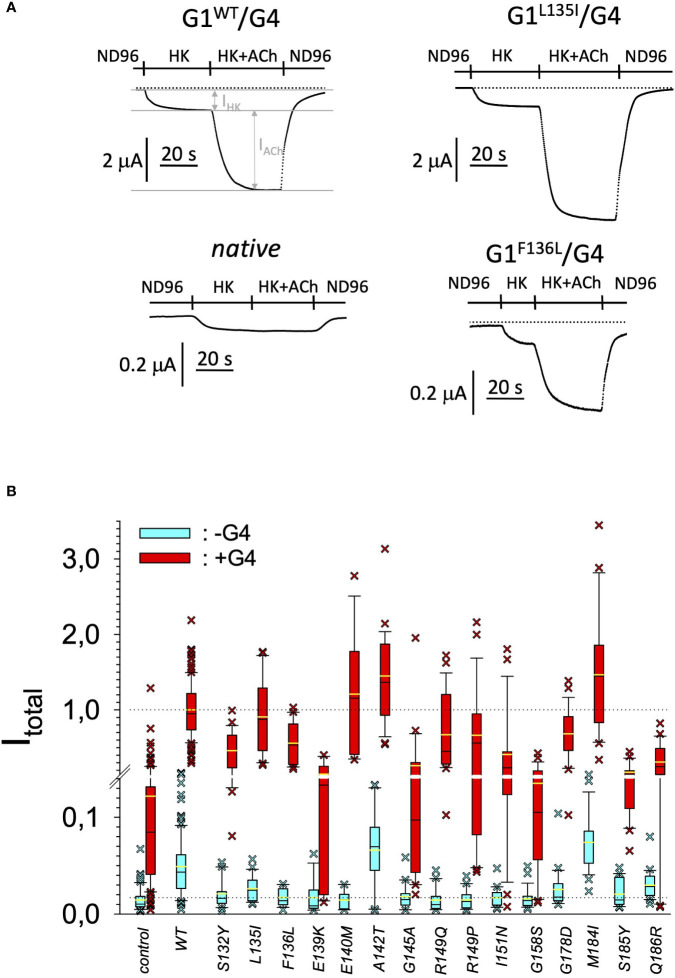
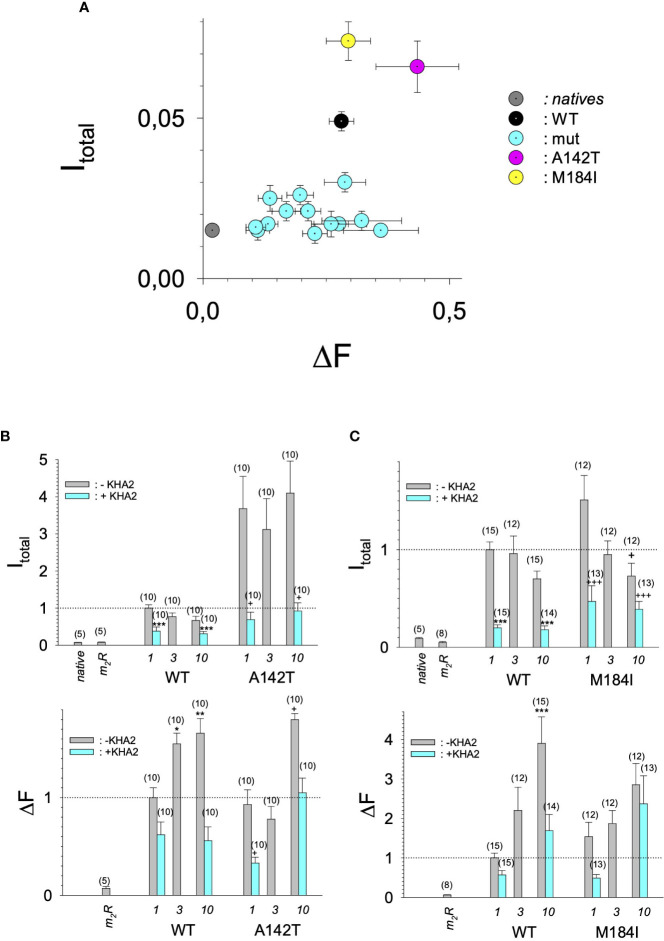
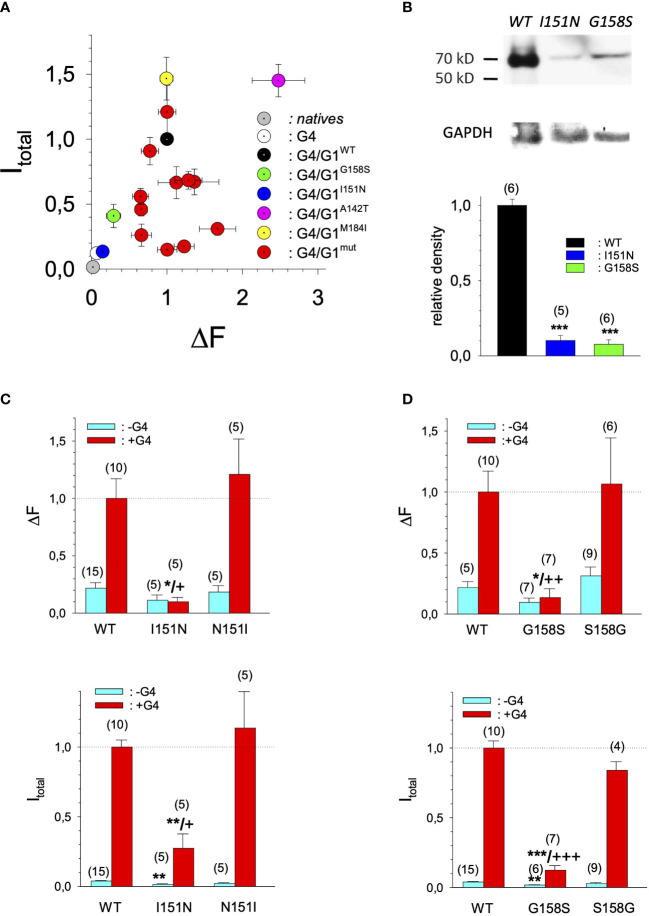
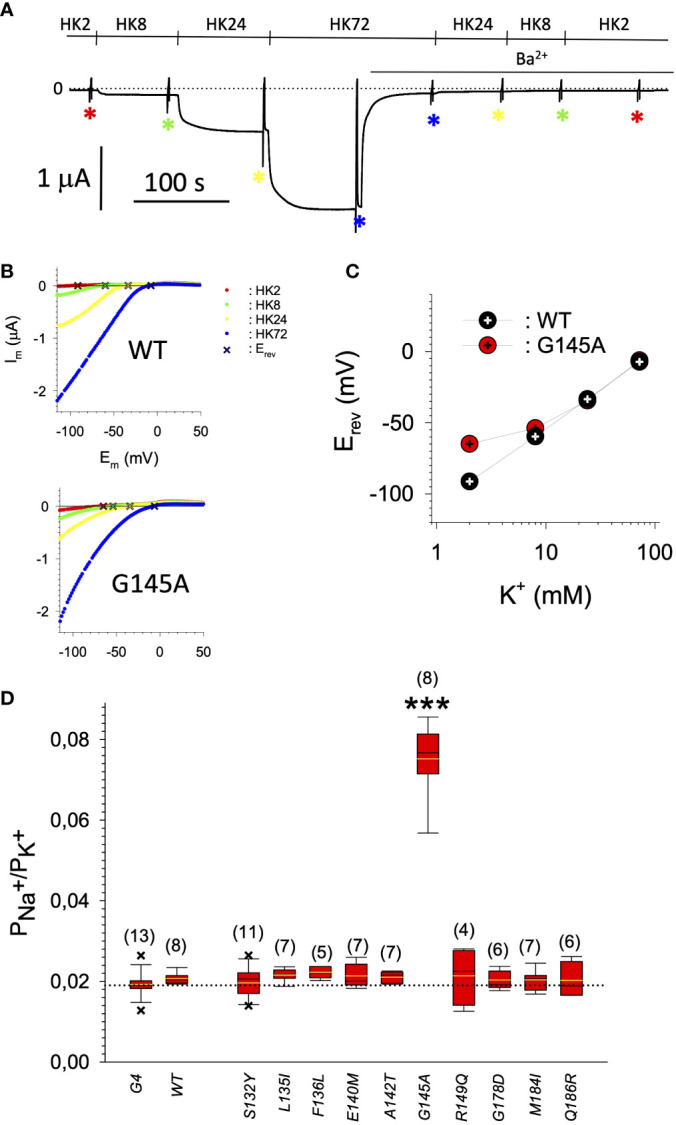
A search in the GDC Data Portal revealed 304 documented somatic mutations of the KCNJ3 gene in primary tumors (out of 10.202 cases). Most affected tumor types were carcinomas from uterus, skin and lung, while breast cancer exerted the lowest number of somatic mutations. We focused our research on 15 missense mutations within the region between TM1 and TM2, comprising the pore helix and ion selectivity signature. Expression was measured by confocal laser scan microscopy of eGFP tagged GIRK1 subunits, expressed with and without GIRK4 in oocytes of Xenopus laevis. GIRK ion currents were activated via coexpressed m2Rs and measured by the Two Electrode Voltage Clamp technique. Magnitude of the total GIRK current, as well as the fraction of current inducible by the agonist, were measured. Ion selectivity was gauged by assessment of the PNa+/PK+ ratio, calculated by the GIRK current reversal potential in extracellular media at different Na+ and K+ concentrations. None of the tested mutations was able to form functional GIRK1 homooligomeric ion channels. One of the mutations, G145A, which locates directly to the ion selectivity signature, exerted an increased PNa+/PK+ ratio. Generally, the missense mutations studied can be categorized into three groups: (i) normal/reduced expression accompanied by reduced/absent function (S132Y, F136L, E139K, G145A, R149Q, R149P, G178D, S185Y, Q186R), (ii) normal/increased expression as well as increased function (E140M, A142T, M184I) and (iii) miniscule expression but increased function relative to expression levels (I151N, G158S). We conclude, that gain of function mutations, identical or similar to categories (ii) and (iii), may potentially be involved in genesis and progression of malignancies in tissues that exert a high rate of occurrence of somatic mutations of KCNJ3.

Keywords: GIRK1; Xenopus laevis (X. laevis); confocal laser scanning microcopy; ion channels and cancer; somatic mutation analysis; two electrode voltage clamp.


Conflict of interest statement

The authors declare that the research was conducted in the absence of any commercial or financial relationships that could be construed as a potential conflict of interest.

Figures

Figure 1
Figure 1
Structural details of GIRK1 subunit. Partial primary structure of the human GIRK1 subunit. Amino acid numbering according to entire full length variant 1a. Regions comprising the pore helix and the transmembrane helix 2 are indicated and the corresponding amino acids emphasized in red. Amino acids of outstanding interest are highlighted in purple (F137, ion selectivity signature (indicated by a purple asterisk) and S185). Somatic mutations detected are highlighted in green (1 mutation found), yellow (2 mutations found) and orange (3 mutations found). Multiple appearance of a mutation underneath an amino acid residue indicates multiple occurrence in different tumors of the sample cohort.
Figure 2
Figure 2
Quantitative expression of GIRK1 subunit mutations. (A) Original micrographs of oocytes expressing different GIRK1 constructs with and without GIRK4 coexpressed. Upper row: Transmission. Lower row: Fluorescence. (B) Expression levels of different GIRK1eGFP subunit mutations, relative to WT. Blue boxes: GIRK1 mRNA injected alone. Red boxes: GIRK1 was coinjected with GIRK4 mRNA. Box plots comprise 25% and 75% percentiles. Median (solid black line within box) and average value (yellow line) indicated within box. Whiskers denote 10% and 90% percentiles. Oocytes having values above 90% and below 10% percentiles are shown as cross. 14 – 142 oocytes per experimental group (see Supplementary Table 2 for exact values, numbers and statistics).
Figure 3
Figure 3
Current amplitudes produced by the different GIRK1 mutations. (A) Representative original TEVC current recordings, produced by different GIRK1 subunits, at a holding potential of -80 mV. Superfusion medium was exchanged as indicated above the traces. (B) Total current amplitudes, produced by different GIRK1eGFP subunit mutations, relative to WT. Blue boxes: GIRK1 mRNA injected alone. Red boxes: GIRK1 was coinjected with GIRK4 mRNA. Box plots comprise 25% and 75% percentiles. Median (solid black line within box) and average value (yellow line) indicated within box. Whiskers denote 10% and 90% percentiles. Oocytes having values above 90% and below 10% percentiles are shown as cross. 14 – 145 oocytes per experimental group (see Supplementary Table 3 for exact values, numbers and statistics).
Figure 4
Figure 4
Current amplitudes versus expression levels produced by different GIRK1 mutations injected alone. (A) Mean values of DF versus I total mean values of the different experimental groups per experimental day, without coexpression of GIRK4 subunit. Both I total and DF are normalized to the levels produced by GIRK1WT/GIRK4 on the same experimental day and batch of oocytes. Grey: native oocytes, black: GIRK1WT, purple: GIRK1A142T, yellow: GIRK1M184I and cyan: all the other GIRK1 subunit mutations tested. Whiskers represent SEMs. (B) I total (upper) and DF values (lower), resulting from injection of different amounts of mRNA encoding for GIRK1WT or GIRK1A142T, respectively (in ng at bottom of graphs). Bars represent mean values of the given experimental group. Grey: without coinjection of KHA2 antisense oligonucleotide, cyan: KHA2 antisense oligonucleotide was coinjected with mRNA. Number of oocytes given in parenthesis above the bars. Whiskers denote SEM. *, **, ***: the mean value differs statistically significant from the GIRK1WT (without KHA2 antisense oligonucleotide coinjected) at the p<0.05, 0.01, 0.001 level. +,++, +++: the mean value differs statistically significant from the GIRK1A142T (without KHA2 antisense oligonucleotide coinjected) at the p < 0.05, 0.01, 0.001 level. (C) Similar to 4B, but M184I was tested for functional GIRK1 homotetramer formation.
Figure 5
Figure 5
Current amplitudes versus expression levels produced by different GIRK1 mutations expressed as GIRK1/GIRK4 heterotetrameric ion channels. (A) Mean values of DF mean values per experimental day versus I total versus mean values of the different experimental groups, produced by GIRK1/GIRK4 heterottramers. Both I total and DF are normalized to the levels produced by GIRK1WT/GIRK4 on the same experimental day and batch of oocytes. Grey: native oocytes, white: GIRK4 homotetrameric ion channels, black: GIRK1WT/GIRK4, purple: GIRK1A142T/GIRK4, yellow: GIRK1M184I/GIRK4, green: GIRK1G158S/GIRK4, blue: GIRK1I151N/GIRK4 and red: all the other GIRK1 subunit mutations/GIRK4 tested. Whiskers represent SEM. (B) Western blots of oocyte lysates. Upper panel: representative lanes for oocytes expressing GIRK1WT/GIRK4, GIRK1I151N/GIRK4 and GIRK1G158S/GIRK4. GAPDH reference is shown underneath. Lower panel: Densitometric scans of GIRK1 immunoreactivity normalized to WT. Black: GIRK1WT, blue: GIRK1I151N and green: GIRK1G158S. Bars represent mean values of the given experimental group. Number of lanes given in parenthesis above the bars. Whiskers denote SEM. ***: the mean value differs statistically significant from GIRK1WT at the p>0.001 level. (C) I total (lower panel) and DF values (upper panel), resulting from GIRK1WT, GIRK1I151N and GIRK1N151I. Cyan: GIRK1 subunit mRNA conjected alone and red: GIRK1 and GIRK4 mRNAs injected. Bars represent mean values of the given experimental group. Number of oocytes given in parenthesis above the bars. Whiskers denote SEM. *,**,***: the mean value differs statistically significant from GIRK1WT at the p>0.05, 0.01 and 0.001 level. +, ++, +++: the mean value differs statistically significant from GIRK1N151I the at the p>0.05, 0.001, 0.001 level. (D) Similar to 5C but GIRK1G158S was tested against GIRK1WT and GIRK1S158G, respectively.
Figure 6
Figure 6
(A) Representative original current recording of the paradigm used for the determination of the PNa+/PK+ ratio. Holding potential was -80 mV. Superfusion with the different extracellular media is indicated above the current trace. Asterisks indicate the points in time where the voltage ramps were used for the recording of I/V relation. (B) Representative I/V relations for GIRK1WT/GIRK4 (upper panel) and GIRK1G145A/GIRK4 (lower panel), derived from subtraction of current recorded resulting from the voltage ramp in the presence of 2 mmole/L Ba2+ from the one in the absence of Ba2+ (red: HK2, green: HK8, yellow: HK24 and blue: HK72). Reversal potentials (Erev) of GIRK currents are marked by a cross.1. (C) Representative reversal potentials (Erev) measured at the different extracellular K+ concentrations for GIRK1WT/GIRK4 (black) and GIRK1G145A/GIRK4 (red). (D) PNa+/PK+ ratio for the different mutations tested (see Table 1 for exact values and statistics). Bars represent mean values of the given experimental group. Number of oocytes given in parenthesis above the bars. Whiskers denote SEM. ***: the mean value differs statistically significant from GIRK1WT/GIRK4 at the p > 0.001 level.

Similar articles

References

    1. Hanahan D, Weinberg RA. Hallmarks of cancer: the next generation. Cell (2011) 144(5):646–74. doi: 10.1016/j.cell.2011.02.013 - DOI - PubMed
    1. Bailey MH, Tokheim C, Porta-Pardo E, Sengupta S, Bertrand D, Weerasinghe A, et al. . Comprehensive characterization of cancer driver genes and mutations. Cell (2018) 174(4):1034–5. doi: 10.1016/j.cell.2018.07.034 - DOI - PMC - PubMed
    1. Prevarskaya N, Skryma R, Shuba Y. Ion channels in cancer: are cancer hallmarks oncochannelopathies? Physiol Rev (2018) 98(2):559–621. doi: 10.1152/physrev.00044.2016 - DOI - PubMed
    1. Luescher C, Slesinger PA. Emerging roles for G protein-gated inwardly rectifying potassium (GIRK) channels in health and disease. Nat Rev Neurosci (2010) 11(5):301–15. doi: 10.1038/nrn2834 - DOI - PMC - PubMed
    1. Dascal N. Signalling via the G protein-activated K+ channels. Cell Signalling (1997) 9(8):551–73. doi: 10.1016/S0898-6568(97)00095-8 - DOI - PubMed

LinkOut - more resources