

Macrophages inhibit Coxiella burnetii by the ACOD1-itaconate pathway for containment of Q fever
- PMID: 36479617
- PMCID: PMC9906395
- DOI: 10.15252/emmm.202215931
Macrophages inhibit Coxiella burnetii by the ACOD1-itaconate pathway for containment of Q fever
Abstract
Infection with the intracellular bacterium Coxiella (C.) burnetii can cause chronic Q fever with severe complications and limited treatment options. Here, we identify the enzyme cis-aconitate decarboxylase 1 (ACOD1 or IRG1) and its product itaconate as protective host immune pathway in Q fever. Infection of mice with C. burnetii induced expression of several anti-microbial candidate genes, including Acod1. In macrophages, Acod1 was essential for restricting C. burnetii replication, while other antimicrobial pathways were dispensable. Intratracheal or intraperitoneal infection of Acod1-/- mice caused increased C. burnetii burden, weight loss and stronger inflammatory gene expression. Exogenously added itaconate restored pathogen control in Acod1-/- mouse macrophages and blocked replication in human macrophages. In axenic cultures, itaconate directly inhibited growth of C. burnetii. Finally, treatment of infected Acod1-/- mice with itaconate efficiently reduced the tissue pathogen load. Thus, ACOD1-derived itaconate is a key factor in the macrophage-mediated defense against C. burnetii and may be exploited for novel therapeutic approaches in chronic Q fever.
Keywords: Coxiella burnetii; Cis-aconitate decarboxylase 1; Immune responsive gene 1; immunometabolism; itaconate.
© 2022 The Authors. Published under the terms of the CC BY 4.0 license.
Figures
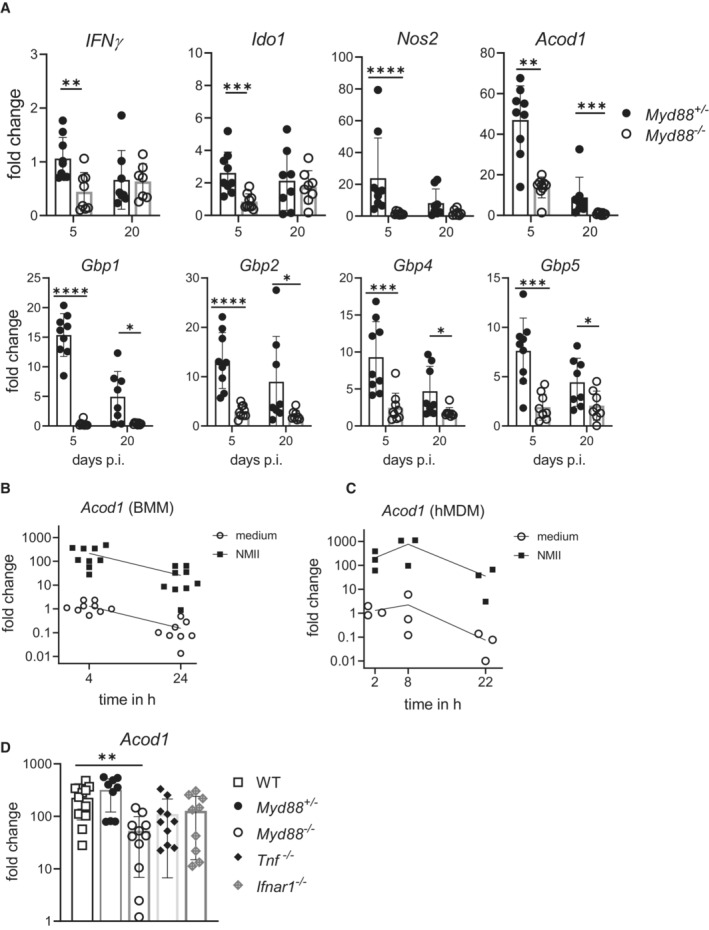
Myd88 +/− and Myd88 −/− mice were infected i.p. with NMII. Spleen RNA was prepared on day 5 or day 20 post‐infection. Expression of Nos2, Gbp1, Gbp2, Gbp5, Ido1 and Acod1 was analyzed by qRT‐PCR, using non‐infected Myd88 +/− as calibrator. Mean and SD, n = 8–9 mice per genotype, pooled from three experiments. Data for expression of IFNγ, Nos2 and Gbp1 on day 5 were previously reported (Kohl et al, 2019). Mann–Whitney test was performed between genotypes of indicated time points. *P < 0.05, **P < 0.01, ***P < 0.001, ****P < 0.0001.
Induction of Acod1 mRNA in mouse BMM infected with MOI 10 of NMII for 4 and 24 h (fold change relative to mock controls, n = 9 mice pooled from five experiments, data points staggered).
Acod1 mRNA expression in human GM‐CSF‐driven monocyte‐derived macrophages (MDM) infected with MOI 30 for 4 h and harvested at the indicated times, n = 3 different donors, each data point represents average value of triplicate stimulations.
Acod1 expression in BMM is partially dependent on MyD88 but not on Tnf and Ifnar1. BMM were infected with NMII (MOI 10) for 4 h. Acod1 mRNA shown as fold induction relative to non‐infected WT controls. Each dot represents one mouse (n = 9–13 mice), which were pooled from three to five independent experiments. Bars show mean with SD. One‐way ANOVA with Dunnett's multiple comparisons test was performed. **P < 0.01.
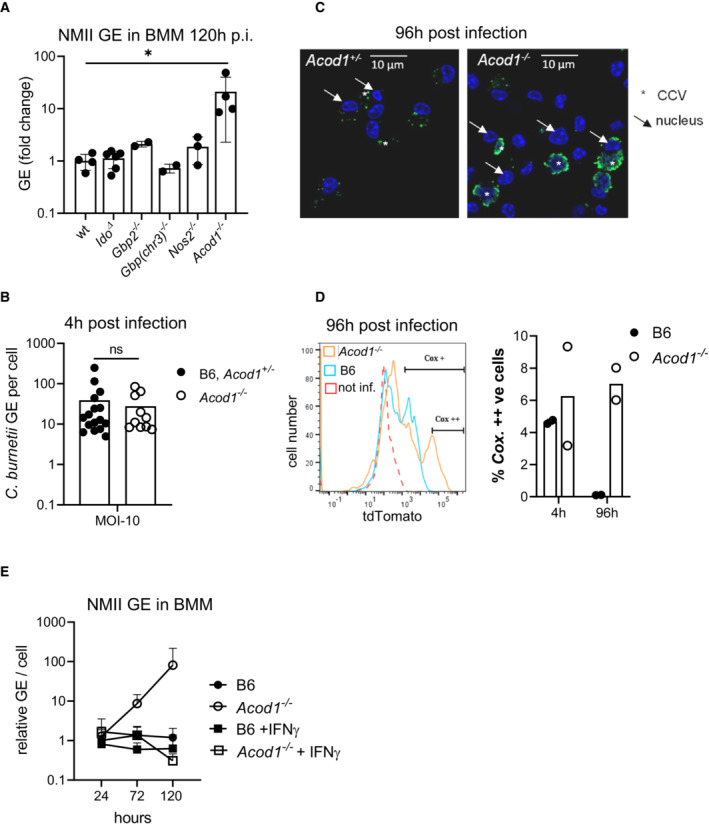
Genome equivalents (GE) of NMII per cell were measured by qPCR after 120 h in macrophage lysates. Average GE values from duplicate wells were normalized to the mean GE of all WT control samples. Each dot represents BMM from one mouse. Bars show mean with SD. *P < 0.05 in Kruskal–Wallis test with Dunn's multiple comparisons test.
Uptake of C. burnetii during initial infection period is comparable in Acod1 −/− and control BMM. GE per cell were determined after 4 h of incubation with NMII (MOI 10) and removal of extracellular bacteria. Each dot represents BMM from one mouse. Pooled from 4–6 experiments. ns not significant in Mann–Whitney test.
Immunofluorescence microscopy of WT and Acod1 −/− BMM 96 h after infection. Staining for C. burnetii appears in green, DAPI stain for DNA shows nuclei (examples marked by arrows) and large CCV in Acod1 −/− BMM (marked by asterisk).
Flow cytometric detection of tdTomato‐expressing NMII in BMM 4 and 96 h after infection. Representative histogram overlay (after 96 h) (red dotted line: WT, LPS; blue: WT, infected; orange: Acod1 −/−, infected) and quantitation of highly tdTomato‐positive BMM from 2 independent experiments, each dot represents averages of duplicates from one mouse.
Treatment with IFNγ overcomes the defect of ACOD1‐deficient BMM to control NMII replication. Average GE values from duplicate or triplicate wells were normalized to the mean GE of B6 control samples at 24 h to obtain fold change values. Mean and SD of n = 5 mice pooled from two independent experiments.
- A
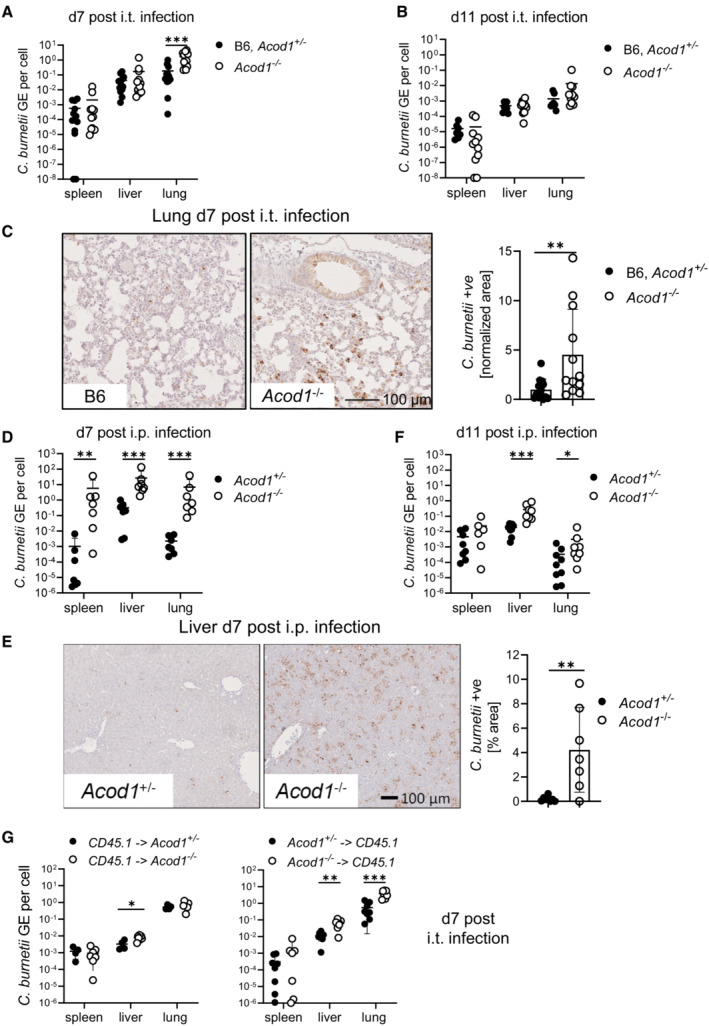
Mice were infected by the i.t. route with 106 NMII. Bacterial load in lung, spleen and liver on d7 after i.t. infection. n = 12 for Acod1 −/−, n = 13 for B6, Acod1 +/− (pooled from three independent experiments).
- B
Bacterial load on d11 after i.t. infection. n = 10–11 for Acod1 −/−, n = 8 for B6, Acod1 +/− (pooled from two independent experiments).
- C–F
(C) Immunohistochemistry for C. burnetii in the lung on d7 after i.t. infection. Representative images and quantitation of lung tissue positive for C. burnetii (n = 12–13 mice, pooled from three experiments, each normalized to the mean of WT or Acod1 +/− infected mice). Each dot represents one mouse. Bars show mean and SD. (D, F) Bacterial load in lung, spleen and liver on d7 (D) and d11 (F) after i.p. infection with 5 × 10⁷ NMII. n = 6–9 mice per genotype, pooled from two independent experiments. (E) Immunohistochemistry for C. burnetii on day 7 after intraperitoneal infection. Each dot represents one mouse. Bars show mean with SD.
- G
Radiation chimeric mice were infected i.t. with NMII. Each dot represents one mouse, data are pooled from two experiments. Bacterial burden in the tissues was determined after 7 days, except for one experiment with CD45.1 recipients when mice were sacrificed after 5 days because of weight loss. n = 4–8 mice.
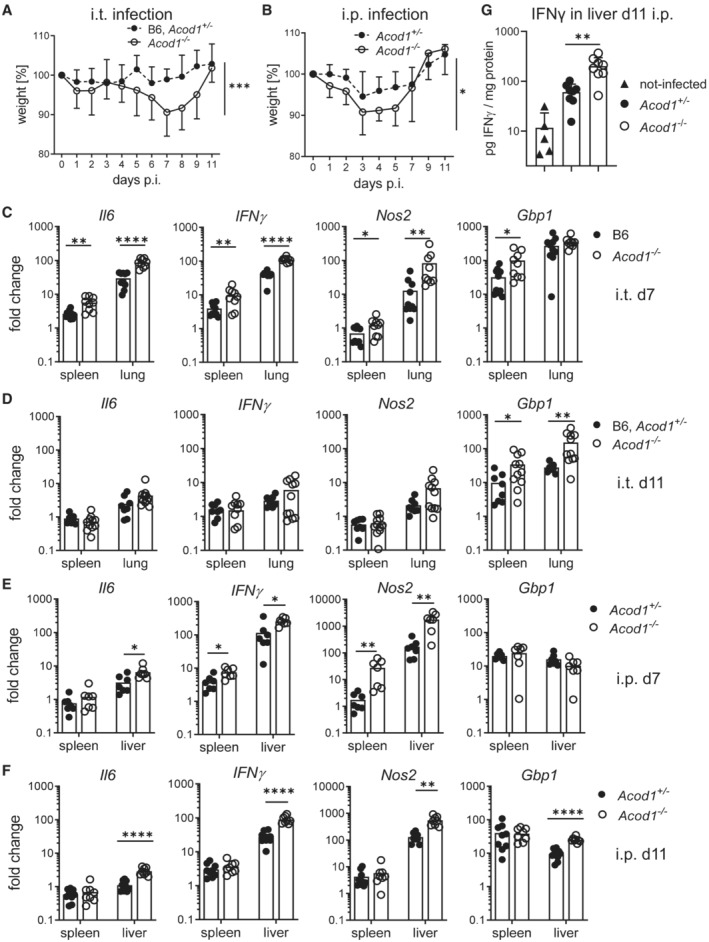
- A, B
(A) Weight curve until d11 after i.t. infection. Pooled data from six experiments. Mean and SD, n = 11–18 mice per group for days 1, 3, 8; n = 7–8 mice per group for days 5, 9, 11; n = 21–22 mice per group for days 2, 4, 6, 7. (B) Weight curve until d11 after i.p. infection. Pooled data from four experiments. Mean and SD, n = 7–9 mice for days 2, 3, 4, 9, 11 and n = 15–16 mice per genotype for days 1, 5, 7. Asterisks in (A and B) indicate *P < 0.05, ***P < 0.001 (Mixed effects model with Geisser–Greenhouse correction, comparing genotypes).
- C–F
(C, D) Expression of Il6, IFNγ, Nos2, Gbp1 in lung and spleen on d7 (C) and d11 (D) after i.t. infection. Each dot represents one mouse. n = 8–11, pooled from two experiments. (E, F) Gene expression changes in spleen and liver after i.p. infection on d7 (E) or d11 (F). n = 7–9 mice, pooled from two independent experiments. Fold changes in (C‐F) were calculated according to the ΔΔCT method, using average ΔCT values from samples of non‐infected B6 or Acod1 +/− mice as calibrators. Asterisks in (C‐F) indicate *P < 0.05, **P < 0.01, ****P < 0.0001 (Mann–Whitney test comparing genotypes in specified organ).
- G
Protein levels of IFNγ per mg protein in liver homogenates of non‐infected Acod1+/− or B6 (n = 5), and Acod1 −/− and Acod1 +/− mice sacrificed on day 11 after i.p. infection with NMII (n = 8 per genotype). **P < 0.01 in Mann–Whitney test comparing infected Acod1 −/− and Acod1 +/−.
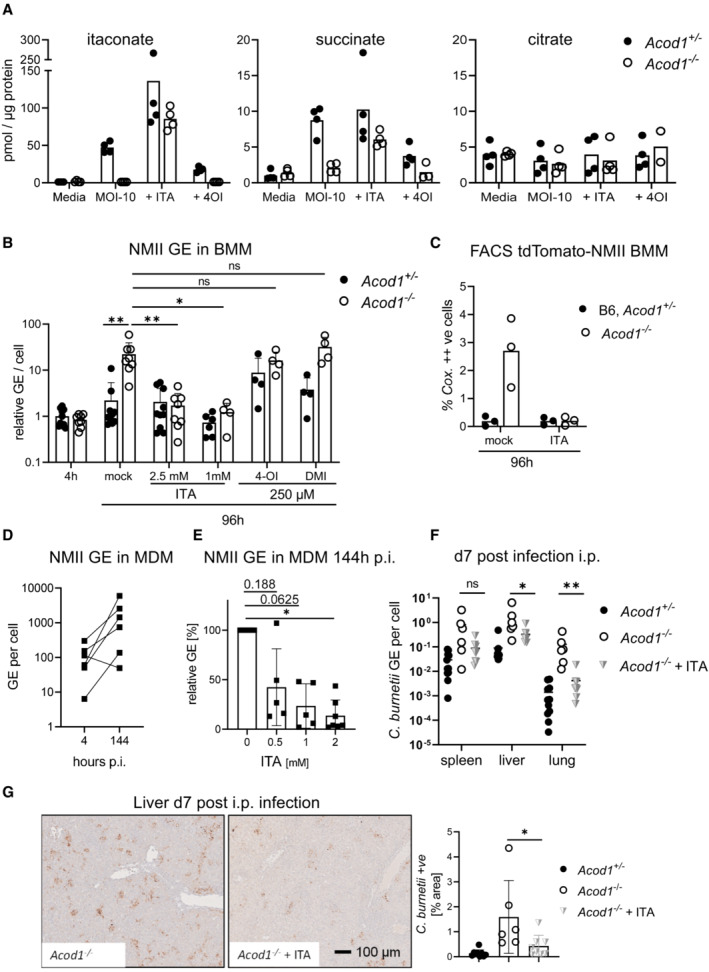
- A
GC–MS analysis of TCA cycle metabolites and ITA in BMM infected with NMII (MOI 10). BMM were infected for 4 h, followed by a washing step. Where indicated, exogenous ITA was added at 2.5 mM ITA, 4‐OI at 250 μM, after removing extracellular bacteria. Macrophages were harvested after 24 h. Data shown are from two independent experiments (n = 4 biological replicates).
- B
ITA, but not 4‐OI or DMI, reduce NMII replication to WT levels in ACOD1‐deficient BMM. Shown are qPCR data as C. burnetii GE normalized per cell (each dot represents one mouse and data were pooled together from 4 individual experiments with 2.5 mM ITA; n = 8–9 mice per genotype) and two experiments with 1 mM ITA, 250 μM 4‐OI and 250 μM DMI (n = 4 mice per genotype). Each dot represents one mouse. Bars show mean plus SD. *P < 0.05, **P < 0.01 in Kruskal–Wallis test with Dunn's multiple comparisons test.
- C
BMM were infected with tdTomato‐expressing NMII and analyzed by flow cytometry 96 h after infection. ITA was added at 2.5 mM. Depicted is the percentage of BMM highly positive for tdTomato (as in Fig 2D). Pooled data from two independent experiments, each dot represents mean values of duplicates from BMM of one mouse.
- D
NMII replication in human MDM. Infection was performed with MOI 10 for 4 h followed by washing. Cells were lysed then directly or after 144 h. Average values of replicate wells from 6 individual donors.
- E
Addition of ITA inhibits NMII replication in human macrophages. ITA at the indicated concentrations was added to MDM after infection with NMII MOI 10. Bacterial burden was determined after 144 h as GE per cell by qPCR. Data were normalized to MDM infected but not treated with ITA (100%). Average values of replicates from n = 5–7 donors, error bars indicate SD. P‐values (Wilcoxon matched‐pairs signed rank test) are indicated.
- F, G
Treatment of mice with 1 mg of ITA i.p. on days 1, 3, and 5 after i.p. infection with NMII lowers bacterial burden in the organs on day 7. C. burnetii GE quantified by qPCR (F), representative images of liver sections and quantification of immunohistochemistry for C. burnetii in liver sections as in Fig 3E (G). n = 6–11 mice (for NMII infections), pooled from two experiments. Each dot represents one mouse. Bars show mean with SD. Asterisks indicate significance (Mann–Whitney test comparing treatment and control group of NMII infected Acod1 −/− mice in specified organs, *P < 0.05, **P < 0.01).
- A
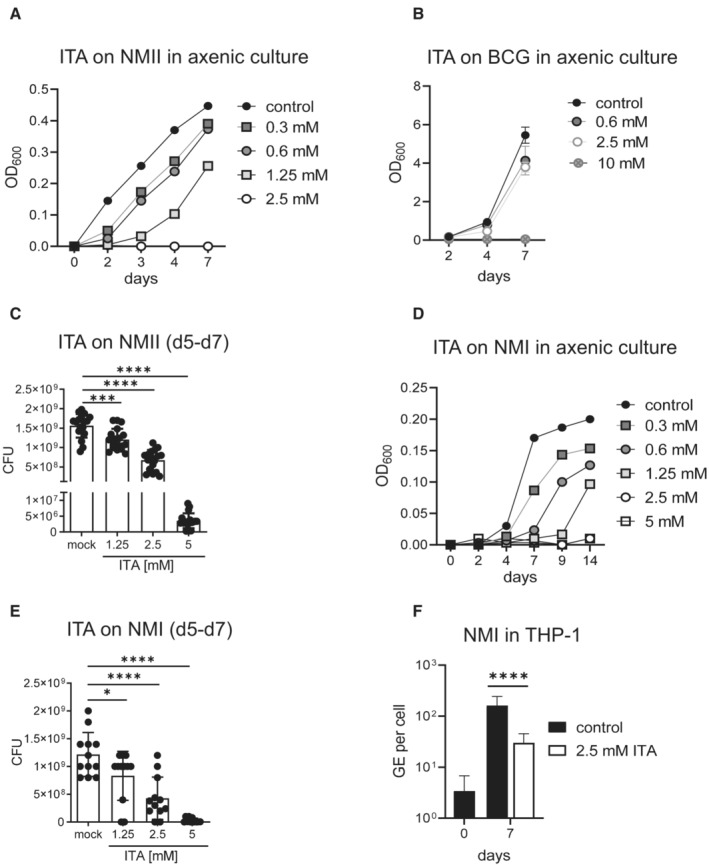
ITA inhibits NMII replication in axenic culture in ACCM‐2. Dose response and kinetic analysis. Representative of two experiments.
- B
Effect of ITA on Mycobacterium bovis BCG. Inoculum density on d0: OD600 = 0.045. Mean and SD, n = 3 replicate cultures, of one representative experiment of three performed.
- C
ITA inhibits NMII growth in axenic culture after delayed addition of ITA at the indicated concentrations on day 5. On day 7, CFU were determined. Data points show results pooled from two independent experiments with three biological and technical replicates each. Bars show mean with SD. One‐way ANOVA with Dunnett's multiple comparisons test was performed. ***P < 0.001, ****P < 0.0001.
- D, E
ITA inhibits NMI replication in axenic culture. (D) Titrated ITA concentrations were added at the start of the culture in ACCM‐2. Bacterial growth was measured as OD600nm at the indicated time points. Mean of triplicate cultures. (E) Effect of delayed addition of ITA on day 5 of NMI cultures on CFU determined on day 7. Data from one experiment with three biological and four technical replicates each. Bars show mean with SD. One‐way ANOVA with Dunnett's multiple comparisons test was performed. *P < 0.05, ****P < 0.0001.
- F
THP‐1 cells were infected with NMI (MOI 100) for 4 h, followed by washing and addition of ITA. Cells were harvested after 7 days of culture. qPCR for human albumin and C. burnetii was performed to calculate GE per cell. Mean and SD of 8–18 biological replicates pooled from two independent experiments. ****P < 0.0001 in Mann–Whitney test.
- A–C
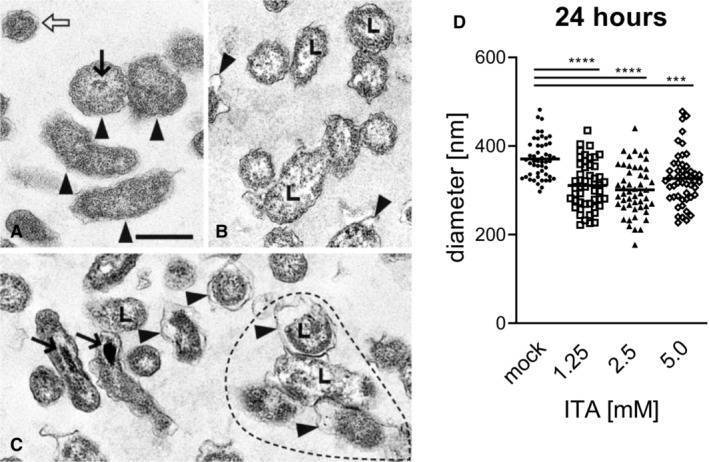
(A) without ITA: Normal morphology of four LCV (arrowheads) and one SCV (open arrow). Note centrally located nucleoid (thin arrow). (B) with 1.25 mM ITA: LCV with unevenly distributed cytoplasm, clumped at the cytoplasmic membrane and lytic centers (L, examples). Some LCV have dilated periplasmic spaces (arrowheads). (C) with 5.0 mM ITA: LCV have markedly reduced diameters compared with controls in (A) and dilated periplasmic spaces (arrowheads). Their cytoplasm is clumped and centers are lytic as in (B) (L, examples). Four distorted LCV form an aggregate (surrounded by hatched line). Two LCV have electron dense calcium deposits in the area of the nucleoid (arrows). (A), (B), (C) are of the same magnification, scale bar = 500 nm.
- D
Quantification of LCV diameters after treatment of C. burnetii NMII with ITA. Images from electron microscopy were analyzed by random selection of 50 bacterial LCV for measurement of the cell diameter. Each dot represents one cell, mean values are indicated. Statistical analysis was done by One‐way ANOVA, with comparison to the mock condition, followed by Dunnett's correction for multiple testing. Asterisks indicate P = 0.0001 (***) and P < 0.0001 (****).
- A–D
(A) without ITA: Normal morphology of several LCV (arrowheads, examples) and two SCV (open arrows). (B) with 1.25 mM ITA: LCV with unevenly distributed cytoplasm, clumped at the cytoplasmic membrane and lytic centers (L). One LCV is markedly shrunken and has a severely dilated periplasmic space (arrowhead). Electron dense calcium deposits in the area of a nucleoid (thin arrow). (C) with 2.5 mM ITA: Many shrunken LCV with dilated periplasmic spaces (arrowheads). Some have lytic centers (L), others electron dense calcium deposits in the area of the nucleoid (thin arrow). (D) with 5.0 mM ITA: Shrunken LCV with dilated periplasmic spaces (arrowheads). Some have lytic centers (L), others electron dense calcium deposits in the area of the nucleoid (thin arrow). Distorted LCV form an aggregate (surrounded by hatched line). (A), (B), (C), (D) are of the same magnification, scale bar = 500 nm.
- E
Quantification of LCV diameters after treatment of C. burnetii NMII with ITA. Images from electron microscopy were analyzed by random selection of 50 bacterial LCV for measurement of the cell diameter. Each dot represents one cell, mean values are indicated. Statistical analysis was done by One‐way ANOVA, with comparison to the mock condition, followed by Dunnett's correction for multiple testing. Asterisks indicate P < 0.0001 (****).
Similar articles
-
Divergent effects of itaconate isomers on Coxiella burnetii growth in macrophages and in axenic culture.Front Immunol. 2024 Aug 2;15:1427457. doi: 10.3389/fimmu.2024.1427457. eCollection 2024. Front Immunol. 2024. PMID: 39156902 Free PMC article.
-
TNF and type I IFN induction of the IRG1-itaconate pathway restricts Coxiella burnetii replication within mouse macrophages.bioRxiv [Preprint]. 2023 Jul 7:2023.07.07.548079. doi: 10.1101/2023.07.07.548079. bioRxiv. 2023. PMID: 37461589 Free PMC article. Preprint.
-
MyD88 Is Required for Efficient Control of Coxiella burnetii Infection and Dissemination.Front Immunol. 2019 Feb 8;10:165. doi: 10.3389/fimmu.2019.00165. eCollection 2019. Front Immunol. 2019. PMID: 30800124 Free PMC article.
-
Role of innate and adaptive immunity in the control of Q fever.Adv Exp Med Biol. 2012;984:273-86. doi: 10.1007/978-94-007-4315-1_14. Adv Exp Med Biol. 2012. PMID: 22711637 Review.
-
Control of immune cell signaling by the immuno-metabolite itaconate.Front Immunol. 2024 Feb 28;15:1352165. doi: 10.3389/fimmu.2024.1352165. eCollection 2024. Front Immunol. 2024. PMID: 38487538 Free PMC article. Review.
Cited by
-
Immunometabolism: signaling pathways, homeostasis, and therapeutic targets.MedComm (2020). 2024 Nov 3;5(11):e789. doi: 10.1002/mco2.789. eCollection 2024 Nov. MedComm (2020). 2024. PMID: 39492834 Free PMC article. Review.
-
Dual proteomics of infected macrophages reveal bacterial and host players involved in the Francisella intracellular life cycle and cell to cell dissemination by merocytophagy.Sci Rep. 2024 Apr 2;14(1):7797. doi: 10.1038/s41598-024-58261-x. Sci Rep. 2024. PMID: 38565565 Free PMC article.
-
IRG1/Itaconate inhibits proliferation and promotes apoptosis of CD69+CD103+CD8+ tissue-resident memory T cells in autoimmune hepatitis by regulating the JAK3/STAT3/P53 signalling pathway.Apoptosis. 2024 Oct;29(9-10):1738-1756. doi: 10.1007/s10495-024-01970-5. Epub 2024 Apr 19. Apoptosis. 2024. PMID: 38641760
-
Caspase-8 activity mediates TNFα production and restricts Coxiella burnetii replication during murine macrophage infection.bioRxiv [Preprint]. 2024 Feb 3:2024.02.02.578698. doi: 10.1101/2024.02.02.578698. bioRxiv. 2024. Update in: Infect Immun. 2024 Jul 11;92(7):e0005324. doi: 10.1128/iai.00053-24. PMID: 38352389 Free PMC article. Updated. Preprint.
-
Future applications of host direct therapies for infectious disease treatment.Front Immunol. 2024 Oct 1;15:1436557. doi: 10.3389/fimmu.2024.1436557. eCollection 2024. Front Immunol. 2024. PMID: 39411713 Free PMC article. Review.
References
-
- Ammerdorffer A, Schoffelen T, Gresnigt MS, Oosting M, den Brok MH, Abdollahi‐Roodsaz S, Kanneganti TD, de Jong DJ, van Deuren M, Roest HJ et al (2015) Recognition of Coxiella burnetii by toll‐like receptors and nucleotide‐binding oligomerization domain‐like receptors. J Infect Dis 211: 978–987 - PubMed
-
- Anderson A, Bijlmer H, Fournier PE, Graves S, Hartzell J, Kersh GJ, Limonard G, Marrie TJ, Massung RF, McQuiston JH et al (2013) Diagnosis and management of Q fever – United States, 2013: recommendations from CDC and the Q fever working group. MMWR Recomm Rep 62: 1–30 - PubMed
-
- Andoh M, Zhang G, Russell‐Lodrigue KE, Shive HR, Weeks BR, Samuel JE (2007) T cells are essential for bacterial clearance, and gamma interferon, tumor necrosis factor alpha, and B cells are crucial for disease development in Coxiella burnetii infection in mice. Infect Immun 75: 3245–3255 - PMC - PubMed
Publication types
MeSH terms
Substances
LinkOut - more resources
Full Text Sources
