Identification of cuproptosis-related subtypes, construction of a prognosis model, and tumor microenvironment landscape in gastric cancer
- PMID: 36479114
- PMCID: PMC9719959
- DOI: 10.3389/fimmu.2022.1056932
Identification of cuproptosis-related subtypes, construction of a prognosis model, and tumor microenvironment landscape in gastric cancer
Abstract
Introduction: Cuproptosis is a novel identified regulated cell death (RCD), which is correlated with the development, treatment response and prognosis of cancer. However, the potential role of cuproptosis-related genes (CRGs) in the tumor microenvironment (TME) of gastric cancer (GC) remains unknown.
Methods: Transcriptome profiling, somatic mutation, somatic copy number alteration and clinical data of GC samples were downloaded from the Cancer Genome Atlas (TCGA) and the Gene Expression Omnibus (GEO) database to describe the alterations of CRGs from genetic and transcriptional fields. Differential, survival and univariate cox regression analyses of CRGs were carried out to investigate the role of CRGs in GC. Cuproptosis molecular subtypes were identified by using consensus unsupervised clustering analysis based on the expression profiles of CRGs, and further analyzed by GO and KEGG gene set variation analyses (GSVA). Genes in distinct molecular subtypes were also analyzed by GO and KEGG gene enrichment analyses (GSEA). Differentially expressed genes (DEGs) were screened out from distinct molecular subtypes and further analyzed by GO enrichment analysis and univariate cox regression analysis. Consensus clustering analysis of prognostic DEGs was performed to identify genomic subtypes. Next, patients were randomly categorized into the training and testing group at a ratio of 1:1. CRG Risk scoring system was constructed through logistic least absolute shrinkage and selection operator (LASSO) cox regression analysis, univariate and multivariate cox analyses in the training group and validated in the testing and combined groups. Real-time quantitative polymerase chain reaction (RT-qPCR) was used to evaluate the expression of key Risk scoring genes. Sensitivity and specificity of Risk scoring system were examined by using receiver operating characteristic (ROC) curves. pRRophetic package in R was used to investigate the therapeutic effects of drugs in high- and low- risk score group. Finally, the nomogram scoring system was developed to predict patients' survival through incorporating the clinicopathological features and CRG Risk score.
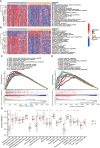
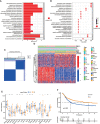
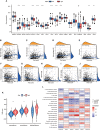
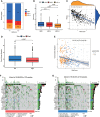
Results: Most CRGs were up-regulated in tumor tissues and showed a relatively high mutation frequency. Survival and univariate cox regression analysis revealed that LIAS and FDX1 were significantly associated with GC patients' survival. After consensus unsupervised clustering analysis, GC patients were classified into two cuproptosis molecular subtypes, which were significantly associated with clinical features (gender, age, grade and TNM stage), prognosis, metabolic related pathways and immune cell infiltration in TME of GC. GO enrichment analyses of 84 DEGs, obtained from distinct molecular subtypes, revealed that DEGs primarily enriched in the regulation of metabolism and intracellular/extracellular structure in GC. Univariate cox regression analysis of 84 DEGs further screened out 32 prognostic DEGs. According to the expression profiles of 32 prognostic DEGs, patients were re-classified into two gene subtypes, which were significantly associated with patients' age, grade, T and N stage, and survival of patients. Nest, the Risk score system was constructed with moderate sensitivity and specificity. A high CRG Risk score, characterized by decreased microsatellite instability-high (MSI-H), tumor mutation burden (TMB) and cancer stem cell (CSC) index, and high stromal and immune score in TME, indicated poor survival. Four of five key Risk scoring genes expression were dysregulated in tumor compared with normal samples. Moreover, CRG Risk score was greatly related with sensitivity of multiple drugs. Finally, we established a highly accurate nomogram for promoting the clinical applicability of the CRG Risk scoring system.
Discussion: Our comprehensive analysis of CRGs in GC demonstrated their potential roles in TME, clinicopathological features, and prognosis. These findings may improve our understanding of CRGs in GC and provide new perceptions for doctors to predict prognosis and develop more effective and personalized therapy strategies.
Keywords: cuproptosis-related genes (CRGs); drugs susceptibility; gastric cancer (GC); prognosis model; tumor microenvironment (TME).
Copyright © 2022 Wang, Qin, Tao, Wang, Xie, Wang, Li, Cao, Qiao, Zhong and Hu.
Conflict of interest statement
The authors declare that the research was conducted in the absence of any commercial or financial relationships that could be construed as a potential conflict of interest.
Figures


Similar articles
-
Cuproptosis-related risk score predicts prognosis and characterizes the tumor microenvironment in colon adenocarcinoma.Front Oncol. 2023 Jun 2;13:1152681. doi: 10.3389/fonc.2023.1152681. eCollection 2023. Front Oncol. 2023. PMID: 37333810 Free PMC article.
-
Identification of a novel cuproptosis-related gene signature and integrative analyses in patients with lower-grade gliomas.Front Immunol. 2022 Aug 15;13:933973. doi: 10.3389/fimmu.2022.933973. eCollection 2022. Front Immunol. 2022. PMID: 36045691 Free PMC article. Review.
-
Comprehensive Analysis and Verification of the Prognostic Significance of Cuproptosis-Related Genes in Colon Adenocarcinoma.Int J Mol Sci. 2024 Nov 4;25(21):11830. doi: 10.3390/ijms252111830. Int J Mol Sci. 2024. PMID: 39519383 Free PMC article.
-
Cuproptosis-Related Signature Predicts the Prognosis, Tumor Microenvironment, and Drug Sensitivity of Hepatocellular Carcinoma.J Immunol Res. 2022 Nov 16;2022:3393027. doi: 10.1155/2022/3393027. eCollection 2022. J Immunol Res. 2022. PMID: 36438201 Free PMC article.
-
Machine learning algorithm to construct cuproptosis- and immune-related prognosis prediction model for colon cancer.World J Gastrointest Oncol. 2023 Mar 15;15(3):372-388. doi: 10.4251/wjgo.v15.i3.372. World J Gastrointest Oncol. 2023. PMID: 37009317 Free PMC article. Review.
Cited by
-
FDX1 as a novel biomarker and treatment target for stomach adenocarcinoma.World J Gastrointest Surg. 2024 Jun 27;16(6):1803-1824. doi: 10.4240/wjgs.v16.i6.1803. World J Gastrointest Surg. 2024. PMID: 38983344 Free PMC article.
-
Comprehensive analysis of disulfidptosis related genes and prognosis of gastric cancer.World J Clin Oncol. 2023 Oct 24;14(10):373-399. doi: 10.5306/wjco.v14.i10.373. World J Clin Oncol. 2023. PMID: 37970110 Free PMC article.
-
Establishment of patient-derived organoids and a characterization based drug discovery platform for treatment of gastric cancer.Cancer Cell Int. 2024 Aug 14;24(1):288. doi: 10.1186/s12935-024-03460-9. Cancer Cell Int. 2024. PMID: 39143546 Free PMC article.
-
Cuproptosis, ferroptosis and PANoptosis in tumor immune microenvironment remodeling and immunotherapy: culprits or new hope.Mol Cancer. 2024 Nov 15;23(1):255. doi: 10.1186/s12943-024-02130-8. Mol Cancer. 2024. PMID: 39543600 Free PMC article. Review.
-
Prognostic and therapeutic model based on disulfidptosis-related genes for patients with clear cell renal cell carcinoma.Heliyon. 2024 Jun 2;10(11):e32258. doi: 10.1016/j.heliyon.2024.e32258. eCollection 2024 Jun 15. Heliyon. 2024. PMID: 38882384 Free PMC article.
References
-
- Slagter AE, Vollebergh MA, Caspers IA, van Sandick JW, Sikorska K, Lind P, et al. . Prognostic value of tumor markers and ctDNA in patients with resectable gastric cancer receiving perioperative treatment: results from the CRITICS trial. Gastric Cancer (2022) 25(2):401–10. doi: 10.1007/s10120-021-01258-6 - DOI - PMC - PubMed
Publication types
MeSH terms
Substances
LinkOut - more resources
Full Text Sources
Medical
Miscellaneous

