. 2022 Dec 7;12(1):21113.
doi: 10.1038/s41598-022-25534-2.

Aporphine and isoquinoline derivatives block glioblastoma cell stemness and enhance temozolomide cytotoxicity

Affiliations

Aporphine and isoquinoline derivatives block glioblastoma cell stemness and enhance temozolomide cytotoxicity

Dorival Mendes Rodrigues-Junior et al. Sci Rep. .

Abstract

Glioblastoma (GBM) is the most aggressive and common primary malignant brain tumor with limited available therapeutic approaches. Despite improvements in therapeutic options for GBM patients, efforts to develop new successful strategies remain as major unmet medical needs. Based on the cytotoxic properties of aporphine compounds, we evaluated the biological effect of 12 compounds obtained through total synthesis of ( ±)-apomorphine hydrochloride (APO) against GBM cells. The compounds 2,2,2-trifluoro-1-(1-methylene-3,4-dihydroisoquinolin-2(1H)-yl)ethenone (A5) and ( ±)-1-(10,11-dimethoxy-6a,7-dihydro-4H-dibenzo[de,g]quinolin-6(5H)-yl)ethenone (C1) reduced the viability of GBM cells, with 50% inhibitory concentration ranging from 18 to 48 μM in patient-derived GBM cultures. Our data show that APO, A5 or C1 modulate the expression of DNA damage and apoptotic markers, impair 3D-gliomasphere growth and reduce the expression of stemness markers. Potential activity and protein targets of A5, C1 or APO were predicted in silico based on PASS and SEA software. Dopamine receptors (DRD1 and 5), CYP2B6, CYP2C9 and ABCB1, whose transcripts were differentially expressed in the GBM cells, were among the potential A5 or C1 target proteins. Docking analyses (HQSAR and 3D-QSAR) were performed to characterize possible interactions of ABCB1 and CYP2C9 with the compounds. Notably, A5 or C1 treatment, but not temozolomide (TMZ), reduced significantly the levels of extracellular ATP, suggesting ABCB1 negative regulation, which was correlated with stronger cytotoxicity induced by the combination of TMZ with A5 or C1 on GBM cells. Hence, our data reveal a potential therapeutic application of A5 and C1 as cytotoxic agents against GBM cells and predicted molecular networks that can be further exploited to characterize the pharmacological effects of these isoquinoline-containing substances.


Conflict of interest statement

The authors declare that they have no competing interests.

Figures

Figure 1
Figure 1
Assessment of cell viability in GBM cells. (A) Viability level of T98G cells after treatment for 48 h with 100 µM of selected substances tested in this study, as well as 12.5 µM of lomustine, used as a positive control for GBM cytotoxicity. Data were normalized against DMSO. IC50 values were determined after treatment for 48 h with increasing concentrations of A5 (B), C1 (C) or APO (D). Cell viability was determined using the PrestoBlue reagent. These assays were conducted in triplicate (with at least two biological replicates); error bars represent mean ± SD. Asterisks denote significance as determined by one-way ANOVA multiple comparisons followed by Dunnet test (post-test); ***p < 0.0001.
Figure 2
Figure 2
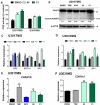
Treatment with aporphine and isoquinoline derivatives induce an intrinsic apoptosis cell death. (A) COX activities of GBM cells after 24 h of incubation with A5 (30 μM) or C1 (30 μM). Results are expressed as percentage of cell control treated with DMSO. (B) Representative immunoblot of cleaved caspase-3 in U3017MG cells treated with TMZ, APO, A5 or C1 for 48 h. β-Actin was used as a loading control, and molecular mass (kDa) markers are indicated along with densitometric values of normalized band intensity. (C, D) RT-qPCR was used for detection of markers for cell death mediated by apoptosis: BIM, BECN1 and BAX in U3017MG (C) and U3031MG (D) cells treated with DMSO, TMZ (150 µM), APO (25 µM), A5 (30 µM) or C1 (30 µM) for 48 h. TMZ, an alkylating agent frequently used as chemotherapy in GBM patients, was used as the positive control. (E, F) RT-qPCR was used for detection of DNA damage response gene expression: CDKN1A (p21) in U3017MG (E) and U3031MG (F) cells treated with DMSO, TMZ (150 µM), APO (25 µM), A5 (30 µM) or C1 (30 µM) for 48 h. All the relative expression levels were normalized to GAPDH expression and calculated using the 2−ΔΔCt method. Error bars represent SD from three biological replicates and p values were calculated according to the two-way ANOVA test followed by Bonferroni (post-test); *p < 0.05, **p < 0.01, ***p < 0.001.
Figure 3
Figure 3
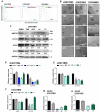
Aporphine and isoquinoline derivatives block gliomasphere formation. (A) Extreme limiting dilution assay of three patient-derived GBM cell lines (U3017MG, U3031MG and U3034MG) treated with DMSO (CTRL), TMZ (150 µM), APO (25 µM), A5 (30 µM) or C1 (30 µM) for seven days. The number of sphere‐containing wells (> 50 μm) per plating density was plotted. Steeper slopes indicate higher frequencies of sphere‐forming cells. (B) Representative microscopy figures of gliomaspheres formed after treatment with CTRL, TMZ, A5, C1 or APO for seven days. Magnification bars: 50 μm. (C) Immunoblot analysis of NESTIN (NES), CD133, SOX2, and GFAP levels in U3017MG cells; GAPDH was used as a normalization control for protein analysis, and molecular mass (kDa) markers are indicated along with densitometric values of normalized band intensity. The grouping of blots was cropped from different parts of the same gel. RT-qPCR was used for detection of stemness markers NES and CD133 in U3017MG (D), U3031MG (E) and U3034MG (F) treated with TMZ, APO, A5 or C1 for 48 h. RT-qPCR was used for detection of GFAP in U3017MG (G) and U3031MG (H) treated with TMZ, APO, A5 or C1 for 48 h. All the relative expression levels were normalized to GAPDH expression and calculated using the 2−ΔΔCt method. Error bars represent SD from three biological replicates (*p < 0.05, **p < 0.01, ***p < 0.001).
Figure 4
Figure 4
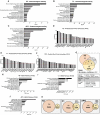
In silico predictions of pharmacological activity and target proteins for the aporphine and isoquinoline derivatives. Prediction of Activity Spectra for Substances (PASS; http://way2drug.com/PassOnline) identified the predicted pharmacological activity of tested compounds (A) A5, (B) C1 and (C) APO. The data were represented as the ratio of probable activity (Pa) per probable inactivity (Pi) for each pharmacological activity. Representation of the PASS predicted proteins with confidence > 0.2 interacting with (D) A5, (E) C1 or (F) APO. (G) Distribution of the 56 predicted proteins through PASS (confidence > 0.2) interacting with A5, C1 or APO. The table lists the common interacting proteins for A5, C1 and APO (ABCB1, CYP2B6, CYP2C9, HRH2 and OXSR1); A5 and APO (APEX1); C1 and APO (ADRA1B, ADRA2A, CHRNA7, CYP2D6, CYP2C19, CYP2A4, DRD5 and HTR2B). Representation of the significant KEGG pathways identified through the STRING database related to the PASS predicted proteins interacting with (H) A5, (I) C1 and (J) APO. (K) Distribution of the common predicted proteins interacting with A5, C1 and APO based on PASS and Similarity Ensemble Approach (SEA).
Figure 5
Figure 5
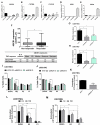
Characterization of predicted targets for aporphine and isoquinoline derivatives. RT-qPCR was used for detection of (A) ABCB1, (B) CYP2B6, (C) CYP2C9, (D) DRD1 and (E) DRD5 mRNA levels in U3017MG, U3031MG, U3034MG and U3024MG cells. (F) Correlation of TMZ response with ABCB1 expression in tumor samples of GBM patients retrieved from http://www.rocplot.org/gbm. Asterisk on probe number indicates measurement by Affymetrix U133plus. GBM patients were categorized according to TMZ response and comparisons were performed with Mann–Whitney U-test (p = 0.0492). (G, H) RT-qPCR was used for detection of ABCB1 after siRNA transfection in U3017MG (G) or U3031MG (H) cells. All the relative expression levels were normalized to GAPDH expression, and calculated using the 2−ΔCt method. Error bars represent SD from three different experiments. (I, J) Viability level of U3017MG (I) or U3031MG (J) cells after treatment for 48 h with APO (25 µM), A5 (30 µM) or C1 (30 µM) of cells transfected with control (siCtrl) or ABCB1-specific siRNAs. Data were normalized against DMSO. (KM) Extracellular ATP levels were measured in in U3017MG upon ABCB1 silencing (K) and in U3017MG (L) and U3031MG (M) cells after treatment with A5 (30 µM) or C1 (30 µM) in the presence or absence of TMZ (150 µM) for 48 h and. Error bars represent SD from at least two biological replicates. Asterisks denote significance as determined by Welch t test, one-way ANOVA multiple comparisons followed by Bonferroni or Dunnet test (post-test) when appropriate; *p < 0.01, **p < 0.001, and ***p < 0.0001.
Figure 6
Figure 6
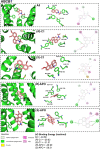
Docking simulations of ABCB1. Docking pose results in 3D and 2D representations of possible interactions of ABCB1 with A5, (R)-C1, (S)-C1, (R)-APO and (S)-APO. Images were created using Discovery Studio and the interactions with the different amino acids (A: position) are represented in different colors: gray (C-H bonds), green (H-bonds), lilac (Pi-Pi bonds), light purple (alkyl bonds) and yellow (pi-sulfur bonds).
Figure 7
Figure 7
Aporphine and isoquinoline derivatives combined with TMZ increase cytotoxicity on GBM cells. Cell viability of U3017MG (A), U3031MG (B) and U3034MG (C) treated with APO (25 µM), A5 (30 µM) or C1 (30 µM) in the absence or presence of TMZ (150 µM) for 48 h was determined using the PrestoBlue reagent and normalized according to vehicle-treated control cells (DMSO). Mitochondrial transmembrane potential of (D) U3017MG and (E) U3031MG treated with A5 or C1 in the presence or absence of TMZ for 48 h was assessed by MitoTracker CMXROS and normalized against the vehicle-treated control cells (DMSO). (F) Immunoblot of cleaved caspase-3 and pH2A.X in U3017MG cells treated with A5 or C1 combined or not with TMZ for 48 h. β-Actin was used as loading control and molecular mass (kDa) markers are indicated along with densitometric values of normalized band intensity. The grouping of blots was cropped from different parts of the same gel. RT-qPCR was used for detection of (G, H) CDKN1A mRNA levels in (G) U3017MG and (H) U3034MG cells treated with A5 or C1 combined or not with TMZ for 48 h. (I, J) RT-qPCR was used for detection of (I) BECN1 and (J) BIM in U3034MG cells treated with A5 or C1 combined or not with TMZ for 48 h. All the relative expression levels were normalized to GAPDH expression and calculated using the 2−ΔΔCt method. Error bars represent SD from three biological replicates and p values were calculated according to the two-way ANOVA test followed by Bonferroni (post-test); *p < 0.05, **p < 0.01, ***p < 0.001.

Similar articles

Cited by

References

    1. Weller M, et al. EANO guideline for the diagnosis and treatment of anaplastic gliomas and glioblastoma. Lancet Oncol. 2011;15:e395–e403. doi: 10.1016/S1470-2045(14)70011-7. - DOI - PubMed
    1. Furnari F, et al. Malignant astrocytic glioma: Genetics, biology, and paths to treatment. Genes Dev. 2007;21:2683–2710. doi: 10.1101/gad.1596707. - DOI - PubMed
    1. Mitchell K, et al. The evolution of the cancer stem cell state in glioblastoma: Emerging insights into the next generation of functional interactions. Neuro. Oncol. 2021;23:199–213. doi: 10.1093/neuonc/noaa259. - DOI - PMC - PubMed
    1. Chen J, et al. A restricted cell population propagates glioblastoma growth after chemotherapy. Nature. 2012;488:522–526. doi: 10.1038/nature11287. - DOI - PMC - PubMed
    1. Wang Q, et al. Tumor evolution of glioma-intrinsic gene expression subtypes associates with immunological changes in the microenvironment. Cancer Cell. 2017;32:42–56. doi: 10.1016/j.ccell.2017.06.003. - DOI - PMC - PubMed

Publication types

LinkOut - more resources