

Socioeconomic status and immune aging in older US adults in the health and retirement study
- PMID: 36472376
- PMCID: PMC9869898
- DOI: 10.1080/19485565.2022.2149465
Socioeconomic status and immune aging in older US adults in the health and retirement study
Abstract
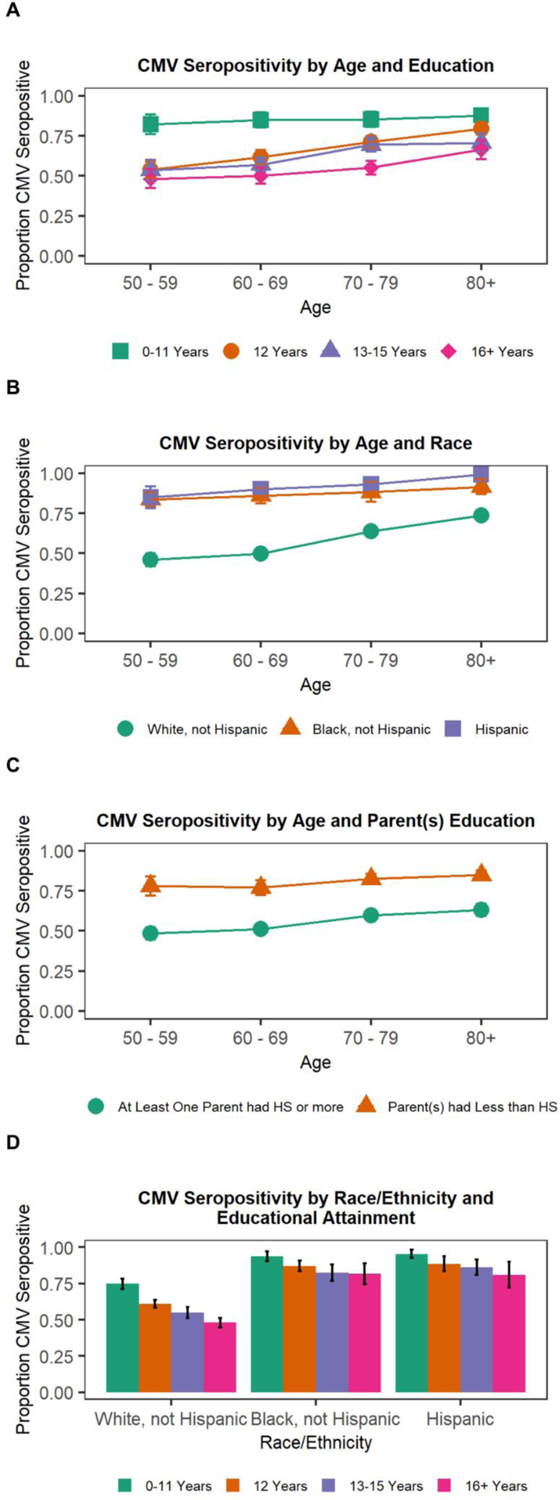
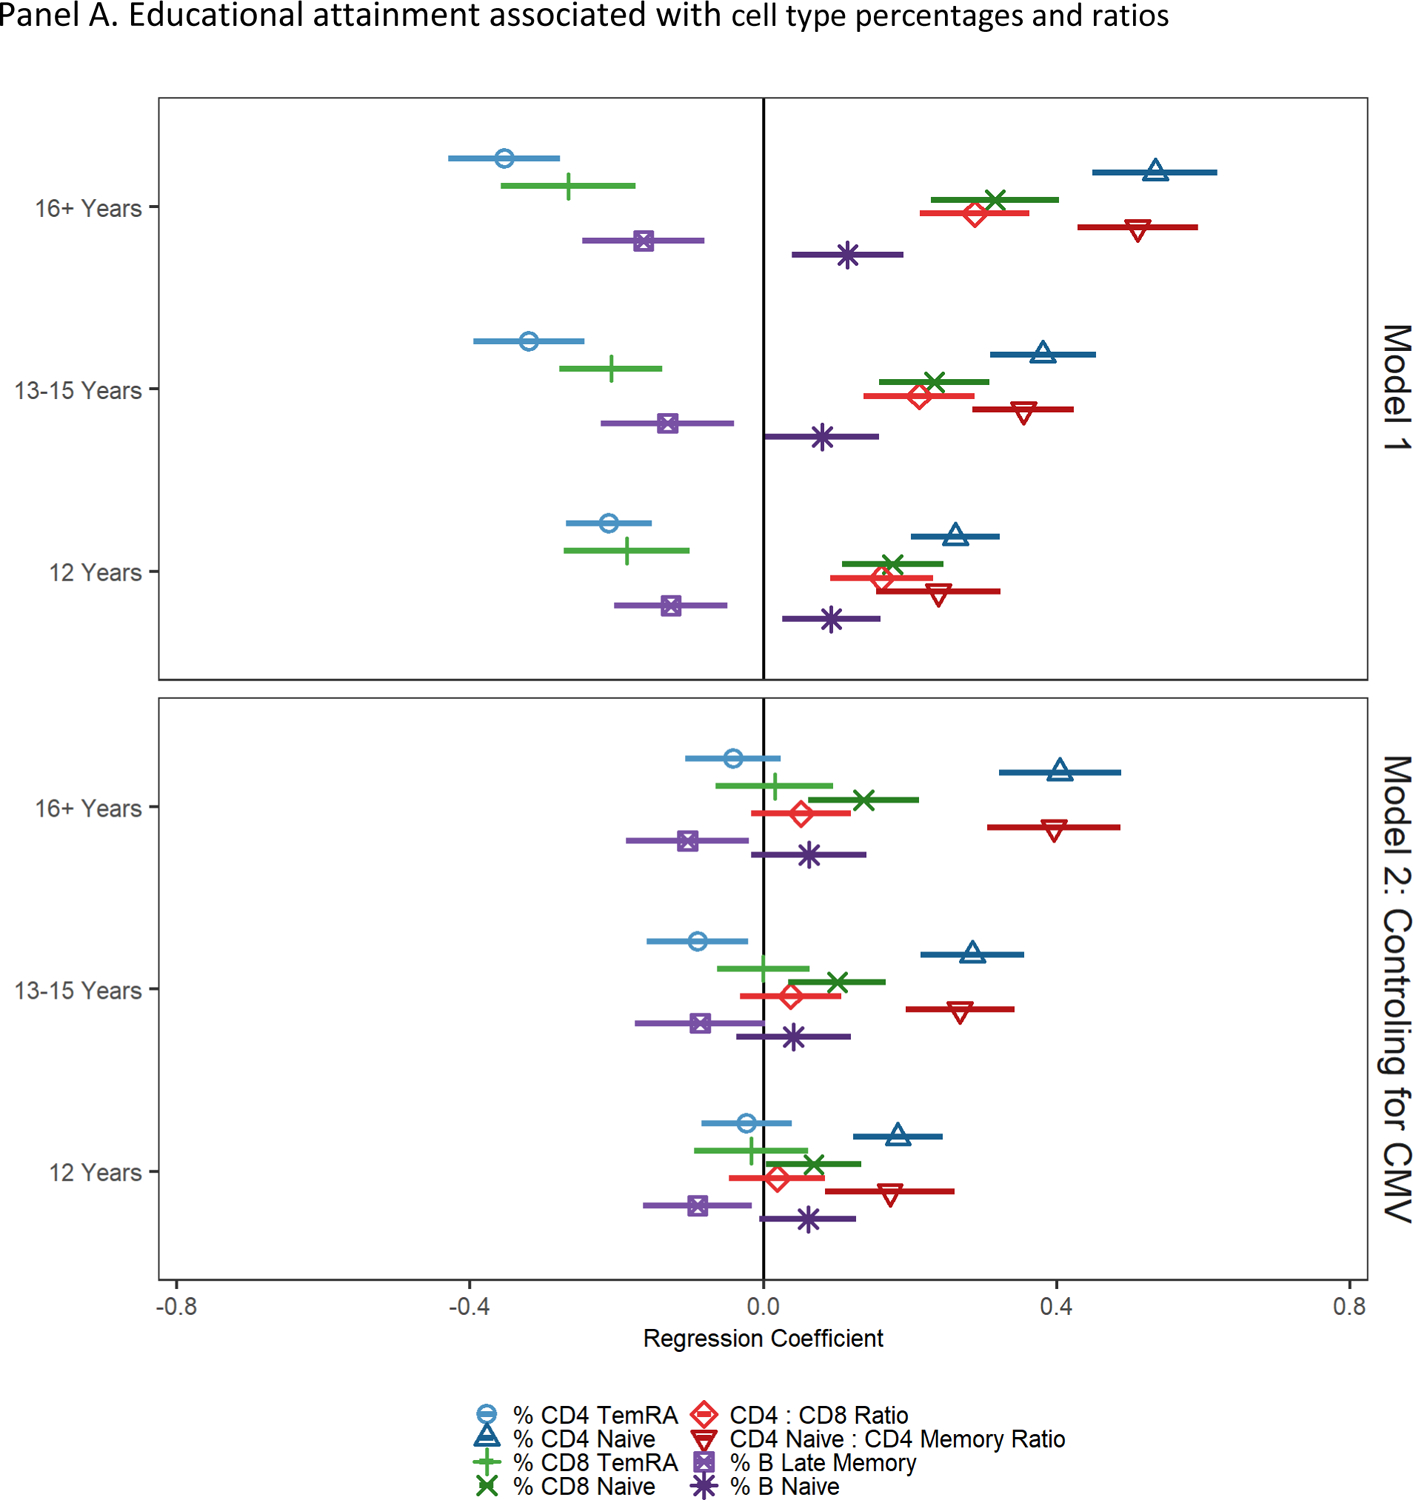
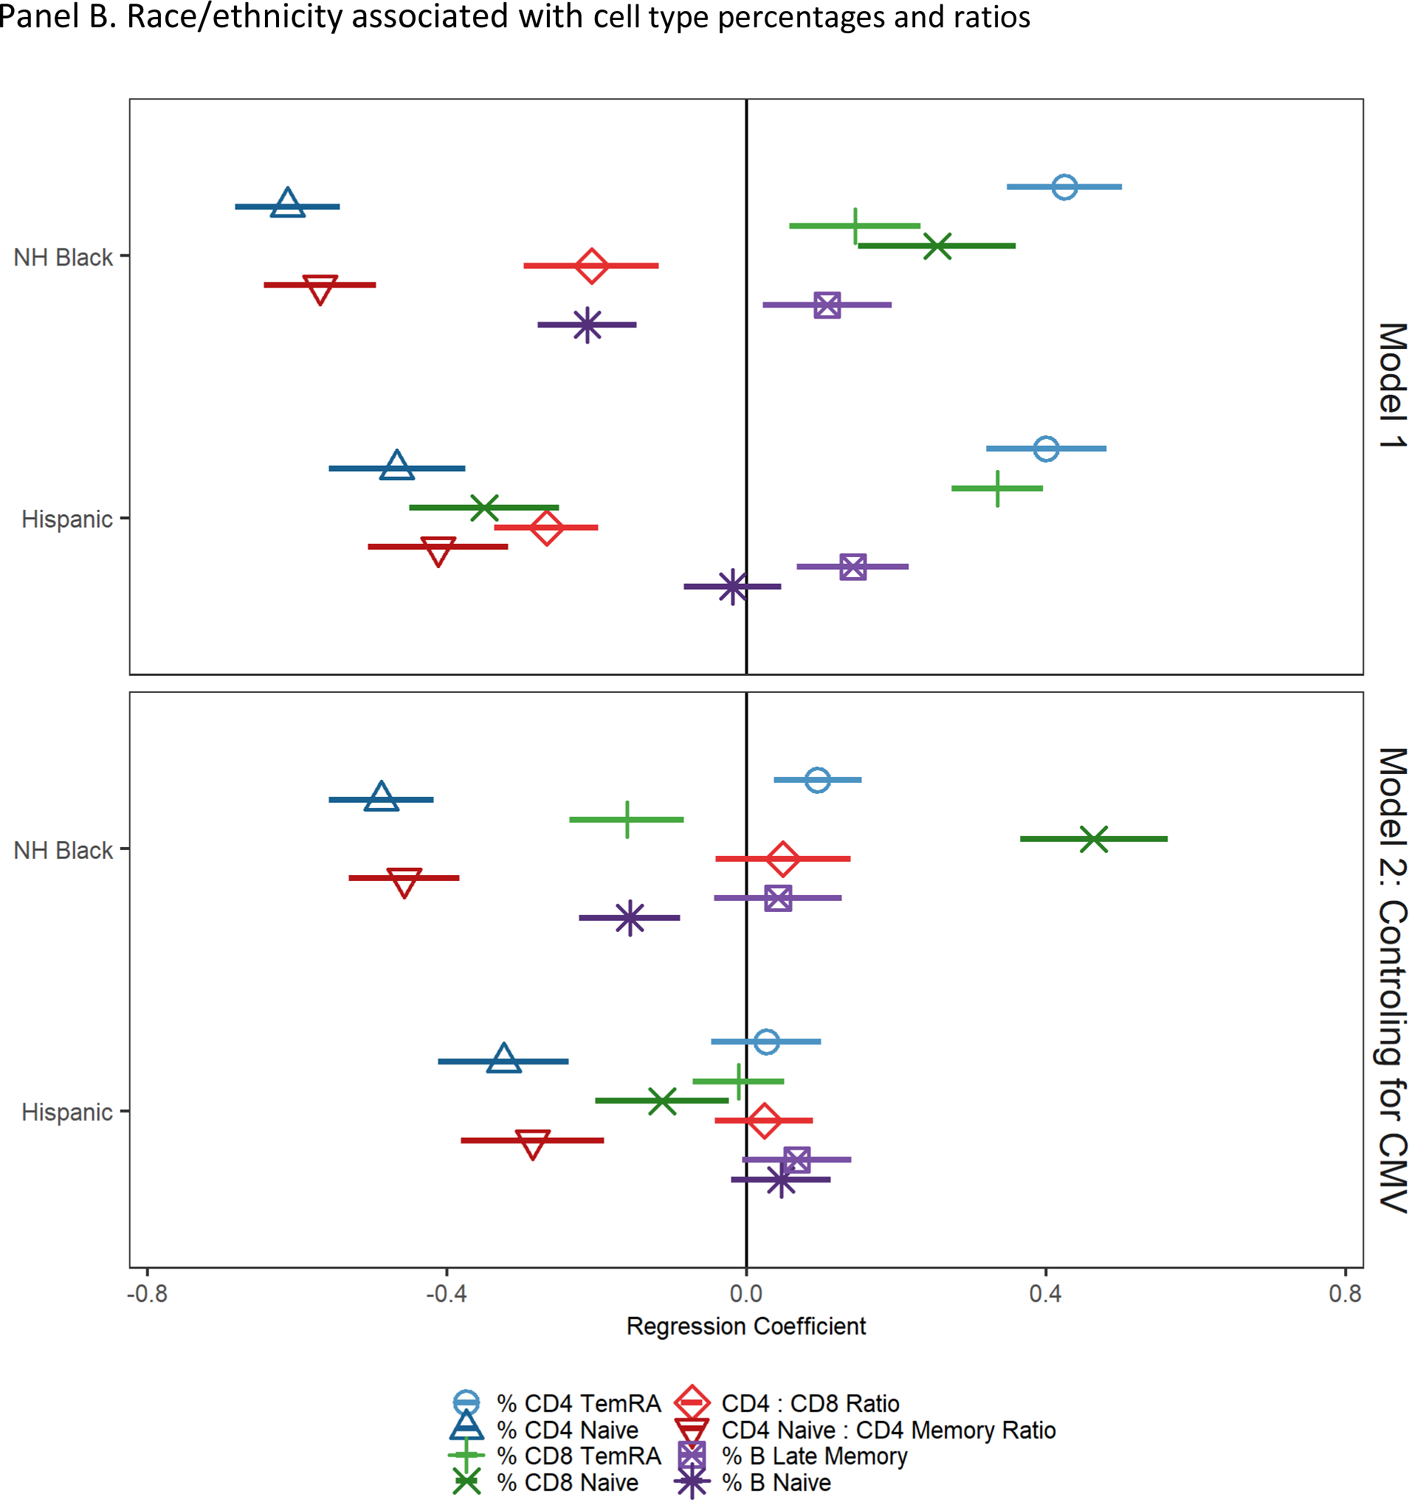
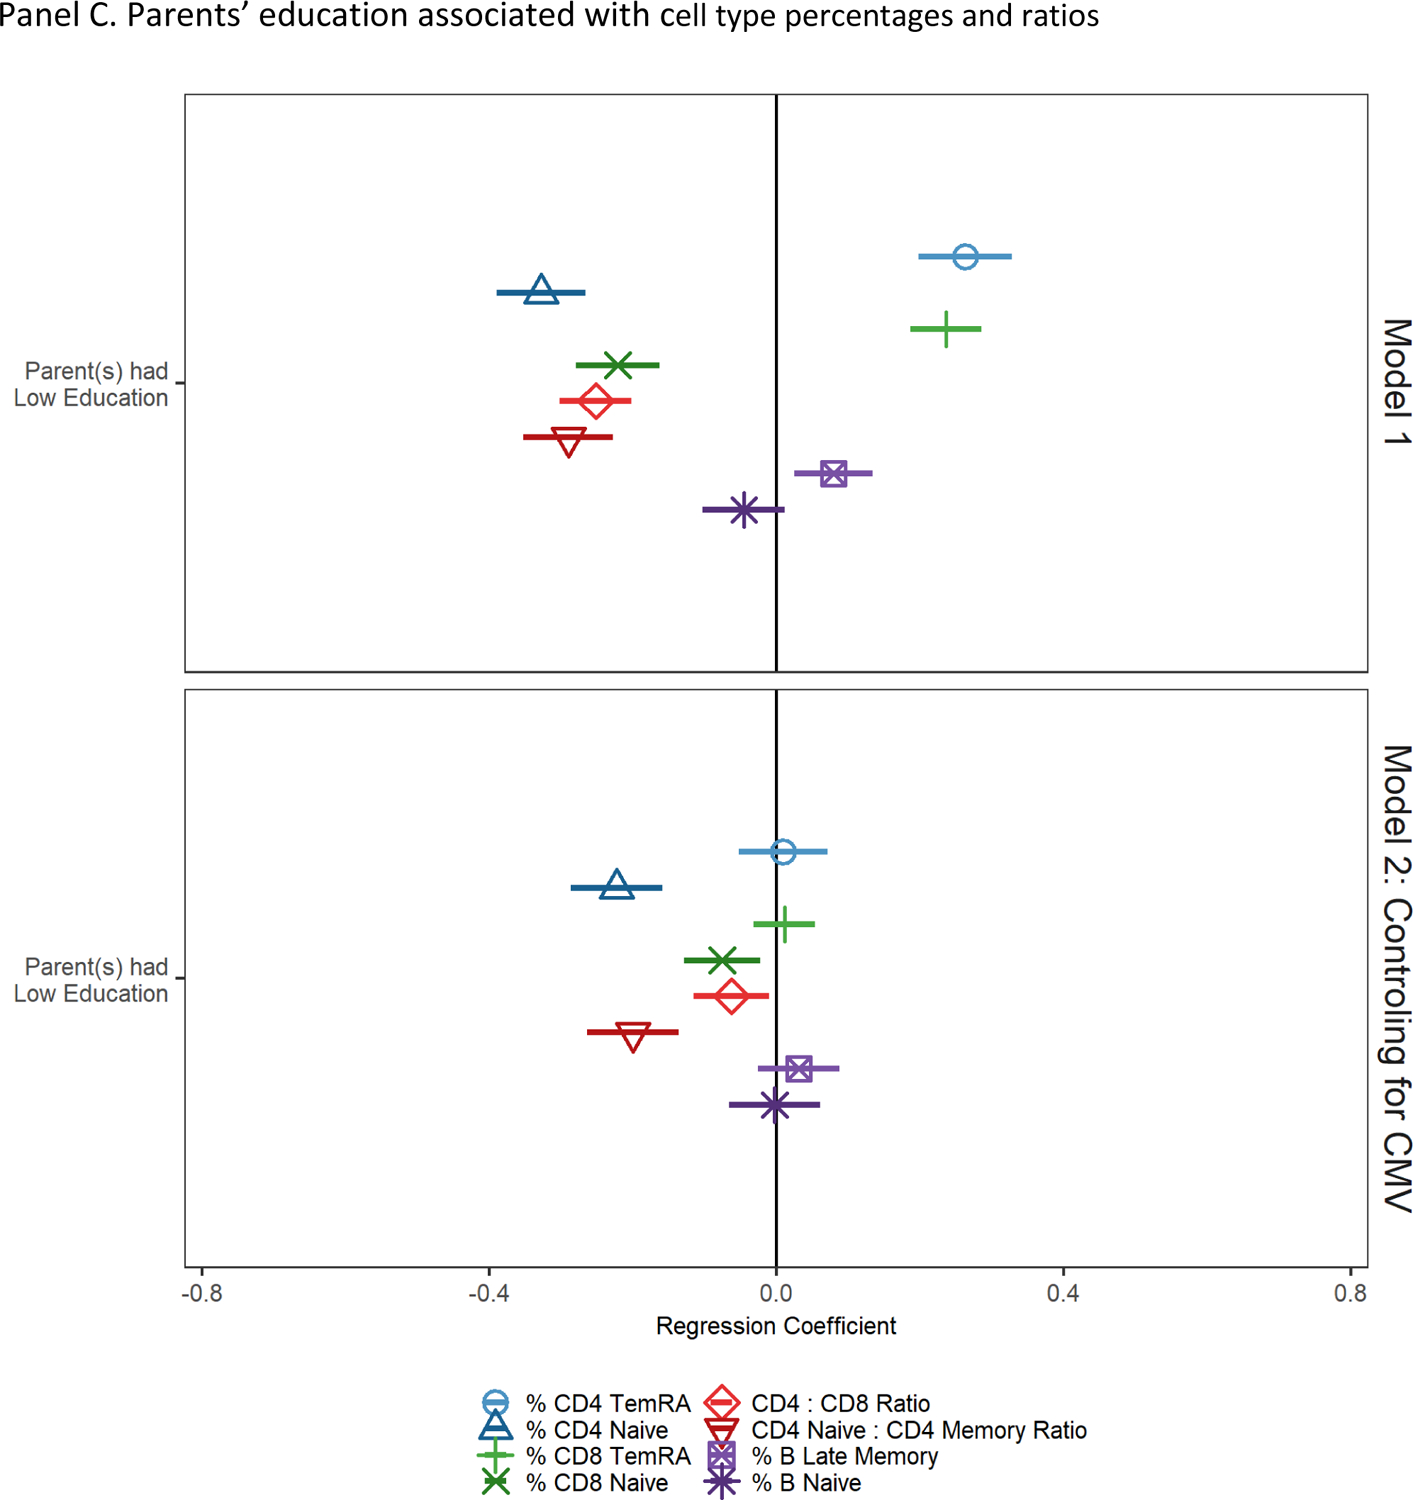
Socioeconomic and demographic factors including educational attainment, race and ethnicity, and childhood socioeconomic status (SES) are powerful predictors of inequalities in aging, morbidity, and mortality. Immune aging, including accumulation of late-differentiated, senescent-like lymphocytes and lower levels of naïve lymphocytes, may play a role in the development of the age-related health inequalities. This study used nationally representative data from more than 9,000 US adults from the Health and Retirement Study to investigate associations between educational attainment, race and ethnicity, and childhood SES and lymphocyte percentages. Respondents with lower educational attainment, Hispanic adults, and those who had a parent with less than a high school education had lymphocyte percentages consistent with more immune aging compared to those with greater educational attainment, non-Hispanic White adults, and respondents who had parents with a high school education, respectively. Associations between education, Hispanic ethnicity, and parents' education and late differentiated senescent-like T lymphocytes (TemRA) and B cells were largely driven by cytomegalovirus (CMV), suggesting it is a factor in observed SES inequalities in immunosenescence. Naïve T lymphocytes may be particularly affected by socioeconomic position and may therefore be of particular interest to research interested in inequalities in health and aging.
Conflict of interest statement
Conflict of Interest Disclosure
The authors report no conflict of interest.
Figures
Similar articles
-
Life Course Socioeconomic Disadvantage and the Aging Immune System: Findings From the Health and Retirement Study.J Gerontol B Psychol Sci Soc Sci. 2021 Jun 14;76(6):1195-1205. doi: 10.1093/geronb/gbaa144. J Gerontol B Psychol Sci Soc Sci. 2021. PMID: 32880643 Free PMC article.
-
Blacks' Diminished Health Returns of Educational Attainment: Health and Retirement Study.J Med Res Innov. 2020;4(2):e000212. doi: 10.32892/jmri.212. Epub 2020 May 31. J Med Res Innov. 2020. PMID: 34966877
-
Educational Attainment and Self-Rated Oral Health among American Older Adults: Hispanics' Diminished Returns.Dent J (Basel). 2019 Oct 1;7(4):97. doi: 10.3390/dj7040097. Dent J (Basel). 2019. PMID: 31581515 Free PMC article.
-
[Socioeconomic inequalities in health in later life].Z Gerontol Geriatr. 2019 Feb;52(Suppl 1):91-99. doi: 10.1007/s00391-018-01487-y. Epub 2018 Dec 19. Z Gerontol Geriatr. 2019. PMID: 30569288 Review. German.
-
Co-benefits from health and health systems to education.Health Policy. 2024 Apr;142:105016. doi: 10.1016/j.healthpol.2024.105016. Epub 2024 Feb 16. Health Policy. 2024. PMID: 38394700 Review.
Cited by
-
Personality and aging-related immune phenotype.Psychoneuroendocrinology. 2023 Jul;153:106113. doi: 10.1016/j.psyneuen.2023.106113. Epub 2023 Apr 17. Psychoneuroendocrinology. 2023. PMID: 37120948 Free PMC article.
-
Socioeconomic status is negatively associated with immunosenescence but positively associated with inflammation among middle-aged women in Cebu, Philippines.Brain Behav Immun. 2024 Jan;115:101-108. doi: 10.1016/j.bbi.2023.10.003. Epub 2023 Oct 10. Brain Behav Immun. 2024. PMID: 37820972 Free PMC article.
-
Chronic Stress and Latent Virus Reactivation: Effects on Immune Aging, Chronic Disease Morbidity, and Mortality.J Gerontol B Psychol Sci Soc Sci. 2023 Oct 9;78(10):1707-1716. doi: 10.1093/geronb/gbad087. J Gerontol B Psychol Sci Soc Sci. 2023. PMID: 37294880 Free PMC article.
-
Socioeconomic inequalities in early adulthood disrupt the immune transcriptomic landscape via upstream regulators.Sci Rep. 2024 Jan 13;14(1):1255. doi: 10.1038/s41598-024-51517-6. Sci Rep. 2024. PMID: 38218990 Free PMC article.
-
A population-based study on incidence trends of kidney and renal pelvis cancers in the United States over 2000-2020.Sci Rep. 2024 May 17;14(1):11294. doi: 10.1038/s41598-024-61748-2. Sci Rep. 2024. PMID: 38760399 Free PMC article.
References
Publication types
MeSH terms
Grants and funding
LinkOut - more resources
Full Text Sources