Identification of the miRNA-mRNA regulatory network associated with radiosensitivity in esophageal cancer based on integrative analysis of the TCGA and GEO data
- PMID: 36456979
- PMCID: PMC9714096
- DOI: 10.1186/s12920-022-01392-9
Identification of the miRNA-mRNA regulatory network associated with radiosensitivity in esophageal cancer based on integrative analysis of the TCGA and GEO data
Abstract
Background: The current study set out to identify the miRNA-mRNA regulatory networks that influence the radiosensitivity in esophageal cancer based on the The Cancer Genome Atlas (TCGA) and the Gene Expression Omnibus (GEO) databases.
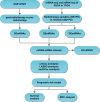
Methods: Firstly, esophageal cancer-related miRNA-seq and mRNA-seq data were retrieved from the TCGA database, and the mRNA dataset of esophageal cancer radiotherapy was downloaded from the GEO database to analyze the differential expressed miRNAs (DEmiRNAs) and mRNAs (DEmRNAs) in radiosensitive and radioresistant samples, followed by the construction of the miRNA-mRNA regulatory network and Gene Ontology and KEGG enrichment analysis. Additionally, a prognostic risk model was constructed, and its accuracy was evaluated by means of receiver operating characteristic analysis.
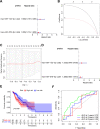
Results: A total of 125 DEmiRNAs and 42 DEmRNAs were closely related to the radiosensitivity in patients with esophageal cancer. Based on 47 miRNA-mRNA interactions, including 21 miRNAs and 21 mRNAs, the miRNA-mRNA regulatory network was constructed. The prognostic risk model based on 2 miRNAs (miR-132-3p and miR-576-5p) and 4 mRNAs (CAND1, ZDHHC23, AHR, and MTMR4) could accurately predict the prognosis of esophageal cancer patients. Finally, it was verified that miR-132-3p/CAND1/ZDHHC23 and miR-576-5p/AHR could affect the radiosensitivity in esophageal cancer.
Conclusion: Our study demonstrated that miR-132-3p/CAND1/ZDHHC23 and miR-576-5p/AHR were critical molecular pathways related to the radiosensitivity of esophageal cancer.
Keywords: AHR; CAND1; Esophageal cancer; Radiosensitivity; ZDHHC23; miR-132-3p; miR-576-5p; miRNA-mRNA regulatory network.
© 2022. The Author(s).
Conflict of interest statement
The authors have no competing interests to declare.
Figures


Similar articles
-
Using biological information to analyze potential miRNA-mRNA regulatory networks in the plasma of patients with non-small cell lung cancer.BMC Cancer. 2022 Mar 21;22(1):299. doi: 10.1186/s12885-022-09281-1. BMC Cancer. 2022. PMID: 35313857 Free PMC article.
-
Differential expression profiles of microRNAs as potential biomarkers for the early diagnosis of lung cancer.Oncol Rep. 2017 Jun;37(6):3543-3553. doi: 10.3892/or.2017.5612. Epub 2017 Apr 28. Oncol Rep. 2017. PMID: 28498428
-
Serum-based six-miRNA signature as a potential marker for EC diagnosis: Comparison with TCGA miRNAseq dataset and identification of miRNA-mRNA target pairs by integrated analysis of TCGA miRNAseq and RNAseq datasets.Asia Pac J Clin Oncol. 2018 Oct;14(5):e289-e301. doi: 10.1111/ajco.12847. Epub 2018 Jan 30. Asia Pac J Clin Oncol. 2018. PMID: 29380534
-
A Novel Three-miRNA Signature Identified Using Bioinformatics Predicts Survival in Esophageal Carcinoma.Biomed Res Int. 2020 Feb 10;2020:5973082. doi: 10.1155/2020/5973082. eCollection 2020. Biomed Res Int. 2020. PMID: 32104700 Free PMC article.
-
Construction of Prognostic Model and miRNA-mRNA Regulatory Network for Lung Squamous Cell Carcinoma.Altern Ther Health Med. 2024 Feb;30(2):183-187. Altern Ther Health Med. 2024. PMID: 37856813
Cited by
-
Integrated multiomics analysis and machine learning refine molecular subtypes and prognosis for muscle-invasive urothelial cancer.Mol Ther Nucleic Acids. 2023 Jun 5;33:110-126. doi: 10.1016/j.omtn.2023.06.001. eCollection 2023 Sep 12. Mol Ther Nucleic Acids. 2023. PMID: 37449047 Free PMC article.
-
Pharmacological impact of microRNAs in head and neck squamous cell carcinoma: Prevailing insights on molecular pathways, diagnosis, and nanomedicine treatment.Front Pharmacol. 2023 May 3;14:1174330. doi: 10.3389/fphar.2023.1174330. eCollection 2023. Front Pharmacol. 2023. PMID: 37205904 Free PMC article. Review.
-
Peroxisome proliferator-activated receptors regulate the progression and treatment of gastrointestinal cancers.Front Pharmacol. 2023 Mar 21;14:1169566. doi: 10.3389/fphar.2023.1169566. eCollection 2023. Front Pharmacol. 2023. PMID: 37025484 Free PMC article. Review.
-
Genetic profiling in radiotherapy: a comprehensive review.Front Oncol. 2024 Jul 26;14:1337815. doi: 10.3389/fonc.2024.1337815. eCollection 2024. Front Oncol. 2024. PMID: 39132508 Free PMC article. Review.
-
High expression of NXPH4 correlates with poor prognosis, metabolic reprogramming, and immune infiltration in colon adenocarcinoma.J Gastrointest Oncol. 2024 Apr 30;15(2):641-667. doi: 10.21037/jgo-23-956. Epub 2024 Apr 29. J Gastrointest Oncol. 2024. PMID: 38756632 Free PMC article.
References
-
- Short MW, Burgers KG, Fry VT. Esophageal cancer. Am Fam Phys. 2017;95(1):22–8. - PubMed
MeSH terms
Substances
LinkOut - more resources
Full Text Sources
Medical

