

The Effects of Antibiotic Combination Treatments on Pseudomonas aeruginosa Tolerance Evolution and Coexistence with Stenotrophomonas maltophilia
- PMID: 36453898
- PMCID: PMC9769631
- DOI: 10.1128/spectrum.01842-22
The Effects of Antibiotic Combination Treatments on Pseudomonas aeruginosa Tolerance Evolution and Coexistence with Stenotrophomonas maltophilia
Abstract
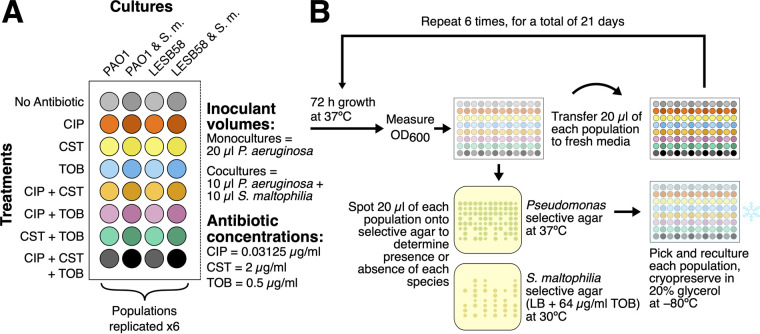
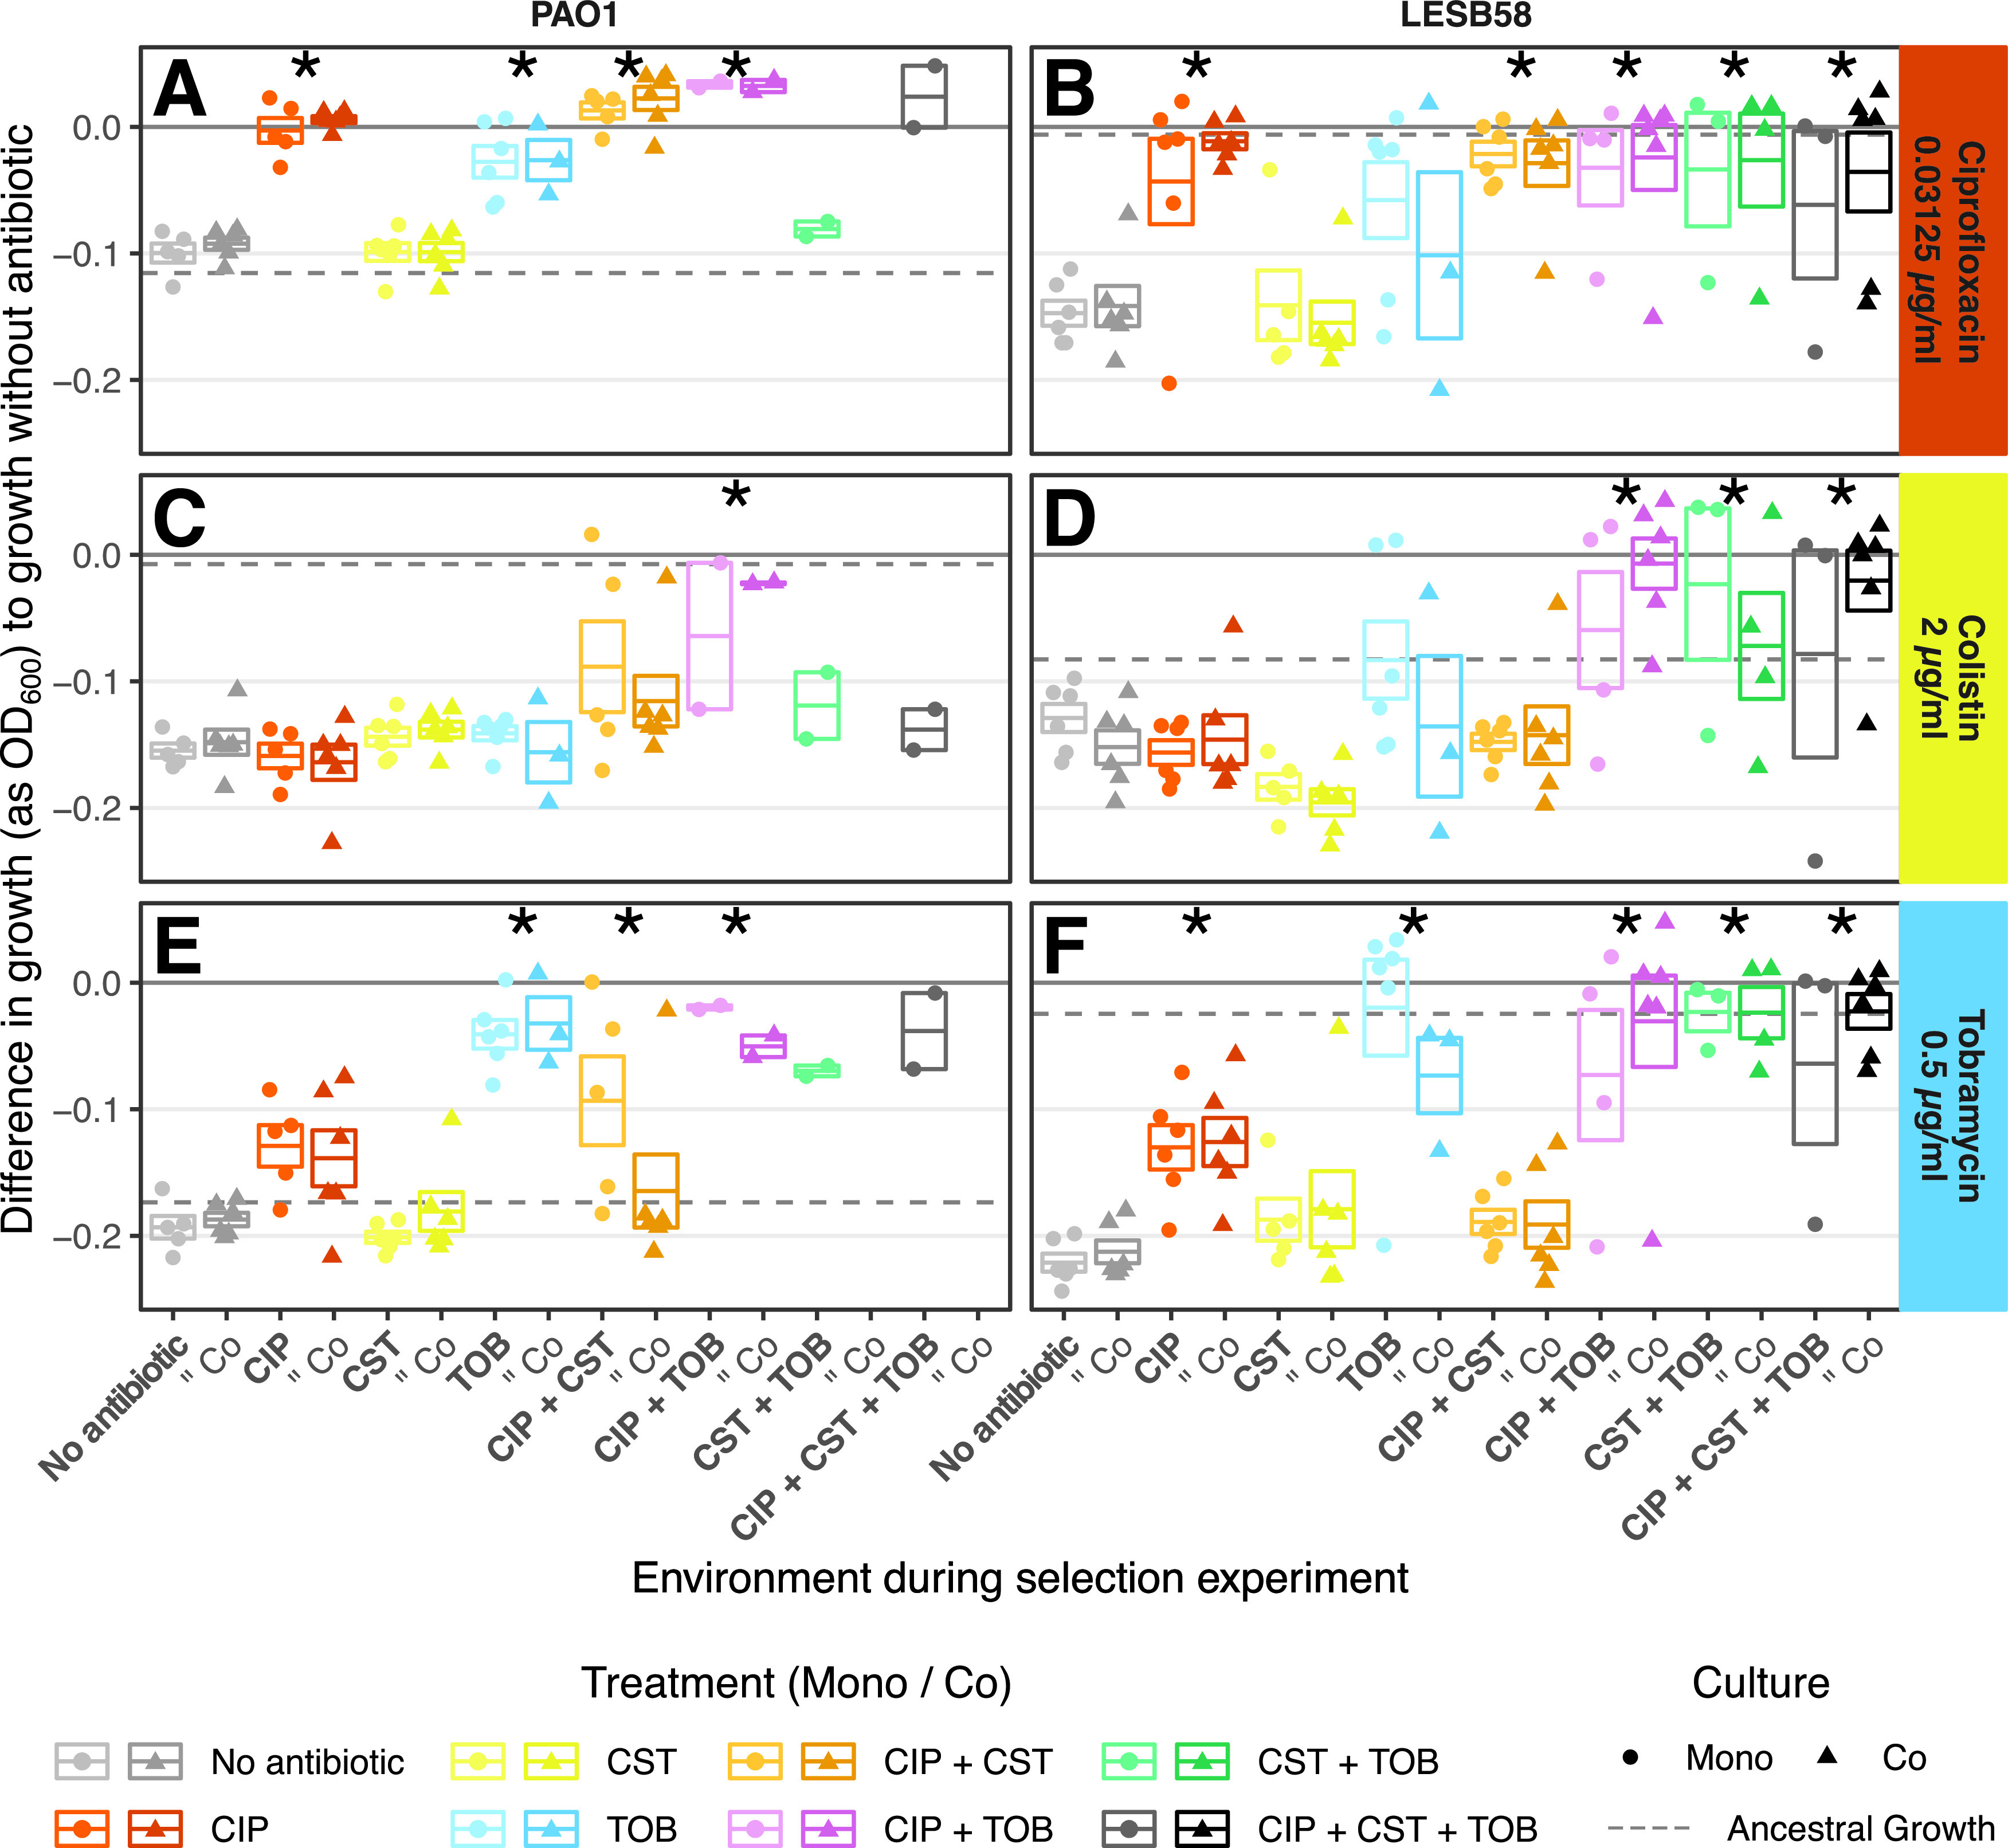
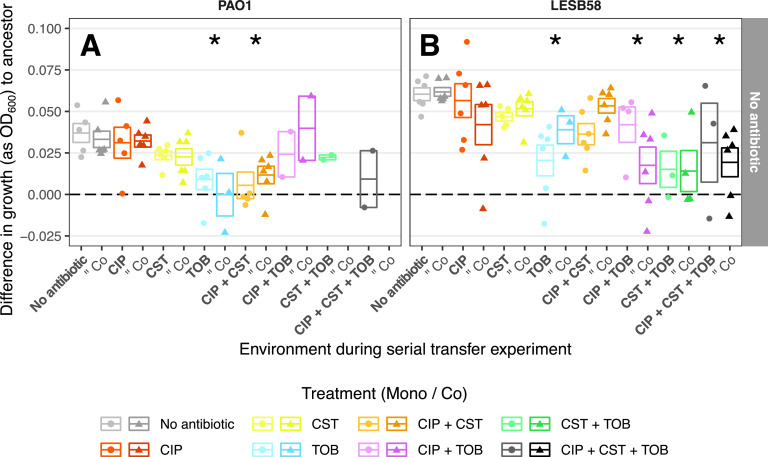
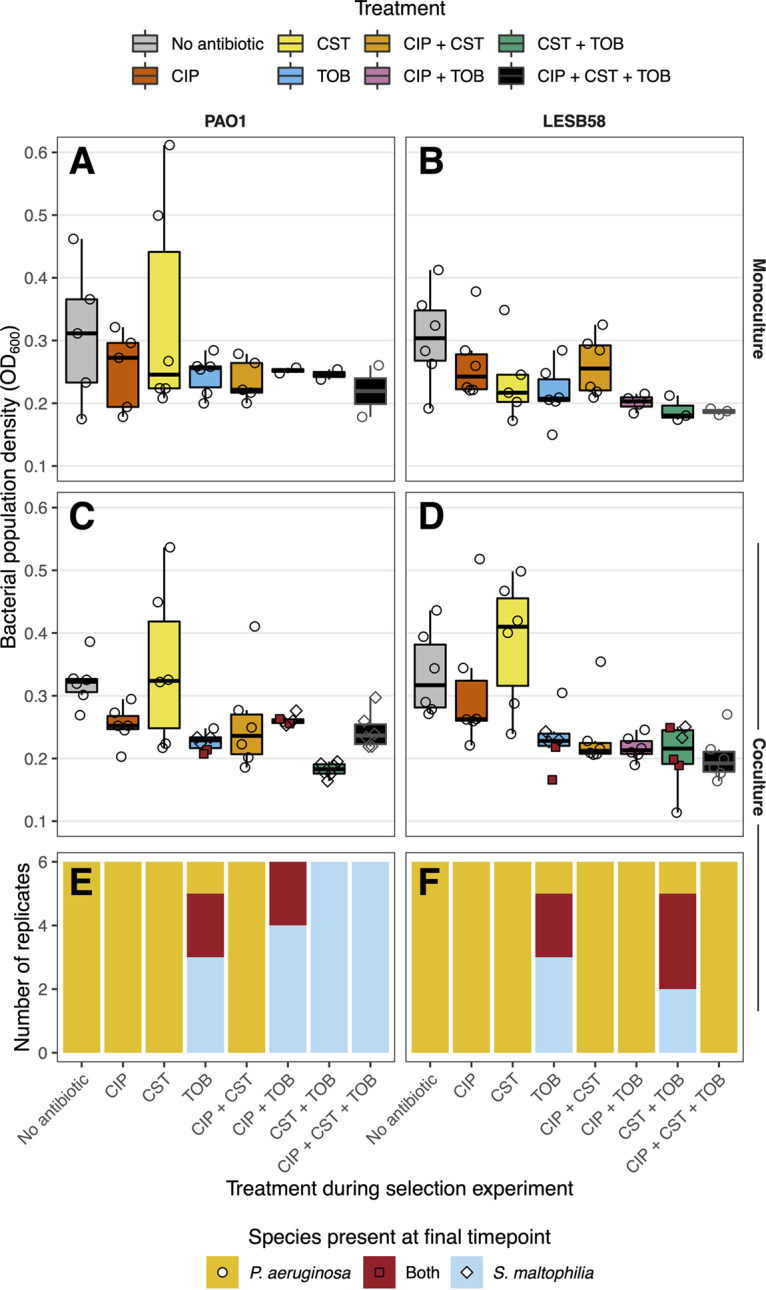
The Pseudomonas aeruginosa bacterium is a common pathogen of cystic fibrosis (CF) patients due to its ability to evolve resistance to antibiotics during treatments. While P. aeruginosa resistance evolution is well-characterized in monocultures, it is less well-understood in polymicrobial CF infections. Here, we investigated how exposure to ciprofloxacin, colistin, or tobramycin antibiotics, administered at sub-minimum inhibitory concentration (MIC) doses, both alone and in combination, shaped the tolerance evolution of P. aeruginosa (PAO1 lab and clinical CF LESB58 strains) in the absence and presence of a commonly co-occurring species, Stenotrophomonas maltophilia. The increases in antibiotic tolerances were primarily driven by the presence of that antibiotic in the treatment. We observed a reciprocal cross-tolerance between ciprofloxacin and tobramycin, and, when combined, the selected antibiotics increased the MICs for all of the antibiotics. Though the presence of S. maltophilia did not affect the tolerance or the MIC evolution, it drove P. aeruginosa into extinction more frequently in the presence of tobramycin due to its relatively greater innate tobramycin tolerance. In contrast, P. aeruginosa dominated and drove S. maltophilia extinct in most other treatments. Together, our findings suggest that besides driving high-level antibiotic tolerance evolution, sub-MIC antibiotic exposure can alter competitive bacterial interactions, leading to target pathogen extinctions in multispecies communities. IMPORTANCE Cystic fibrosis (CF) is a genetic condition that results in thick mucus secretions in the lungs that are susceptible to chronic bacterial infections. The bacterial pathogen Pseudomonas aeruginosa is often associated with morbidity in CF and is difficult to treat due to its high resistance to antibiotics. The resistance evolution of Pseudomonas aeruginosa is poorly understood in polymicrobial infections that are typical of CF. To study this, we exposed P. aeruginosa to sublethal concentrations of ciprofloxacin, colistin, or tobramycin antibiotics in the absence and presence of a commonly co-occurring CF species, Stenotrophomonas maltophilia. We found that low-level antibiotic concentrations selected for high-level antibiotic resistance. While P. aeruginosa dominated in most antibiotic treatments, S. maltophilia drove it into extinction in the presence of tobramycin due to an innately higher tobramycin resistance. Our findings suggest that, besides driving high-level antibiotic tolerance evolution, sublethal antibiotic exposure can magnify competition in bacterial communities, which can lead to target pathogen extinctions in multispecies communities.
Keywords: cystic fibrosis; experimental evolution; interspecies interactions.
Conflict of interest statement
The authors declare no conflict of interest.
Figures

Similar articles
-
Antibiotic strategies for eradicating Pseudomonas aeruginosa in people with cystic fibrosis.Cochrane Database Syst Rev. 2014 Nov 10;(11):CD004197. doi: 10.1002/14651858.CD004197.pub4. Cochrane Database Syst Rev. 2014. Update in: Cochrane Database Syst Rev. 2017 Apr 25;4:CD004197. doi: 10.1002/14651858.CD004197.pub5. PMID: 25383937 Updated. Review.
-
Antibiotic strategies for eradicating Pseudomonas aeruginosa in people with cystic fibrosis.Cochrane Database Syst Rev. 2017 Apr 25;4(4):CD004197. doi: 10.1002/14651858.CD004197.pub5. Cochrane Database Syst Rev. 2017. Update in: Cochrane Database Syst Rev. 2023 Jun 2;6:CD004197. doi: 10.1002/14651858.CD004197.pub6. PMID: 28440853 Free PMC article. Updated. Review.
-
Synergistic Activity of Repurposed Peptide Drug Glatiramer Acetate with Tobramycin against Cystic Fibrosis Pseudomonas aeruginosa.Microbiol Spectr. 2022 Aug 31;10(4):e0081322. doi: 10.1128/spectrum.00813-22. Epub 2022 Jun 21. Microbiol Spectr. 2022. PMID: 35727066 Free PMC article.
-
Intravenous or oral antibiotic treatment in adults and children with cystic fibrosis and Pseudomonas aeruginosa infection: the TORPEDO-CF RCT.Health Technol Assess. 2021 Nov;25(65):1-128. doi: 10.3310/hta25650. Health Technol Assess. 2021. PMID: 34806975 Clinical Trial.
-
Pseudomonas aeruginosa Promotes Persistence of Stenotrophomonas maltophilia via Increased Adherence to Depolarized Respiratory Epithelium.Microbiol Spectr. 2023 Feb 14;11(1):e0384622. doi: 10.1128/spectrum.03846-22. Epub 2022 Dec 6. Microbiol Spectr. 2023. PMID: 36472421 Free PMC article.
References
-
- Orenti A, Zolin A, Jung A, van Rens J. 2021. European Cystic Fibrosis Society patient registry annual data report 2019.
-
- UK Cystic Fibrosis Registry. 2021. UK Cystic Fibrosis Registry annual data report 2020.
Publication types
MeSH terms
Substances
Associated data
LinkOut - more resources
Full Text Sources
Medical
Miscellaneous
