. 2022 Nov 15;2(11):100341.
doi: 10.1016/j.crmeth.2022.100341. eCollection 2022 Nov 21.

Derivation of nociceptive sensory neurons from hiPSCs with early patterning and temporally controlled NEUROG2 overexpression

Affiliations

Derivation of nociceptive sensory neurons from hiPSCs with early patterning and temporally controlled NEUROG2 overexpression

William Plumbly et al. Cell Rep Methods. .

Abstract

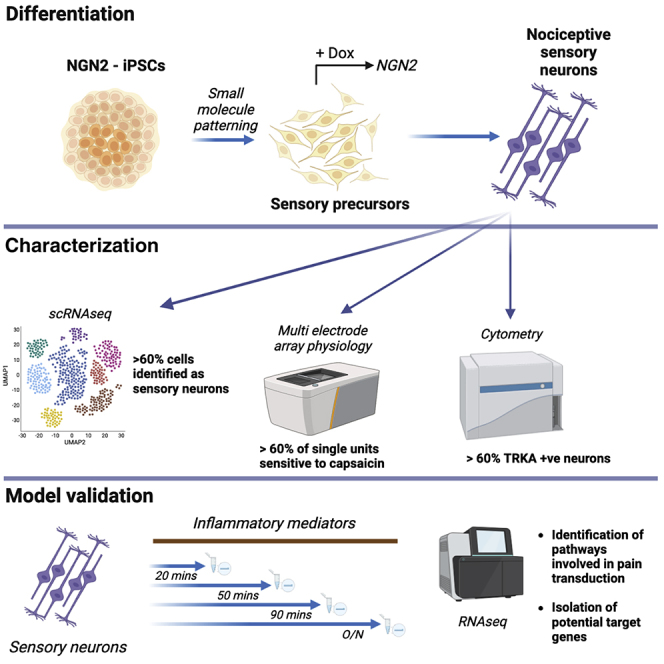
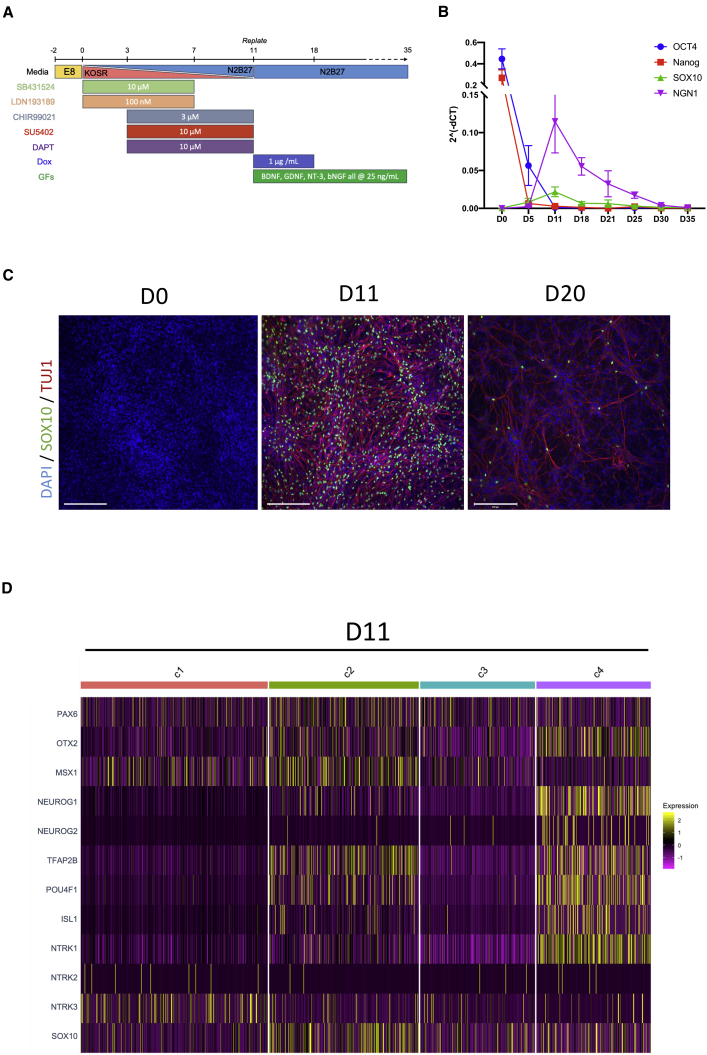
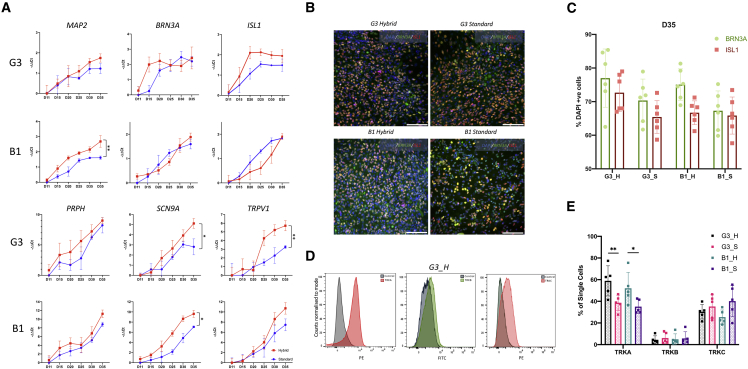
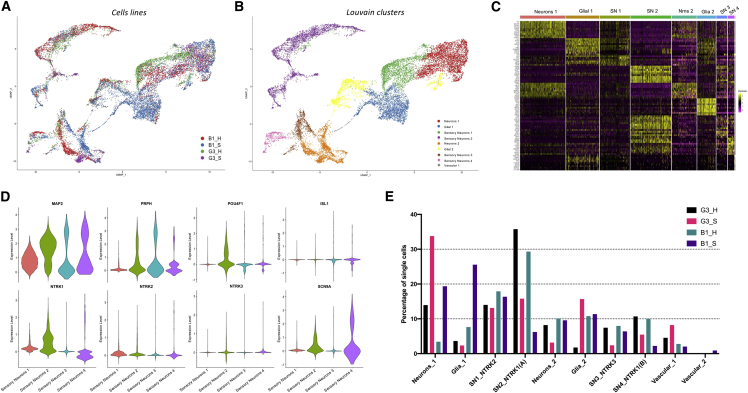
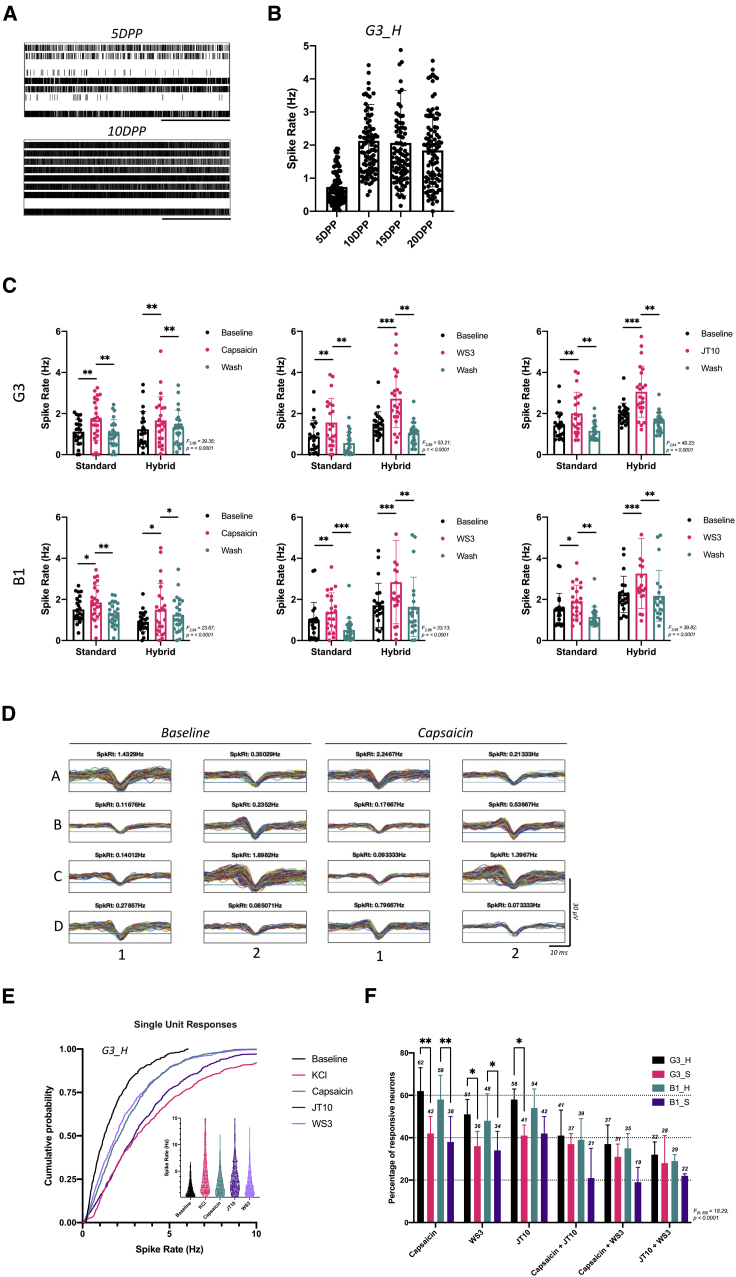
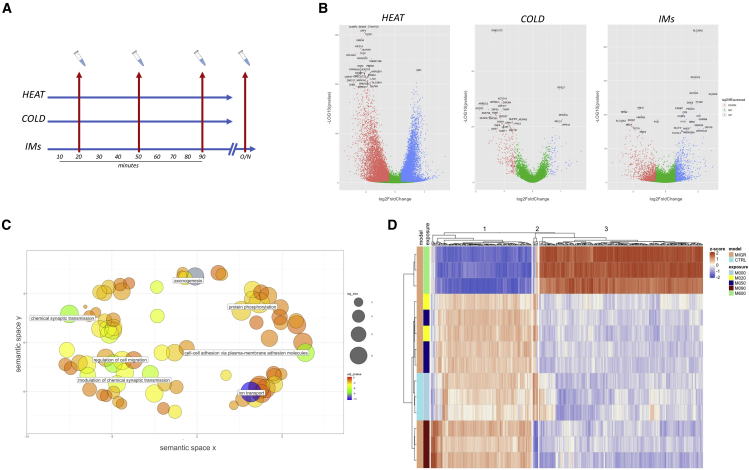
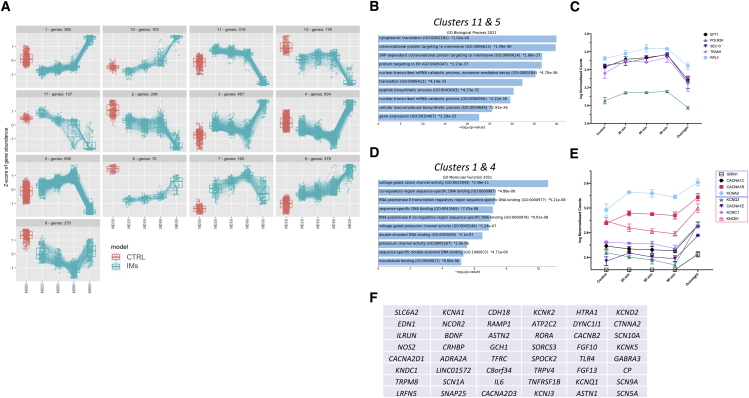
Despite development of protocols to differentiate human pluripotent stem cells (hPSCs), those used to produce sensory neurons remain difficult to replicate and result in heterogenous populations. There is a growing clinical burden of chronic pain conditions, highlighting the need for relevant human cellular models. This study presents a hybrid differentiation method to produce nociceptive sensory neurons from hPSCs. Lines harboring an inducible NEUROG2 construct were patterned toward precursors with small molecules followed by NEUROG2 overexpression. Neurons expressed key markers, including BRN3A and ISL1, with single-cell RNA sequencing, revealing populations of nociceptors expressing SCN9A and TRP channels. Physiological profiling with multi-electrode arrays revealed that neurons responded to noxious stimuli, including capsaicin. Finally, we modeled pain-like states to identify genes and pathways involved in pain transduction. This study presents an optimized method to efficiently produce nociceptive sensory neurons and provides a tool to aid development of chronic pain research.

Keywords: chronic pain models; electrophysiology; human iPSC; iPSC differentiation; multi-electrode array platform; sensory neurons; single-cell RNA-seq.


Conflict of interest statement

E.M. is an employee and shareholder of bit.bio.

Figures

None
Graphical abstract
Figure 1
Figure 1
Small-molecule directed generation of sensory neural precursors from human iPSCs (A) Schematic of the optimized differentiation protocol used in the study. (B) Absolute values of early developmental gene expression normalized to housekeeping genes, as determined by qRT-PCR. Data shows means ± SD from 3 differentiations. (C) Representative ICC images highlighting the peak of SOX10 expression on day 11. Scale bars show 200 μm. (D) Heatmap highlighting the normalized expression of key sNPC genes across 4 clusters identified from analyses of single-cell RNA sequencing data of day 11 precursors. Expression data represent normalized and scaled counts.
Figure 2
Figure 2
Comparison of SN differentiation protocols with combined small-molecule patterning and overexpression of NGN2 (A) Gene expression profiles of small-molecule-only differentiations (standard) and hybrid differentiations (hybrid) were compared using qRT-PCR. In all panels, data show means ± SD normalized to housekeeping genes. Values for hybrid cultures were normalized to day 11 of standard culture values. ∗adjusted p < 0.05, ∗∗adjusted p < 0.01 as determined by Sidak’s multiple comparisons tests after two-way ANOVA. (B) Representative ICC images highlighting the expression of BRN3A and ISL1 in cultures of all lines and conditions, performed on day 35. Scale bars show 100 μm. (C) Quantification of immunohistochemistry images. Data shows means ± SD. Dissociated neurons were stained with fluorophore-conjugated antibodies for TRKA, TRKB, and TRKC. (D) Representative histograms of cytometry data for the G3_H condition, showing counts of cell fluorescence for each of the antibodies, normalized to the mode of each distribution. (E) Cytometry data were quantified to provide an estimate of the number of single cells expressing each of the TRK proteins. Data shows means ± SD. ∗adjusted p < 0.05, ∗∗adjusted p < 0.01 as determined by Sidak’s multiple comparisons tests after two-way ANOVA. Data in (A), (C), and (E) comprise results from at least 3 differentiations for each condition.
Figure 3
Figure 3
scRNA-seq characterization of iPSC-derived SNs Cultures were processed for scRNA-seq on day 35. Sample data were analyzed separately before being integrated to create a normalized and controlled dataset. (A and B) UMAP dimension reduction plots of the combined dataset, created from principal-component analysis (PCA) of normalized gene expression. Cells were grouped by the original source sample from which they derived. (B) shows cells grouped by identified clusters, as determined by shared nearest neighbor-based clustering. A total of 10 clusters were identified. (C) An expression heatmap highlighting the normalized expression of the top 10 marker genes identified for each of the 10 clusters. Clusters were assigned a cell type identity based on the differential expression of these markers. (D) Violin plots presenting normalized gene expression of key genes for the cells from all conditions assigned in one of the SN clusters. The proportion of each of the total single cells for each of the conditions was determined based on their assignment to each of the 10 clusters. (E) The percentage of each cell line that was clustered as part of each cell type.
Figure 4
Figure 4
Electrophysiological and pharmacological profiling of SNs derived from human iPSCs Cells were replated on multi-electrode array (MEA) plates on day 11. (A) Raster plot of spontaneous activity of one G3_Hybrid culture (one well of a 96-well plate containing 8 electrodes). Each row represents the response from a single electrode, where each vertical line represents a spike (supra-threshold extracellular potential). The scale bar shows 100 ms. (B) The average spike rate of cells in each well (each dot represents one well). Plots show median spike rates for each time point, and error bars show SD. (C) Cultures were exposed to a panel of agonists to assess the presence of functional TRP channels. Plots present the average spike rate for individual wells before, during, and after exposure to noxious stimuli. Each dot represents the average spike rate for one culture; bars show means for each treatment group, and error bars show SD. ∗adjusted p < 0.05, ∗∗adjusted p < 0.01, ∗∗∗adjusted p < 0.001 as derived from Sidak’s multiple comparisons tests after 2-way repeated-measures ANOVA. (D) Spike shapes recorded for each electrode of a representative culture, where the average spike rate for each is shown above the trace. Horizontal lines in each show the spike threshold for each electrode. (E) The response of single units before and during treatments was analyzed (G3_H condition). The main plot shows the cumulative probability of firing rates across the conditions, where KCl represents a QC treatment to identify responsive cells. Inset: violin plots of the responses, where each dot shows the firing rate of a single neuron unit. (F) The percentage of single units that responded to each of the treatments. Data show means and error bars show SD. ∗adjusted p < 0.05 and ∗∗adjusted p < 0.01 as determined from Tukeys’s multiple comparisons tests after two-way ANOVA. Data are the result of 267 individual cultures across three independent differentiations.
Figure 5
Figure 5
Investigating pathways associated with pain models using RNA-seq SNs were exposed to heat (45°C), cold (5°C), or an IM model over a total period of 18 h. (A and B) Control samples were taken before stimulus exposure. DEGs were found for all models, with the volcano plots in (B) showing the log2 fold change (x axis) and –log10(p value) (y axis) for each DEG. Red and blue dots represent genes with FDR < 0.05 and a log2 fold change of ±0.6 (classed as significantly differentially expressed). (C) The key enriched pathways for the inflammatory model as determined by analysis using Enrichr, followed by pathway condensation using Revigo. Each bubble shows an enriched pathway, positioned according to its functional relationship to other GO terms; labels denote representative pathways for each associated cluster. The size of bubbles shows the number of genes associated with each pathway term; the color scale shows the normalized adjusted p value of enrichment for each GO term. (D) Heatmap of DEGs determined after exposure to IMs, with samples clustered with regard to exposure time. Normalized gene expression changes for each gene/sample are shown as Z scores.
Figure 6
Figure 6
Gene expression changes in a cellular model of inflammation Significant differentially expressed genes (DEGs) were determined from RNA-seq experiments after exposure of SNs to a model of inflammation. (A) The result of clustering DEGs across the exposure period, based on a top-down divisive hierarchical algorithm. Normalized gene expression is shown as Z scores. The x axis labels represent the exposure time, where M000 = before exposure, M020 = 20 min, M050 = 50 min, M90 = 90 min, and M600 = 18 h. c11 and c5 were characterized by high or increasing early expression and a large decrease overnight, and c1 and c4 were characterized by a surge of expression between 90 min and overnight. (B and D) The results of gene enrichment analyses using the Enrichr platform, based on the genes in those clusters. Bar charts show the top 10 significantly enriched GO pathways, with the values showing the p value for each term. (C and E) Plots of the log of normalized counts for selected key genes. In (E), genes highlighted in the blue box are genes with known associations with chronic pain; those in the orange box are genes with no know pain associations. Data show means ± SD from 3 or 4 replicates. (F) Genes found in the HGPdb that were identified as significantly differentially expressed from the inflammatory model.

Similar articles

Cited by

References

    1. Niculescu A.B., Le-Niculescu H., Levey D.F., Roseberry K., Soe K.C., Rogers J., Khan F., Jones T., Judd S., McCormick M.A., et al. Towards precision medicine for pain: diagnostic biomarkers and repurposed drugs. Mol. Psychiatr. 2019;24:501–522. doi: 10.1038/s41380-018-0345-5. - DOI - PMC - PubMed
    1. Marmigère F., Ernfors P. Specification and connectivity of neuronal subtypes in the sensory lineage. Nat. Rev. Neurosci. 2007;8:114–127. doi: 10.1038/nrn2057. - DOI - PubMed
    1. Ventéo S., Desiderio S., Cabochette P., Deslys A., Carroll P., Pattyn A. Neurog2-Deficiency uncovers a critical period of cell fate plasticity and vulnerability among neural crest-derived somatosensory progenitors. SSRN Electron. J. 2019 doi: 10.2139/ssrn.3409456. - DOI - PubMed
    1. Macpherson L.J., Dubin A.E., Evans M.J., Marr F., Schultz P.G., Cravatt B.F., Patapoutian A. Noxious compounds activate TRPA1 ion channels through covalent modification of cysteines. Nature. 2007;445:541–545. doi: 10.1038/nature05544. - DOI - PubMed
    1. Martins D., Tavares I., Morgado C. hotheaded”: the role of TRPV1 in brain functions. Neuropharmacology. 2014;85:151–157. doi: 10.1016/j.neuropharm.2014.05.034. - DOI - PubMed

Publication types

MeSH terms

Substances