. 2023 Feb 1;133(3):e164946.
doi: 10.1172/JCI164946.

Recombinant vesicular stomatitis virus-vectored vaccine induces long-lasting immunity against Nipah virus disease

Affiliations

Recombinant vesicular stomatitis virus-vectored vaccine induces long-lasting immunity against Nipah virus disease

Courtney Woolsey et al. J Clin Invest. .

Abstract

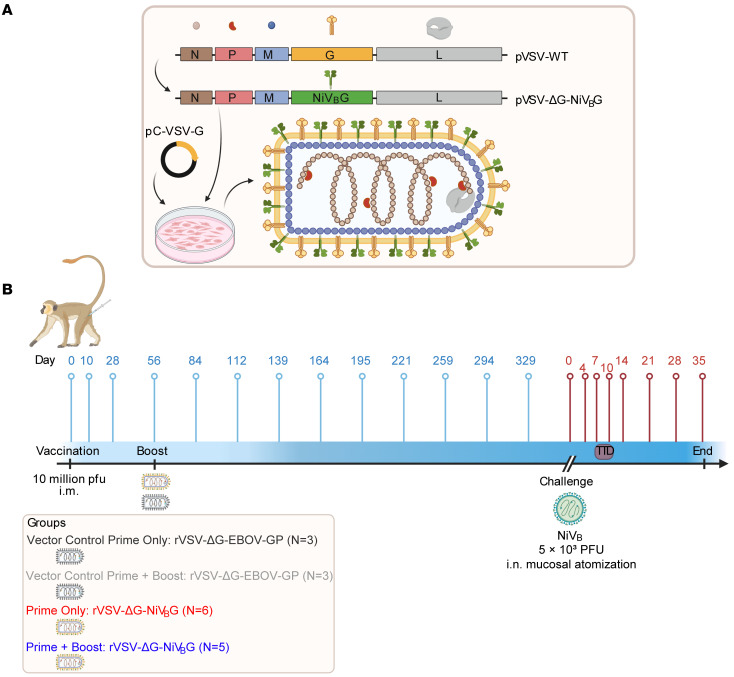
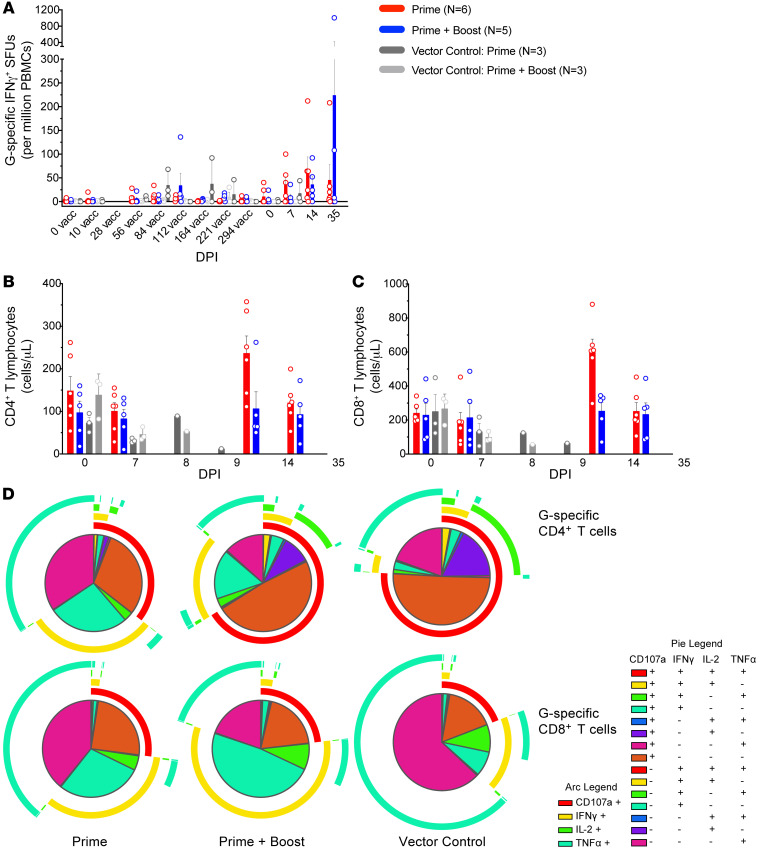
The emergence of the novel henipavirus, Langya virus, received global attention after the virus sickened over three dozen people in China. There is heightened concern that henipaviruses, as respiratory pathogens, could spark another pandemic, most notably the deadly Nipah virus (NiV). NiV causes near-annual outbreaks in Bangladesh and India and induces a highly fatal respiratory disease and encephalitis in humans. No licensed countermeasures against this pathogen exist. An ideal NiV vaccine would confer both fast-acting and long-lived protection. Recently, we reported the generation of a recombinant vesicular stomatitis virus-based (rVSV-based) vaccine expressing the NiV glycoprotein (rVSV-ΔG-NiVBG) that protected 100% of nonhuman primates from NiV-associated lethality within a week. Here, to evaluate the durability of rVSV-ΔG-NiVBG, we vaccinated African green monkeys (AGMs) one year before challenge with an uniformly lethal dose of NiV. The rVSV-ΔG-NiVBG vaccine induced stable and robust humoral responses, whereas cellular responses were modest. All immunized AGMs (whether receiving a single dose or prime-boosted) survived with no detectable clinical signs or NiV replication. Transcriptomic analyses indicated that adaptive immune signatures correlated with vaccine-mediated protection. While vaccines for certain respiratory infections (e.g., COVID-19) have yet to provide durable protection, our results suggest that rVSV-ΔG-NiVBG elicits long-lasting immunity.

Keywords: Adaptive immunity; Infectious disease; Vaccines.


Conflict of interest statement

Conflict of interest: SLF, RWC, and TWG are listed on a provisional US patent application for henipavirus vaccines (US serial no. 63/248,055).

Figures

Figure 1
Figure 1. Vector and experimental design for the vaccination and challenge of AGMs.
(A) Schematic of pVSV-WT and pVSV-ΔG-NiVBG genomes. The NiVBG gene (green box) was cloned into the native VSV G gene site (yellow box) in a plasmid containing the entire rVSV genome and recovered in VSV G–complemented (pC-VSV-G) baby hamster kidney cells. Intergenic and 3′- or 5′-untranslated genomic regions are indicated by black lines. (B) Seventeen AGMs were randomized into 4 groups: prime only (n = 6), prime + boost (n = 5), vector control prime (n = 3), and vector control prime + boost (n = 3) groups. Each group received a 1 × 10⁷ PFU i.m. dose of rVSV-ΔG-NiVBG vaccine or a nonspecific rVSV vector control expressing the Ebola virus glycoprotein (rVSV-ΔG-EBOV-GP). The prime + boost and vector control prime + boost groups received an additional dose at 56 days after vaccination. Blood samples were collected monthly at days 0, 10, 28, 56, 84, 112, 139, 164, 195, 221, 259, 294, 329, and 369 (0). AGMs were subsequently challenged 1 year later with an intranasal dose of 5 × 10³ PFU of NiVB delivered by Mucosal Atomization Device. Post-exposure blood samples were collected at 4, 7, 10, 14, 21, 28, terminally, and/or 35 days. Blue pins indicate vaccination-phase sampling time points, whereas red lines denote challenge-phase sampling time points. N, nucleoprotein; P, phosphoprotein; M, matrix protein; G, glycoprotein; EBOV, Ebola virus.
Figure 2
Figure 2. Survival and health of vaccinated AGMs exposed to NiVB.
(A) Kaplan-Meier survival curves of vaccinated AGMs exposed to NiVB for prime only (n = 6; red lines), prime + boost (n = 5; blue lines), vector control prime (n = 3; dark gray lines), and vector control prime + boost (n = 3; light gray lines) groups. A statistically significant association (log-rank test; **P < 0.0021) was found between prime and vector control prime, and prime + boost and vector control prime + boost, groups. (B) Clinical scores of individual AGMs vaccinated with rVSV-ΔG-NiVBG or a nonspecific rVSV vector control and challenged 1 year later with NiVB. (C) Respiration rates represent the percentage above or below baseline pre-vaccination values (beats per minute) of individual AGM subjects for each group challenged with NiVB.
Figure 3
Figure 3. Viral loads of immunized AGMs after challenge with NiVB.
Detection of NiVB viral loads in EDTA plasma by plaque assay (A), whole blood by RT-qPCR (B), or tissues by RT-qPCR (C and D) for prime only (rVSV-ΔG-NiVBG; n = 6; red bars), prime + boost (rVSV-ΔG-NiVBG; n = 5; blue open circles), vector control prime (rVSV-ΔG-EBOV-GP; n = 3; dark gray bars), and vector control prime + boost (rVSV-ΔG-EBOV-GP; n = 3; light gray bars) groups. Bars represent the mean value for all members of the group at each time point, and upper error bars represent the SEM. Limit of detection (LOD) for plaque assays is 25 PFU; LOD for RT-qPCR is 1,000 copies/mL. Open circles represent average values from duplicates for individual subjects. Two-way ANOVA with Tukey’s multiple-comparison test; *P < 0.0332, **P < 0.0021, ***P < 0.0002, ****P < 0.0001. CSC, cervical spinal cord.
Figure 4
Figure 4. Pathology of vaccinated and control NiVB-infected AGMs.
Representative photomicrographs of immunohistochemistry (IHC) for anti-NiV antigen (brown) in lung (B and D), spleen (F and H), liver (J and L), kidney (N and P), and brain (R and T); and H&E staining of the lung (A and C), spleen (E and G), liver (I and K), kidney (M and O), and brain (Q and S). All photomicrographs were taken at ×20 magnification. Micrographs shown are from positive controls VC-P-3 (A, B, E, F, I, J, M, and N) and VC-P-2 (Q and R). (A) Loss of normal pulmonary alveolar architecture with inflamed and necrotic alveolar septa and flooding of alveolar spaces with fibrin, edema, and hemorrhage. (B) IHC-positive endothelium and mononuclear cells within the alveolar septa and alveolar macrophages. (E) Loss of splenic germinal center architecture with lymphocytolysis, syncytial cell formation, and hemorrhage. (F) IHC-positive mononuclear cells concentrated in the white pulp and scattered within the red pulp. (I) Sinusoidal leukocytosis. (J) IHC positivity of sinusoidal lining cells and Kupffer cells (black arrows). (M) Renal glomerular congestion. (N) Segmental IHC-positive glomerular endothelium and mononuclear cells (black arrow). (Q) Diffuse gliosis of the brainstem. (R) IHC-positive neuronal cells of the brainstem (black arrow). No appreciable immunolabeling or lesions were noted in the lung, spleen, liver, kidney, or brain of representative rVSV-ΔG-NiVBG–surviving AGM P-3 (C, D, G, H, K, L, O, P, S, and T).
Figure 5
Figure 5. Humoral responses in vaccinated AGMs.
(A and B) AGM serum samples were tested for circulating NiV G–specific IgG (A) and IgM (B) by indirect ELISA. Line graphs depicting the average reciprocal dilution titer for each group ± SEM (error bars) at each time point are shown. (C) The average anti-NiV neutralizing antibody titer for each group ± SEM (error bars) at each time point. PRNT50 values represent the reciprocal dilution at which plaque counts were reduced by 50% in comparison with control wells. Each group is denoted by line color: prime only (rVSV-ΔG-NiVBG; n = 6; red), prime + boost (rVSV-ΔG-NiVBG; n = 5; blue), vector control prime (rVSV-ΔG-EBOV-GP; n = 3; dark gray), and vector control prime + boost (rVSV-ΔG-EBOV-GP; n = 3; light gray). (D) Correlation plots for respiration rates versus IgG, IgM, and neutralizing antibody levels. G, NiVB glycoprotein; PRNT, plaque reduction neutralization test; vacc, vaccination. Two-way ANOVA with Tukey’s multiple-comparison test; *P < 0.0332, **P < 0.0021, ***P < 0.0002, ****P < 0.0001. A Pearson test was used to determine correlations.
Figure 6
Figure 6. Cellular responses in immunized AGMs.
(A) NiV G–specific IFN-γ+ spot-forming units (SFUs) in PBMCs from vaccinated AGMs for each group. Values were calculated by subtraction of the number of average spots from unstimulated duplicate wells from its respective stimulated counterpart at the corresponding DPI. A single replicate was excluded for 294 days after vaccination for subject P-B-1. (B and C) CD4+ (B) and CD8+ (C) T cell counts in vaccinated AGM PBMCs at each time point. Each group is denoted by the following: prime only (rVSV-ΔG-NiVBG; n = 6; red bars), prime + boost (rVSV-ΔG-NiVBG; n = 5; blue bars), vector control prime (rVSV-ΔG-EBOV-GP; n = 3; dark gray bars), and vector control prime + boost (rVSV-ΔG-EBOV-GP; n = 3; light gray bars). Bars represent the mean value for all members of the group at each time point, and error bars represent the SEM. Open circles represent the average value of duplicates from individual subjects. (D) Pie graphs depicting NiV G–specific CD4+ (top row) and CD8+ T cell (bottom row) cytokine profiles in PBMCs from each respective AGM group. The arcs denote the total percentage of degranulating (red), IFN-γ+ (yellow), IL-2+ (green), and TNF-α+ (teal) T cells. Each slice represents a specific combination of these markers. The vector control groups were combined for this analysis. G, NiVB glycoprotein.
Figure 7
Figure 7. Transcriptional responses in AGMs after challenge with NiVB.
(A) Principal component analysis based on DPI (0, 4, 7, 10/terminal time points) and each group: prime only (rVSV-ΔG-NiVBG; n = 6; yellow), prime + boost (rVSV-ΔG-NiVBG; n = 5; maroon), vector control prime (rVSV-ΔG-EBOV-GP; n = 3; purple), and vector control prime + boost (rVSV-ΔG-EBOV-GP; n = 3; lavender). (B) Overall expression changes for each group at late disease (orange denotes upregulated transcripts; blue denotes downregulated transcripts; black denotes no expression change). (C and D) Heatmaps depicting the topmost downregulated (C) and upregulated (D) transcripts in specifically versus nonspecifically prime-only vaccinated subjects at late disease (Benjamini-Hochberg–adjusted P value < 0.05). A comparison of prime versus boosted subjects was also performed. Dots indicate transcripts mapping to interferon signaling (brown) and adaptive immunity (green) nSolver gene sets. In the heatmaps, red denotes upregulated transcripts, blue denotes downregulated transcripts, and white denotes no expression change. (E) Trend plot depicting overall nSolver-derived cell-type quantities in control and vaccinated (fatal or survivor) cohorts. (F) Pathway enrichment of differentially expressed transcripts (Benjamini-Hochberg–adjusted P value < 0.05) in specifically vaccinated subjects at late disease. Displayed are the mean −log10(P values). A Benjamini-Hochberg test was used to derive adjusted P values. PC1, principal component 1; PC2, principal component 2.

Similar articles

Cited by

References

    1. WHO. Fact Sheets: Nipah Virus. https://www.who.int/news-room/fact-sheets/detail/nipah-virus Updated May 30, 2018. Accessed November 23, 2022.
    1. Luby SP. The pandemic potential of Nipah virus. Antiviral Res. 2013;100(1):38–43. doi: 10.1016/j.antiviral.2013.07.011. - DOI - PubMed
    1. Gómez Román R, et al. Medical countermeasures against henipaviruses: a review and public health perspective. Lancet Infect Dis. 2022;22(1):e13–e27. doi: 10.1016/S1473-3099(21)00400-X. - DOI - PMC - PubMed
    1. Federal Register. Possession, Use, and Transfer of Select Agents and Toxins; Biennial Review (HHS/CDC): Select Agents and Toxins, 42 CFR Part 73. Volume 85, No. 52, p. 15087. https://www.govinfo.gov/content/pkg/FR-2020-03-17/pdf/2020-05477.pdf Updated March 17, 2020. Accessed November 23, 2022.
    1. CDC/US Department of Agriculture. Federal Select Agent Program: HHS and USDA Select Agents and Toxins, 7 CFR Part 331, 9 CFR Part 121, and 42 CFR Part 73. https://www.selectagents.gov/sat/list.htm?CDC_AA_refVal=https%3A%2F%2Fww... Updated August 30, 2022. Accessed November 23, 2022.

Publication types

Supplementary concepts