. 2023 Feb 6;222(2):e202102119.
doi: 10.1083/jcb.202102119. Epub 2022 Nov 29.

GSK3α phosphorylates dynamin-2 to promote GLUT4 endocytosis in muscle cells

Affiliations

GSK3α phosphorylates dynamin-2 to promote GLUT4 endocytosis in muscle cells

Jessica Laiman et al. J Cell Biol. .

Abstract

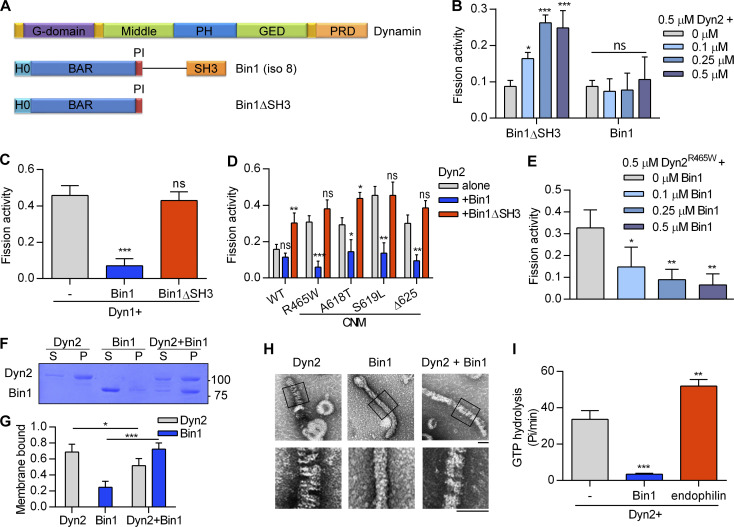
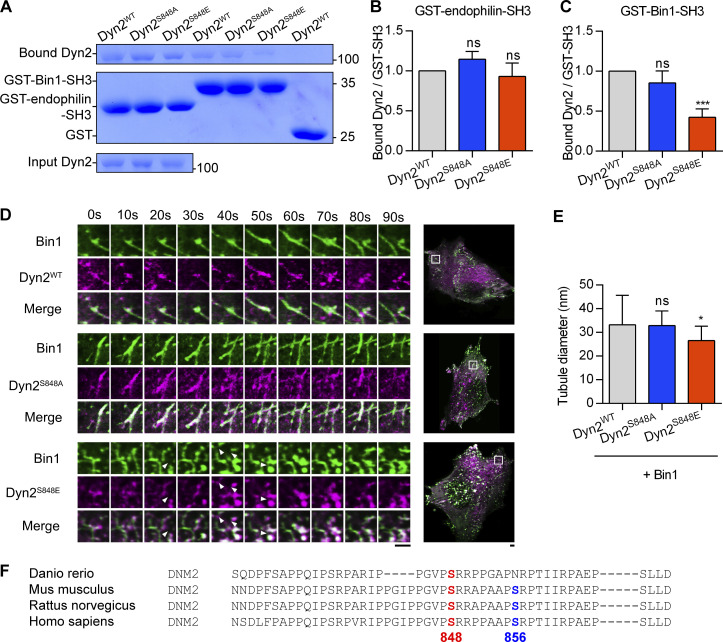
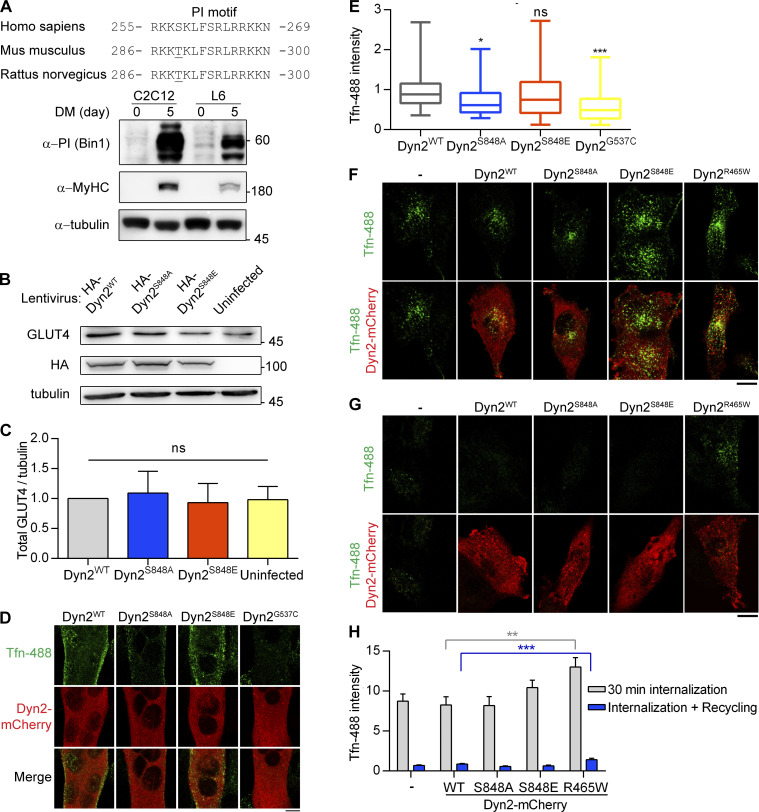
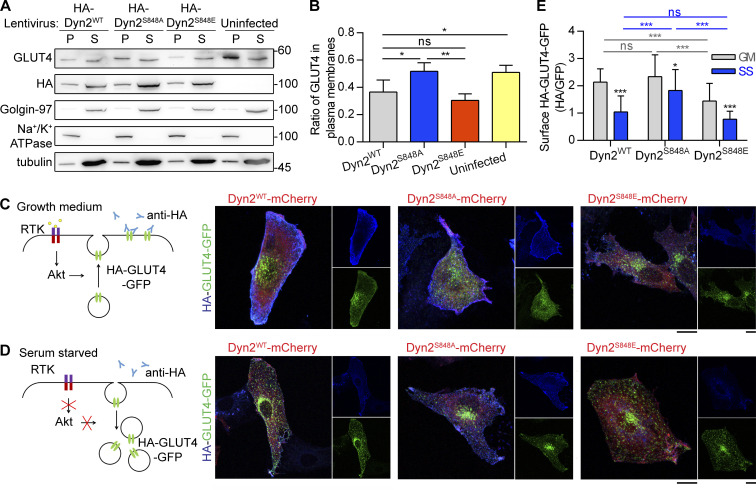
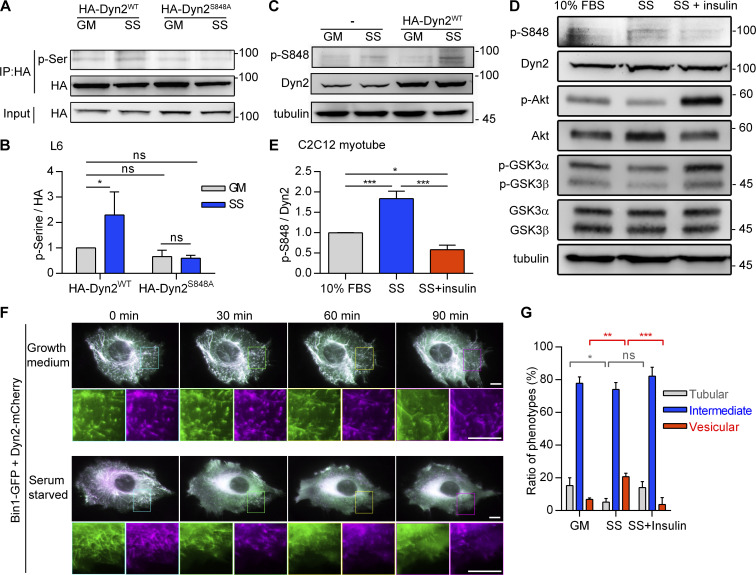
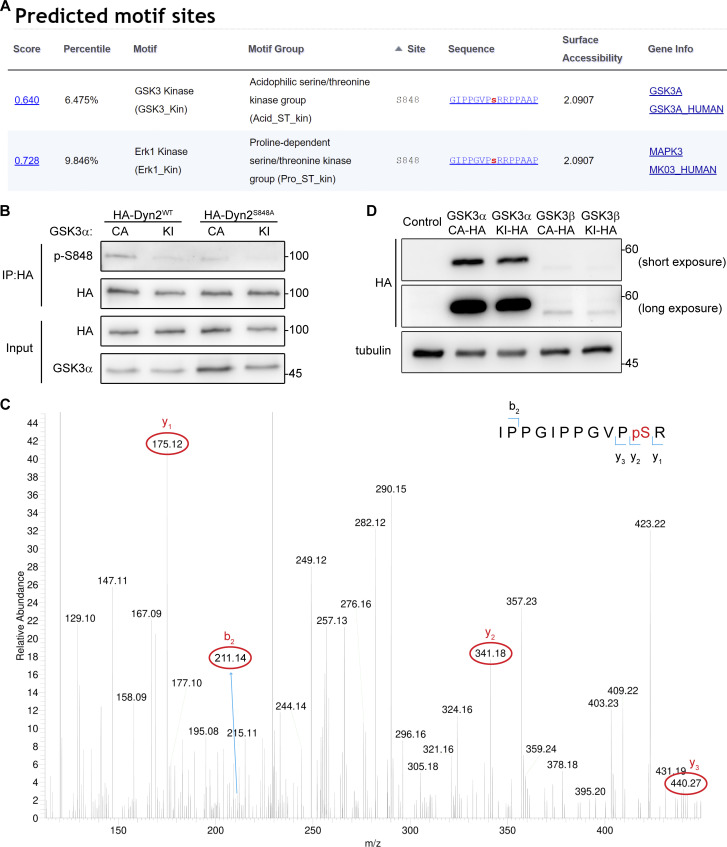
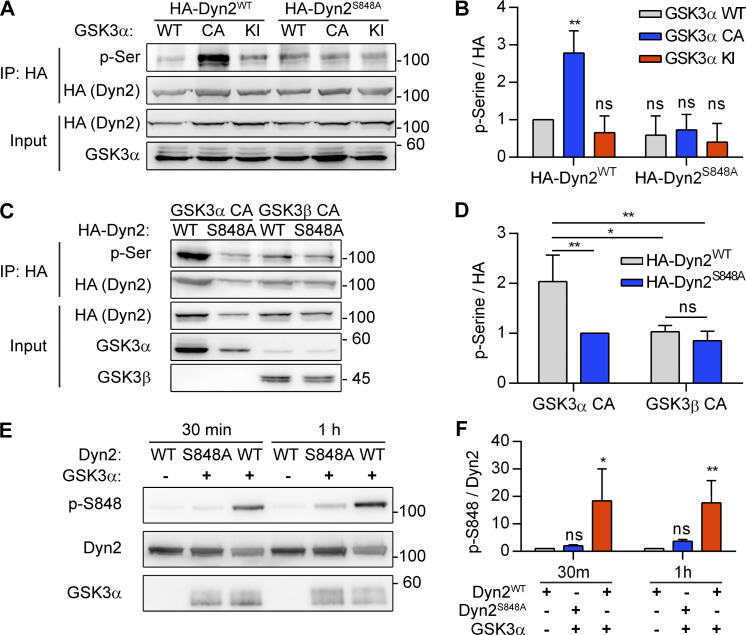
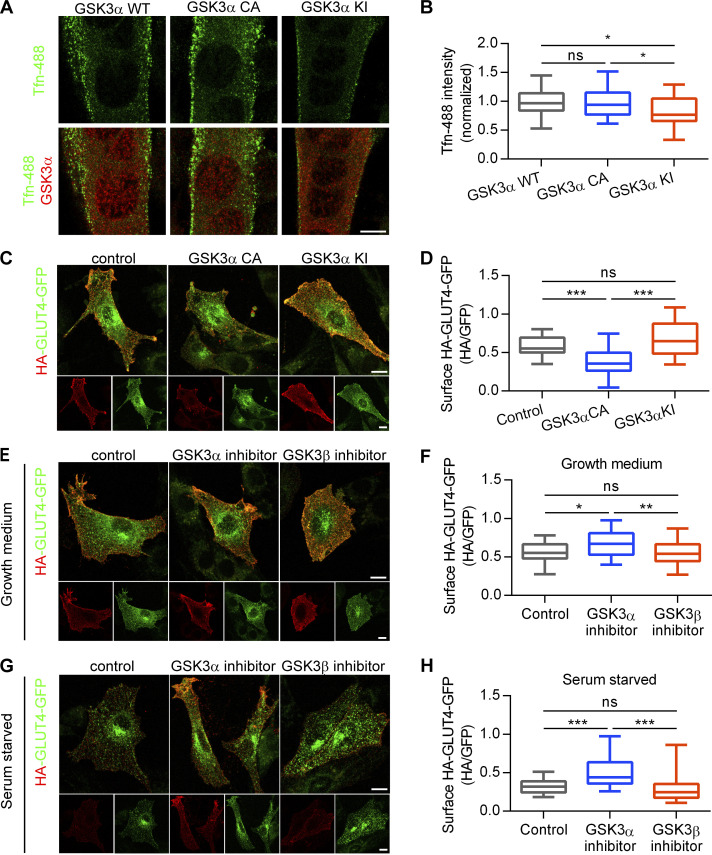
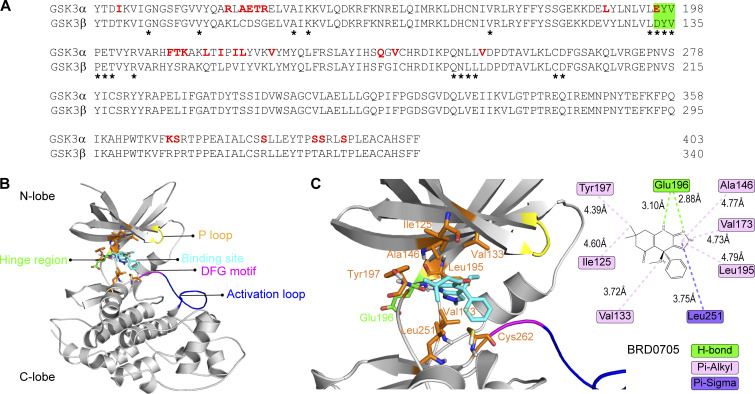
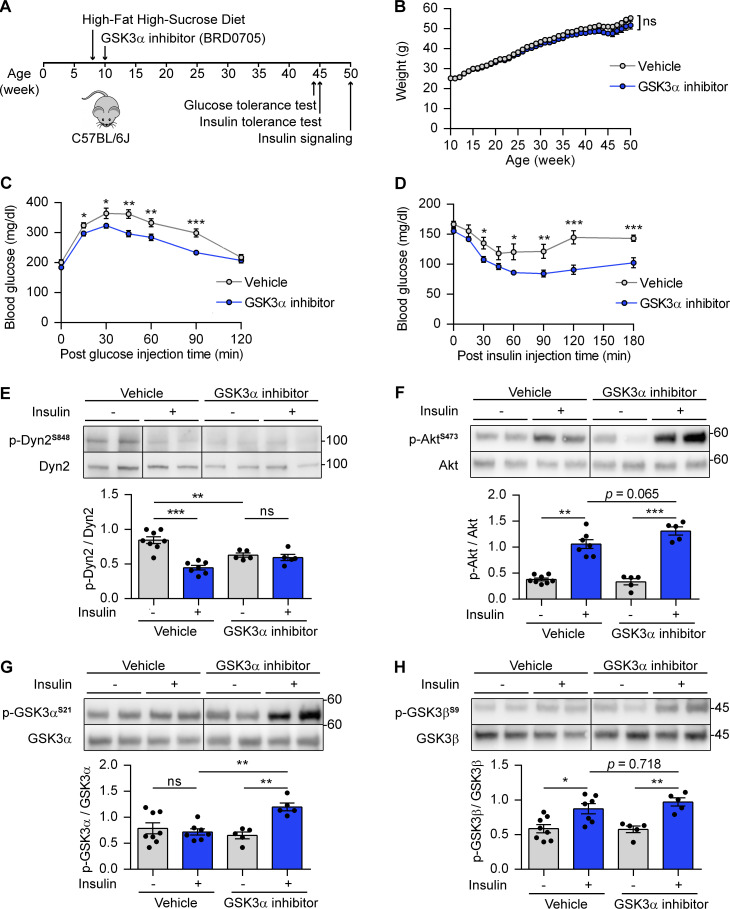
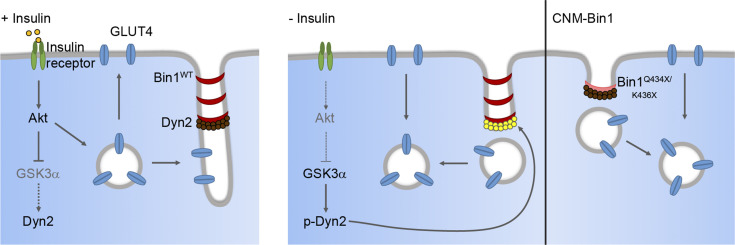
Insulin-stimulated translocation of glucose transporter 4 (GLUT4) to plasma membrane of skeletal muscle is critical for postprandial glucose uptake; however, whether the internalization of GLUT4 is also regulated by insulin signaling remains unclear. Here, we discover that the activity of dynamin-2 (Dyn2) in catalyzing GLUT4 endocytosis is negatively regulated by insulin signaling in muscle cells. Mechanistically, the fission activity of Dyn2 is inhibited by binding with the SH3 domain of Bin1. In the absence of insulin, GSK3α phosphorylates Dyn2 to relieve the inhibition of Bin1 and promotes endocytosis. Conversely, insulin signaling inactivates GSK3α and leads to attenuated GLUT4 internalization. Furthermore, the isoform-specific pharmacological inhibition of GSK3α significantly improves insulin sensitivity and glucose tolerance in diet-induced insulin-resistant mice. Together, we identify a new role of GSK3α in insulin-stimulated glucose disposal by regulating Dyn2-mediated GLUT4 endocytosis in muscle cells. These results highlight the isoform-specific function of GSK3α on membrane trafficking and its potential as a therapeutic target for metabolic disorders.


Figures

Figure 1.
Figure 1.
Bin1 inhibits Dyn2 fission activity via SH3 domain. (A) Domain structure of dynamin and Bin1 constructs used in this study. Pleckstrin homology domain and GTPase effector domain of dynamin are abbreviated to PH and GED, respectively. (B) In vitro fission assay of Dyn2. Purified Dyn2 was incubated with increasing concentrations of Bin1 or Bin1ΔSH3 in the presence of GTP and SUPER template. The fission activity was measured as the fraction of vesicle released from total SUPER template (n = 3 experimental replicates). (C–E) Effect of Bin1 on the fission activity of dynamins. Purified Dyn1 (C) or Dyn2 CNM mutants (D) is incubated with Bin1, Bin1ΔSH3, or increasing concentrations of Bin1 (E; n = 3 experimental replicates). (F and G) Liposome binding ability. Dyn2 or Bin1 were incubated with 100 nm liposome for 10 min at 37°C. Liposome-bound proteins (pellet, P) were separated from unbound ones (supernatant, S) with centrifugation sedimentation. The fraction of liposome-bound proteins was quantified and shown in G (n = 3 experimental replicates). Molecular weight is in kD. (H) Assembly of Dyn2 or Bin1 on liposome. Dyn2 and/or Bin1 were incubated with liposomes and then visualized with negative-stain TEM. Scale bar, 100 nm. Boxed areas were magnified and shown as below. (I) Liposome-stimulated GTPase activity of Dyn2. Dyn2 was incubated alone or with Bin1 or endophilin in the presence of liposome and GTP at 37°C. The rate of GTP hydrolysis was measured using a colorimetric malachite green assay (n = 3 experimental replicates). Data are shown as average ± SD and analyzed with one-way ANOVA. *P < 0.05; **P < 0.01; ***P < 0.001. Source data are available for this figure: SourceData F1.
Figure S1.
Figure S1.
PI motif of Bin1 is required for membrane binding and tubulation, but not Dyn2 fission activity. (A) Quantification of the tubulated liposome diameter in Fig. 1 H (n ≥ 11 liposome tubules). (B) Quantification of the periodicity of Dyn2 or Dyn2-Bin1 spirals assembled on liposomes in Fig. 1 H (n ≥ 11 liposome tubules). (C) Domain structure of Bin1 variants used in this study. (D) Effect of PI motif from Bin1 on regulating Dyn2 fission activity. 0.5 µM purified Dyn2 was incubated by itself or together with 0.5µM Bin1 variants with or without the PI motif in the presence of GTP and SUPER template. The data was shown as fold change relative to the Dyn2 fission activity alone (n = 3 experimental replicates). (E) Effect of PI motif on membrane tubulation ability of Bin1 in cellulo. GFP-tagged Bin1 containing PI motif (Bin1-GFP) or without PI motif (Bin1∆PI-GFP) were over-expressed in C2C12 myoblasts through transfection and viewed under confocal microscopy. Scale bar, 10 µm, scale bar for inset magnification, 5 µm. Bar graphs are shown as average ± SD, box plots are shown as median ± min and max value. Data are analyzed with Student’s t test (two-tailed, unpaired; B) or one-way ANOVA (A and D). *P < 0.05; ***P < 0.001.
Figure 2.
Figure 2.
CNM-Bin1 mutants enhance Dyn2 fission activity. (A) CNM-associated Bin1 mutants used in this study. (B and C) Binding ability between Bin1 mutants and the PRD of Dyn2. GST-PRD was incubated with indicated purified His-tagged Bin1 in the presence of liposome. PRD-bound Bin1 was analyzed with SDS-PAGE and Coomassie Blue staining. The ratio of bound Bin1 was normalized to WT and shown in C (n = 3 experimental replicates). (D) Membrane-binding ability of CNM-Bin1-SH3 mutants. 0.5 µM Bin1 mutants and/or 0.5 µM Dyn2 were incubated with 100 nm liposome for 10 min at 37°C. Liposome-bound proteins (pellet, P) were separated from unbound ones (supernatant, S) through centrifugation sedimentation. (E) Assembly of Bin1 mutants on liposome. 1 µM Bin1 was incubated with liposome and then visualized with negative-stain TEM. Scale bar, 100 nm. Boxed areas were magnified and shown as below. (F) Effects of CNM-Bin1 on Dyn2 fission activity. Dyn2 was incubated with increasing concentrations of Bin1WT, Bin1Q434X, or Bin1K436X in the presence of GTP and SUPER template. The fission activity was determined by sedimentation and fraction of released fluorescent vesicles in the supernatant from total SUPER template (n = 3 experimental replicates). (G and H) Electron micrographs of Dyn2 together with Bin1 mutants assembled onto liposomes. WT Dyn2 and Bin1 mutants were incubated with 100 nm liposomes for 10 min at 37°C, adsorbed to grids, and imaged by negative-stain TEM. Scale bar, 100 nm. Boxed areas were magnified and shown. Averaged tubule diameter was quantified and shown in H (n ≥ 7 liposome tubules). (I) Membrane tubulation ability of Bin1 mutants in cellulo. GFP-tagged Bin1 mutants were overexpressed in C2C12 myoblasts through transfection and imaged under confocal microscopy. Scale bar, 10 µm. (J and K) Morphology of CNM-associated Bin1 mutants coexpressed with Dyn2-mCherry in myoblast. GFP-tagged WT or mutant Bin1 was transfected into C2C12 myoblasts together with Dyn2-mCherry. The Bin1-mediated membrane morphologies were imaged with confocal microscopy. Bottom panels, magnified images from insets in top panels. Scale bar, 10 µm. The Bin1-mediated membrane deformation was categorized into three groups (the examples of cells from each category are shown in top panel of K), and the ratio of each population was quantified and compared with Bin1WT (n ≥ 75 cells from three independent repeats). (L) Time-lapse representative images of CNM-associated Bin1 mutants coexpressed with Dyn2-mCherry in C2C12 myoblast were magnified and shown. White arrowheads indicate the occurrence of membrane fission. Scale bar, 2 µm. Data are shown as average ± SD and analyzed with one-way ANOVA. *P < 0.05; **P < 0.01; ***P < 0.001. Molecular weight is in kD. Source data are available for this figure: SourceData F2.
Figure 3.
Figure 3.
The phosphorylation of Dyn2-S848 relieves Bin1 inhibition. (A) The amino acid sequence of Dyn2-PRD. Two potential phosphorylated serine, S848 and S856, are boxed and highlighted in yellow. The SH3-binding pockets were highlighted in light blue. (B and C) GST pulldown assay. GST or GST-tagged Bin1 SH3 domain was incubated with indicated Dyn2 mutants. The ratio of bound Dyn2 was detected with Coomassie Blue staining, quantified with ImageJ, and normalized to WT as shown in C (n = 3 experimental replicates). Molecular weight is in kD. (D) Fission activity of Dyn2 mutants in the presence of Bin1. Indicated Dyn2 proteins were incubated with increasing concentrations of Bin1 in the presence of GTP and SUPER templates for fission activity analysis. The data was shown as fold change relative to the Dyn2 fission activity in the absence of Bin1 (n = 3 experimental replicates). (E and F) Effect of Dyn2 mutants on GFP-Bin1 tubules in myoblasts. WT or indicated Dyn2-mCherry mutants were transfected into myoblasts together with Bin1-GFP. Scale bar, 10 µm. The Bin1-induced membrane morphologies were analyzed as in Fig. 2 K and shown in F (n ≥ 100 cells from three independent repeats). (G) Assembly of Dyn2 mutants on liposome. Indicated Dyn2 proteins were incubated with liposome alone (top) or together with Bin1 (bottom) and then visualized with negative-stain TEM. Scale bar, 100 nm. Data are shown as average ± SD and analyzed with one-way ANOVA. #P ≤ 0.06; *P < 0.05; **P < 0.01. Source data are available for this figure: SourceData F3.
Figure S2.
Figure S2.
Dyn2-Ser848 phosphorylation relieves Bin1 inhibition and promotes membrane fission. (AC) Binding ability between Dyn2 and different SH3 domain. 12 µg GST, GST-Bin-SH3, or GST-endophilin-SH3 was incubated with 6 µg indicated purified Dyn2. Bound Dyn2 was analyzed with SDS-PAGE and Coomassie Blue staining. The ratio of bound Dyn2 was quantified, normalized to WT, and shown in B and C (n = 3 experimental replicates). Molecular weight is in kD. (D) Time-lapse representative images of Bin1-GFP tubules in cells co-expressing WT, S848A, or S848E Dyn2-mCherry were magnified and shown. White arrowheads indicate the occurrence of membrane fission. Scale bar, 2 µm. (E) Quantification of tubulated liposome diameter from coincubation of Bin1 and Dyn2 in Fig. 3 G (n ≥ 6 liposome tubules). (F) Multiple sequence alignment of Dyn2 PRD domain from different organisms. These sequences were analyzed with EMBL-EBI Clustal Omega Multiple Sequence Alignment. Data are shown as average ± SD and analyzed with one-way ANOVA. *P < 0.05; ***P < 0.001. Source data are available for this figure: SourceData FS2.
Figure S3.
Figure S3.
Dyn2-Ser848 phosphorylation promotes endocytosis, but not exocytosis. (A) Amino acid sequences of Bin1-PI motif from different organisms (top). The expression of muscle-specific Bin1 in C2C12 or L6 myoblasts cultured in growth medium or DM was examined by Western blotting using anti-PI motif antibody (bottom). (B and C) The amount of endogenous GLUT4 in C2C12 myotubes expressing different Dyn2 mutants. C2C12 myotubes infected with indicative HA-Dyn2 mutant lentiviruses expressed a similar level of GLUT4, and the data were quantified, normalized to WT, and shown in B (n = 4 experimental replicates). (D and E) Effect of Dyn2 mutants on transferrin internalization in myotubes. C2C12 myoblasts transfected with indicated Dyn2-mCherry mutants and differentiated into myotubes were incubated with Tfn-488 at 37°C for 20 min. Cells were then washed on ice, fixed, and imaged under confocal microscopy. Scale bar, 10 µm. Fluorescence intensity of internalized transferrin was quantified, normalized to Tfn-488 intensity of Dyn2WT transfected cells, and shown in E (n ≥ 24 cells over two independent repeats). (FH) Effects of Dyn2-S848 mutants on transferrin internalization or recycling in L6 myoblast. L6 myoblasts expressing indicative Dyn2-mcherry mutants were subjected to 30-min Tfn-488 uptake, wash, and imaging (F). The recycling efficiency of these internalized transferrin was analyzed by chasing the signal by 30-min incubation of growth medium without Tfn-488 (G). The intensity of internalized Tfn-488 was quantified and shown in H (n ≥ 25 cells over three independent repeats). Scale bar, 10 µm. Bar graphs are shown as average ± SD, box plots are shown as median ± min and max value. Data are analyzed with one-way ANOVA. *P < 0.05; **P < 0.01; ***P < 0.001. Molecular weight is in kD. Source data are available for this figure: SourceData FS3.
Figure 4.
Figure 4.
The phosphorylation of Dyn2-S848 promotes endocytosis. (A and B) Subcellular distribution of endogenous GLUT4 in C2C12 myotubes expressing different Dyn2 mutants. Differentiated C2C12 myotubes were infected with lentiviruses to express indicated HA-Dyn2 and then subjected to subcellular fractionation to determine the distribution of endogenous GLUT4 by Western blotting. The markers for heavy membrane (Na+/K+ ATPase, plasma membrane), light membrane (Golgin-97, trans-Golgi), and cytosol (tubulin) were used to validate this assay. The ratio of GLUT4 in heavy membrane fraction was quantified and shown in B (n = 4 experimental replicates). Molecular weight is in kD. (CE) Effects of Dyn2-S848 mutations on the insulin-regulated GLUT4-HA-GFP distribution. L6 myoblasts cotransfected with GLUT4-HA-GFP and Dyn2-mCherry mutants were subjected to growth or serum-free medium for 2 h. The cartoons illustrate the expected location of GLUT4-HA-GFP under indicated conditions; with or without receptor tyrosin kinase (RTK) signaling activation. After immunofluorescent staining with anti-HA antibody without permeabilization and imaging by confocal microscopy, the relative amount of surface GLUT4-HA-GFP was quantified by the fluorescent intensity of HA signaling in blue divided by the total GLUT4-HA-GFP in green as shown in E (n ≥ 27 cells from three independent repeats). Data are shown as average ± SD and analyzed with one-way ANOVA. *P < 0.05; **P < 0.01; ***P < 0.001. Source data are available for this figure: SourceData F4.
Figure 5.
Figure 5.
The phosphorylation of Dyn2S848 is regulated by insulin signaling. (A and B) Phosphorylation of Dyn2 in response to SS. HA-tagged Dyn2WT or Dyn2S848A expressed in L6 myoblasts were precipitated by anti-HA antibody with or without SS. Phosphorylated Dyn2 was quantified by anti-phospho-serine antibody and normalized with precipitated HA intensity compared with HA-Dyn2WT in growth medium and shown in B (n = 3 experimental replicates). (CE) Phosphorylation of endogenous Dyn2 in response to SS and insulin. C2C12 myotubes were subjected to growth medium (10% FBS), 3-h serum-free medium (SS; C), or SS followed with 30-min, 100 nM insulin stimulation (D). Cell lysates were harvested and detected by Western blotting with indicated antibodies. The ratio of phosphorylated Dyn2S848 was quantified and shown in E (n = 3 experimental replicates). (F) Time-lapse representative images of Bin1-GFP tubules in cells cotransfected with Dyn2-mCherry and cultured in growth or serum-free medium. Boxed areas were magnified and shown in the lower panel. Scale bar, 10 μm. (G) Effects of insulin signaling on Bin1 tubule morphology. Bin1-GFP were transfected into myoblasts together with Dyn2-mCherry and cultured in growth medium, serum-starved, or starved followed by 60-min insulin stimulation. The population of cells with tubule, intermediate, or vesicular Bin1 morphology were quantified (n ≥ 75 cells from three independent repeats). Scale bar, 10 μm. Data are shown as average ± SD and analyzed with one-way ANOVA. *P < 0.05; **P < 0.01; ***P < 0.001. Molecular weight is in kD. Source data are available for this figure: SourceData F5.
Figure S4.
Figure S4.
GSK3α phosphorylates the S848 residue of Dyn2. (A) Analysis of potential kinases for Dyn2S848. Screenshot of the prediction results for Dyn2S848 kinases using Scansite motif scans (https://scansite4.mit.edu/#scanProtein). Lower score indicates better match of protein sequence to the optimal binding pattern. (B) Analysis of Dyn2 phosphorylation under GSK3α overexpression. HA-Dyn2WT or HA-Dyn2S848A were coexpressed with GSK3α CA or KI in Hela cells. After precipitated with anti-HA antibody, the phosphorylated Dyn2 was detected with Dyn2 phospho-S848-specific (p-S848) antibodies. (C) MS analysis of Dyn2 phosphorylation by GSK3α. Recombinant Dyn2 was incubated with GSK3α and ATP in kinase assay buffer for 1 h. The reaction was then analyzed for phosphorylation with LC-MS/MS. The 838-IPPGIPPGVPpSR phosphopeptide containing phosphorylated Ser848 was identified. The MS/MS spectrum of this phosphopeptide is shown. The m/z of (3+) charged phosphopeptide is 422.89 with mass accuracy of <5 ppm. The mass difference between the y1 and y2 ions is consistent with phosphorylation at S848. Of note, the MS/MS spectrum is interfered by another peptide from Dyn2 (258-FFLSHPAYRH) with identical mass to our targeted phosphopeptide containing pS848. (D) The expression of HA-tagged GSKα or -β in lentiviral-infected L6 myoblasts was examined by Western blotting using anti-HA antibody. Molecular weight is in kD. Source data are available for this figure: SourceData FS4.
Figure 6.
Figure 6.
GSK3α phosphorylates the S848 residue of Dyn2. (A and B) Phosphorylation of Dyn2 in response to GSK3α overexpression. HA-Dyn2WT or HA-Dyn2S848A were coexpressed with WT, CA, or KI forms of GSK3α in Hela cells. After precipitation with anti-HA antibody, the phosphorylated Dyn2 was detected with anti-phospho-serine antibody, normalized with HA intensity, and shown in B (n = 3 experimental replicates). (C and D) Isoform specific activity of GSK3 on Dyn2. HA-Dyn2WT or HA-Dyn2S848A were co-expressed with CA GSK3α or GSK3β in Hela cells. After precipitation with anti-HA antibody, the phosphorylated Dyn2 was detected with anti-phospho-serine antibody, normalized with HA intensity, and shown in D (n = 3 experimental replicates). (E and F) In vitro kinase assay. 0.8 μg purified Dyn2WT or Dyn2S848A were incubated with ATP in the presence or absence of 10 ng purified GSK3α. After 30-min or 1-h incubation, the phosphorylated Dyn2 was quantified by Western blotting with anti–p-Dyn2S848 antibody. The intensity of p-Dyn2S848 was quantified with ImageJ, normalized with Dyn2 signal and shown in F (n = 3 experimental replicates). Data are shown as average ± SD and analyzed with one-way ANOVA. *P < 0.05; **P < 0.01. Molecular weight is in kD. Source data are available for this figure: SourceData F6.
Figure 7.
Figure 7.
GSK3α activation promotes endocytosis in muscle cells. (A) Effect of GSK3α mutants on transferrin internalization in myotubes. C2C12 myoblasts transfected with indicated GSK3α mutants and differentiated into myotubes were incubated with Tfn-488 at 37°C for 20 min. Cells were then washed on ice, fixed, and imaged under confocal microscopy. Scale bar, 10 µm. (B) Fluorescence intensity of internalized transferrin was quantified and shown (n = 25 cells from three independent repeats). (C) Effect of GSK3α mutants on GLUT4-HA-GFP distribution. L6 myoblasts were infected with indicated GSK3α mutants and transfected with GLUT4-HA-GFP. Scale bar, 10 µm. (D) After immunofluorescent staining with anti-HA antibody without permeabilization and imaging by confocal microscopy, the relative amount of surface GLUT4-HA-GFP was quantified by the fluorescent intensity of HA signaling in red divided by the total GLUT4-HA-GFP in green as shown (n ≥ 30 cells from three independent repeats). (EH) Effect of GSK3 inhibitors on GLUT4-HA-GFP distribution. L6 myoblasts transfected with GLUT4-HA-GFP were treated with DMSO, GSK3α inhibitor (BRD0705, 20 µM), or GSK3β inhibitor (TWS119, 2 µM) under growth (E) or serum-free medium (G) for 3 h. Scale bar, 10 µm. The relative amount of surface GLUT4-HA-GFP was quantified by the fluorescent intensity of HA signaling in red divided by the total GLUT4-HA-GFP in green as shown in F and H (n ≥ 30 cells from three independent repeats). Data are shown as median ± min and max value. Data are analyzed with one-way ANOVA. *P < 0.05; **P < 0.01; ***P < 0.001.
Figure S5.
Figure S5.
BRD0705 targets the Glu196 residue of GSK3α. (A) Sequence alignment of the kinase domain of GSK3α and GSK3β. The hinge region was highlighted in green. Residues within 6 Å approximity of the ligands are marked with asterisk. (B and C) Molecular docking of GSK3α and BRD0705. Interaction between amino acid side chain and the inhibitor was annotated in C.
Figure 8.
Figure 8.
GSK3α inhibitor improves insulin sensitivity and glucose tolerance in mice fed on HFHSD. (A) Schematic of GSK3α pharmacological inhibition in mice with HFHSD and the time points for indicated experiments. (B) The body weight of mice treated with vehicle or GSK3α inhibitor (BRD0705; n = 15 mice per group). (C and D) Glucose and insulin tolerance tests after vehicle or BRD0705 were delivered for 34–35 wk. The blood glucose levels were measured at indicated times after peritoneal injection of glucose (C) or insulin (D; n = 15 mice for vehicle group, n = 14 mice for BRD0705 group). (EH) Effect of BRD0705 on Dyn2 phosphorylation and insulin signaling pathway. Soleus muscle from vehicle- or BRD0705-treated mice were collected 30 min after insulin injection (2 IU/kg), lysed, and detected by Western blotting with indicated antibodies. The ratio of p-Dyn2S848 (E), AktS473 (F), GSK3αS21 (G), and GSK3βS9 (H) normalized to total protein was quantified and shown (n = 15 tissue lysates for vehicle group, n = 10 tissue lysates for BRD0705 group). Data are shown as average ± SEM and analyzed with Student’s t test (two-tailed, unpaired, B–D) or one-way ANOVA (E–H). *P < 0.05; **P < 0.01; ***P < 0.001. Molecular weight is in kD. Source data are available for this figure: SourceData F8.
Figure 9.
Figure 9.
Dyn2-S848 phosphorylation serves as a molecular switch to promote endocytosis in muscle cells. Dyn2 activity is inhibited by the binding of Bin1 while GSK3α is inactivated by external signaling, e.g. insulin-PI3K-Akt. The attenuated endocytosis together with the increased exocytosis of GLUT4 lead to its efficient plasma membrane translocation and glucose uptake of muscle upon insulin stimulation. After insulin signaling turns off, GSK3α becomes active and phosphorylates Dyn2-S848 to relieve the Bin1 inhibition and promote endocytosis. The internalization of GLUT4 from muscle surface ceases the glucose uptake of skeletal muscle. CNM-related Bin1 mutations with partial truncation of the SH3 domain lose their inhibitory effect on Dyn2 thus resulting in hyperactive Dyn2 and fragmented T-tubule in muscle cells.

Similar articles

Cited by

References

    1. Ahmad, F., Lal H., Zhou J., Vagnozzi R.J., Yu J.E., Shang X., Woodgett J.R., Gao E., and Force T.. 2014. Cardiomyocyte-specific deletion of Gsk3α mitigates post-myocardial infarction remodeling, contractile dysfunction, and heart failure. J. Am. Coll. Cardiol. 64:696–706. 10.1016/j.jacc.2014.04.068 - DOI - PMC - PubMed
    1. Al-Qusairi, L., and Laporte J.. 2011. T-tubule biogenesis and triad formation in skeletal muscle and implication in human diseases. Skelet. Muscle. 1:26. 10.1186/2044-5040-1-26 - DOI - PMC - PubMed
    1. Batista, T.M., Jayavelu A.K., Wewer Albrechtsen N.J., Iovino S., Lebastchi J., Pan H., Dreyfuss J.M., Krook A., Zierath J.R., Mann M., and Kahn C.R.. 2020. A cell-autonomous signature of dysregulated protein phosphorylation underlies muscle insulin resistance in type 2 diabetes. Cell Metab. 32:844–859.e5. 10.1016/j.cmet.2020.08.007 - DOI - PMC - PubMed
    1. Beg, M., Abdullah N., Thowfeik F.S., Altorki N.K., and McGraw T.E.. 2017. Distinct Akt phosphorylation states are required for insulin regulated Glut4 and Glut1-mediated glucose uptake. Elife. 6:e26896. 10.7554/eLife.26896 - DOI - PMC - PubMed
    1. Birnbaum, M.J. 1989. Identification of a novel gene encoding an insulin-responsive glucose transporter protein. Cell. 57:305–315. 10.1016/0092-8674(89)90968-9 - DOI - PubMed

Publication types