. 2022 Nov 28;23(1):246.
doi: 10.1186/s13059-022-02812-w.

Cross-regulome profiling of RNA polymerases highlights the regulatory role of polymerase III on mRNA transcription by maintaining local chromatin architecture

Affiliations

Cross-regulome profiling of RNA polymerases highlights the regulatory role of polymerase III on mRNA transcription by maintaining local chromatin architecture

Yongpeng Jiang et al. Genome Biol. .

Abstract

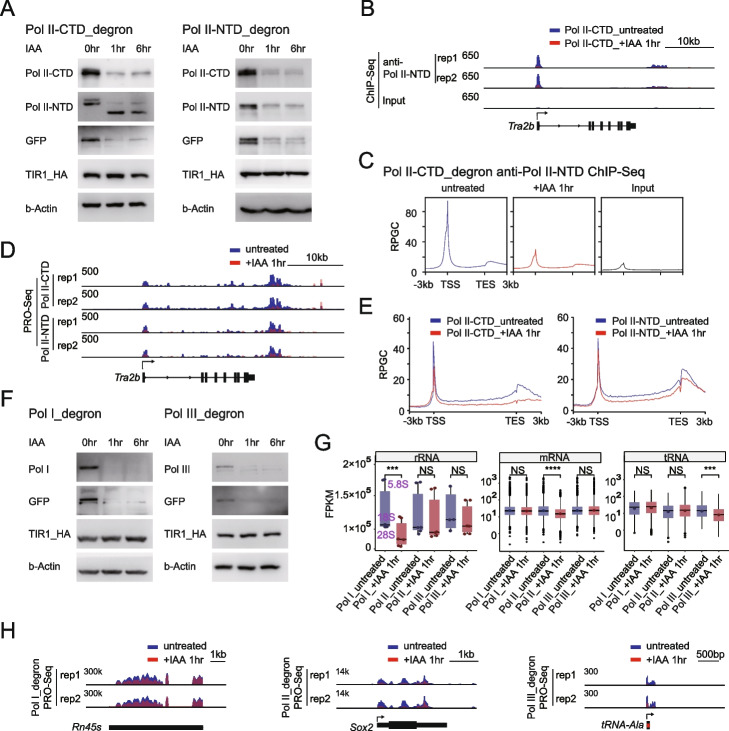
Background: Mammalian cells have three types of RNA polymerases (Pols), Pol I, II, and III. However, the extent to which these polymerases are cross-regulated and the underlying mechanisms remain unclear.

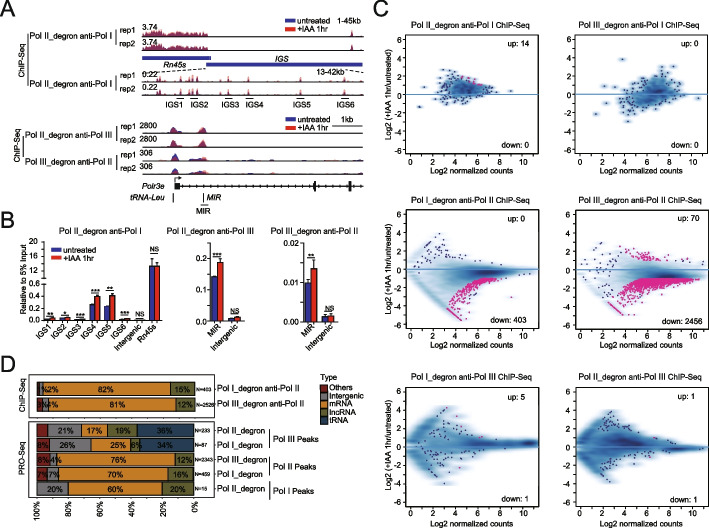
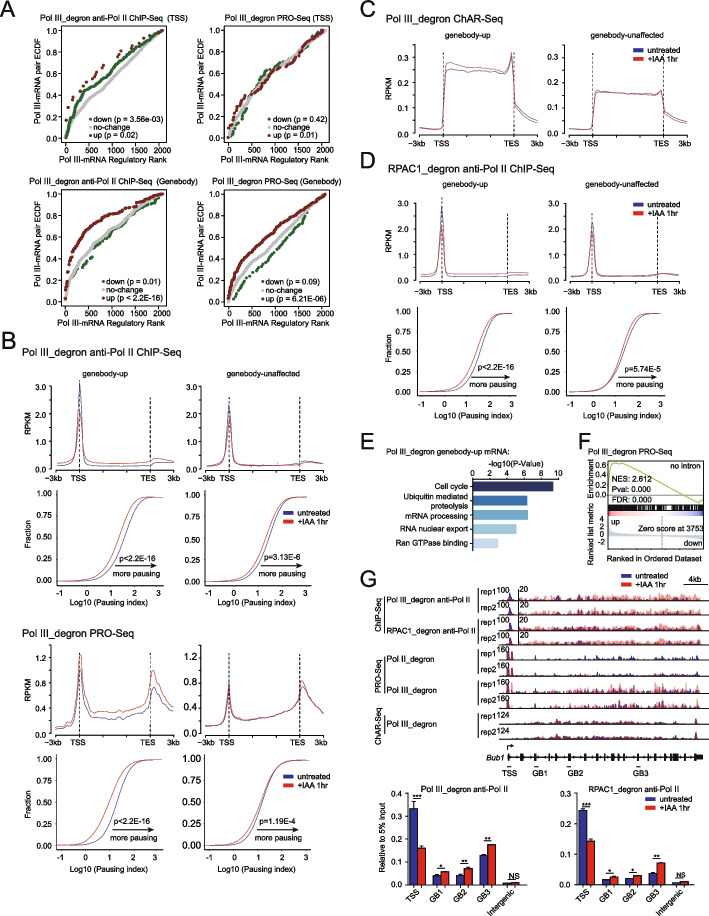
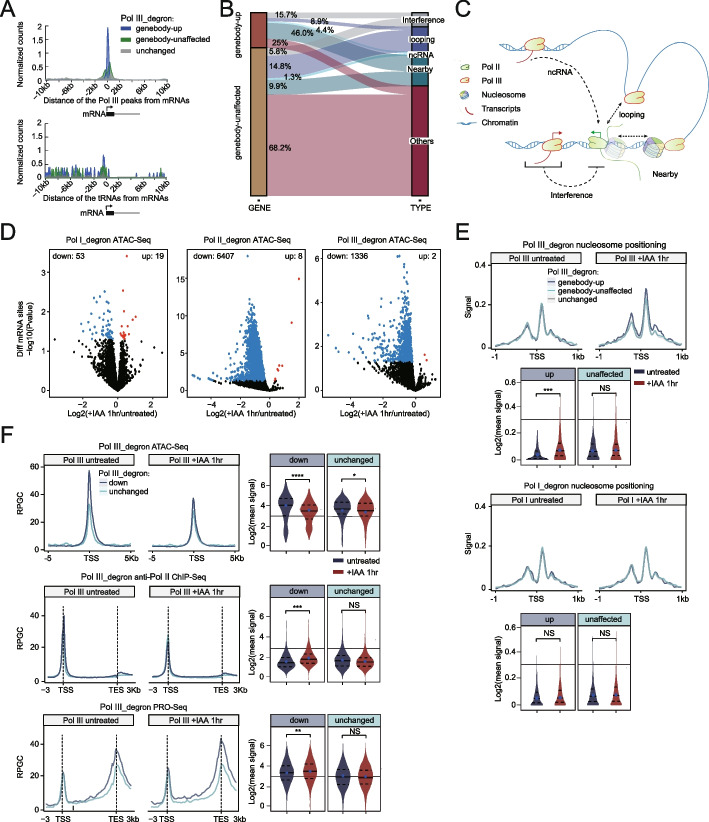
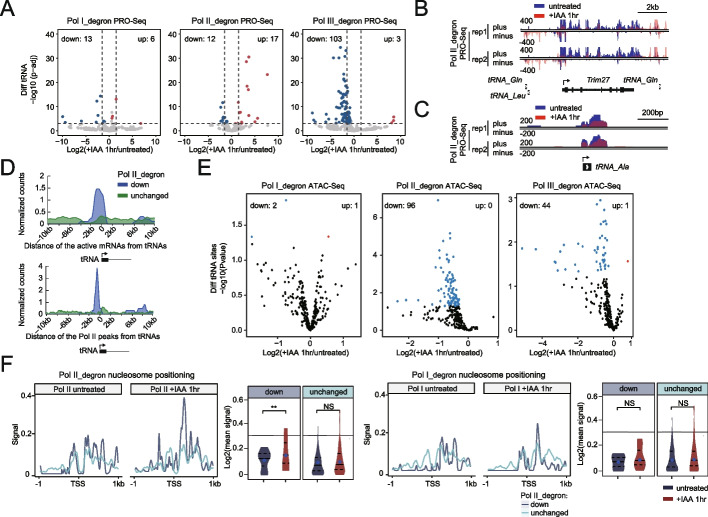
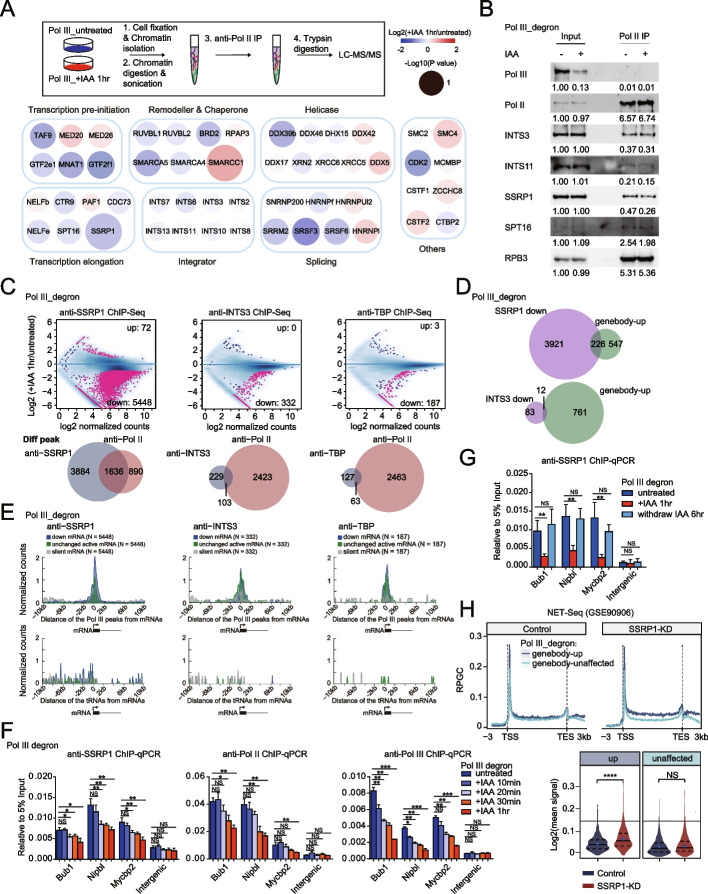
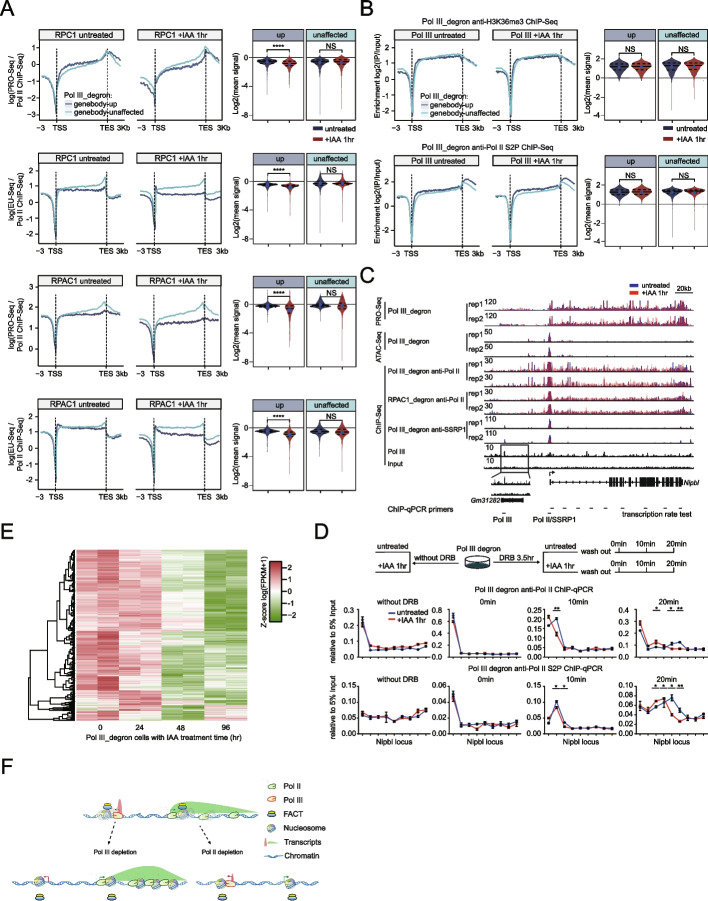
Results: We employ genome-wide profiling after acute depletion of Pol I, Pol II, or Pol III to assess cross-regulatory effects between these Pols. We find that these enzymes mainly affect the transcription of their own target genes, while certain genes are transcribed by the other polymerases. Importantly, the most active type of crosstalk is exemplified by the fact that Pol III depletion affects Pol II transcription. Pol II genes with transcription changes upon Pol III depletion are enriched in diverse cellular functions, and Pol III binding sites are found near their promoters. However, these Pol III binding sites do not correspond to transfer RNAs. Moreover, we demonstrate that Pol III regulates Pol II transcription and chromatin binding of the facilitates chromatin transcription (FACT) complex to alter local chromatin structures, which in turn affects the Pol II transcription rate.

Conclusions: Our results support a model suggesting that RNA polymerases show cross-regulatory effects: Pol III affects local chromatin structures and the FACT-Pol II axis to regulate the Pol II transcription rate at certain gene loci. This study provides a new perspective for understanding the dysregulation of Pol III in various tissues affected by developmental diseases.

Keywords: FACT complex; Local chromatin structure; RNA polymerases II and III; Transcription rate.


Conflict of interest statement

The authors declare that they have no competing interests.

Figures

Fig. 1
Fig. 1
Rapid disruption of Pol I, Pol II, and Pol III transcription in mESCs. A Western blot analyses of Pol II (RPB1) protein levels at different time points after IAA treatment in C-terminal domain (CTD, left) and N-terminal domain (NTD, right) degron mESCs. GFP was fused to the degron tag and used to confirm degradation. HA-tagged TIR1 (TIR1-HA) level were also examined to indicate efficient induction of TIR1. b-Actin served as the loading control. B Genome browser ChIP-Seq track at the 22,193,658–22,321,486 region on chromosome 16 in Pol II_CTD_degron cells under untreated (upper) and after 1 h of IAA treatment conditions (middle). ChIP-Seq was performed with an antibody recognizing the Pol II (RPB1) N-terminal (anti-Pol II-NTD). The input is shown in the bottom panel, all tracks are flipped horizontally, and the y-axis shows the normalized read density in reads per genome coverage (RPGC). C Average metagene profiles of Pol II occupancy on gene bodies and the adjacent regions 3 kb upstream and downstream in Pol II_CTD_degron cells at active mRNA genes under untreated (left) and after 1 h of IAA treatment conditions (middle) with an antibody recognizing the Pol II (RPB1) N-terminal (anti-Pol II-NTD). The input is shown in the right panel. D Genome browser PRO-Seq track at the same region described in Fig. 1B in Pol II_CTD_degron and Pol II_NTD_degron cells under untreated and after 1 h of IAA treatment conditions. The y-axis shows the normalized read density in reads per kilobase per million mapped reads (RPKM). Only sense strand signals are presented, and all tracks are flipped horizontally. E Average metagene profiles of spike-in-normalized PRO-Seq signals at active mRNA genes in Pol II_CTD_degron (left) and Pol II_NTD_degron (right) cells under untreated and after 1 h of IAA treatment conditions. F Western blot analysis of Pol I (RPA1) and Pol III (RPC1) protein levels at different time points after IAA treatment. Immunoblotting was performed with antibodies recognizing the N-terminal domains, as shown in Fig. 1A. G Normalized PRO-Seq read counts were summed and compared at rRNA (left, N = 3), active mRNAs (middle, N = 8845), and tRNA loci (right, N = 435) in Pol I degron, Pol II CTD_degron, and Pol III degron cells under untreated and after 1 h of IAA treatment conditions. The rRNA density was calculated as the sum of the 5.8S, 18S, and 28S rRNA densities. The boxplots show the range of the values, with the median indicated by a line. The whiskers on the boxplots show the lowest data value within IQR=1.5 of the lower quartile and the highest data value within IQR=1.5 of the upper quartile. The p value was calculated using the Mann–Whitney test. H Genome browser PRO-Seq track at the 39,840,997–39,850,829 region on chromosome 17, 34,648,531–34,653,537 region on chromosome 3 and 21,240,180–21,243,656 region on chromosome 13 in Pol I_degron, Pol II_CTD_degron, and Pol III_degron cells under untreated and after 1 h of IAA treatment conditions. The y-axis shows the normalized read density in reads per kilobase per million mapped reads (RPKM). Only sense strand signals are presented
Fig. 2
Fig. 2
Orthogonal experimental analyses revealed the predominant role of Pol III in the regulation of Pol II transcription. A Genome browser track of Pol I ChIP-Seq signals at rRNA cDNA units in Pol II_degron cells under untreated conditions and after 1 h of IAA treatment to visualize the IGS regions (see “Methods” for details, top). Genome browser track of Pol II ChIP-Seq signals in Pol III_degron cells or Pol III ChIP-Seq signals in Pol II_degron cells in the 120,914,905–120,924,630 region on chromosome 7 under untreated conditions and after 1 h of IAA treatment (bottom). The y-axis shows the normalized read density in reads per genome coverage (RPGC). Note that the intergenic spacer (IGS) region is magnified at the bottom to show the details. Two biological replicates are shown. B Bar graphs showing the relative ChIP enrichment normalized to input (5%) at the loci indicated in Fig. 2A (Additional file 12: Table S11). Each sample was analyzed with two technical replicates per biological replicate and two biological replicates in total. Statistical significance was evaluated by Student’s t test (***: <0.001, **: <0.01, *: <0.05, NS: not significant). C MA plots showing differential enrichment of Pol I ChIP-Seq signals around Pol I-bound peaks in Pol II_degron (left) and Pol III_degron (right) cells under untreated and after 1 h of IAA treatment conditions (upper). Each dot represents one peak. Red indicates a significant change that meets both criteria of a false discovery rate (FDR) < 0.05 and fold change > 2. Similarly, Pol II ChIP-Seq performed in Pol I_degron (left) and Pol III_degron (right) cells (middle) and Pol III ChIP-Seq performed in Pol I_degron (left) and Pol II_degron (right) cells (bottom) are presented. D Horizontally stacked bar charts showing the genomic distribution of differential peaks identified by Pol II ChIP-Seq and evaluated by factor perturbation analysis (upper panel, data from Fig. 2C). These results were further confirmed by conducting a similar analysis at the transcriptional level using PRO-Seq data from factor perturbation experiments (bottom)
Fig. 3
Fig. 3
Pol III depletion perturbs the transcription of Pol II at gene bodies. A Modified beta analysis results depicting the activating and repressive functions of Pol III binding events. The red, green, and gray dots represent cumulative fractions of mRNA genes that were upregulated, downregulated, or unchanged by Pol III depletion based on the Pol II ChIP-Seq (left) or PRO-Seq (right) results. Genes were ranked from high to low according to the corresponding Pol III peaks (see “Methods”). P values were calculated by two-sided Kolmogorov–Smirnov tests to determine whether the up- or downregulated groups differed significantly from the control group of transcriptionally unchanged genes. Integrated DNA-binding and target expression analysis from PRO-Seq or Pol II ChIP-Seq data after Pol III perturbation revealed that Pol III loss of function was mainly responsible for the significant upregulation of Pol III-associated genes within gene bodies but had little correlation with downregulated genes. B Top panel: Average metagene profiles of Pol II ChIP-Seq or PRO-Seq signals (normalized reads per million) on gene bodies and the adjacent regions 3 kb upstream and downstream in Pol III_degron cells subjected to 1 h IAA treatment versus untreated conditions: genebody-up (left, N=773) and genebody-unaffected mRNA (right, N=3290). Bottom panel: Empirical cumulative density function (ECDF) plots of the Pol II pausing index between Pol III_degron cells under 1 h IAA treatment and untreated conditions for each gene set as described above. Statistical significance was evaluated by the two-sided Wilcoxon rank-sum test. C Average metagene profiles of spike-in-normalized chromatin-associated RNA-Seq (ChAR-Seq) signals on gene bodies and the adjacent regions 3 kb upstream and downstream in Pol III_degron cells with 1 h of IAA treatment versus untreated mESCs for the same gene sets referenced in Fig. 3B. Remarkably, the overall increase in the gene body signals of genebody-up genes was highly consistent with the similar trend observed in the PRO-Seq data. D Analysis described in Fig. 3B for RPAC1 degron in mESCs. E Gene ontology analysis for the identified genes with genebody-up Pol II genes after depletion of Pol III (n = 773). F Gene set enrichment analysis (GSEA) revealed the enrichment of intronless genes by PRO-Seq analysis of gene expression changes in Pol III_degron cells. The normalized enrichment score (NES) and nominal p value were calculated using the GSEA package with 1000 permutations. G Genome browser track at the 127,798,200–127,833,859 region on chromosome 2 for Pol II ChIP-Seq signals in Pol III_degron and RPAC1_degron cells that were untreated or treated with IAA for 1 h. The genome browser track at the same region for PRO-Seq and chromatin-associated RNA-Seq signals in PoI III_degron cells that were untreated or treated with IAA for 1 h are also shown. The y-axis in the ChIP-Seq plot shows the normalized read density in reads per genome coverage (RPGC), and the y-axes in the PRO-Seq and ChAR-Seq plots show the normalized read density in reads per kilobase per million mapped reads (RPKM). Note that the Bub1 gene body (GB) region is magnified with a set scale to show the details, and all tracks are flipped horizontally. Bottom panel: Bar graphs showing relative ChIP enrichment normalized to input (5%) at the locus indicated above (Additional file 12: Table S11). Each sample was analyzed with two technical replicates per biological replicate and two biological replicates in total. Statistical significance was evaluated by Student’s t test (***: <0.001, **: <0.01, *: <0.05, NS: not significant). Only sense strand signals of PRO-Seq are presented
Fig. 4
Fig. 4
Pol III depletion affects the nucleosome occupancy of nearby mRNA genes. A Genebody-up mRNAs (blue), genebody-unaffected mRNAs (green), and unchanged mRNAs upon Pol III depletion (control, gray, unchanged genes) were defined by selecting the genes that were not at all affected by Pol III depletion; for details, see “Methods”) were clustered based on their distance from the nearest Pol III-bound peaks (upper) and expressed tRNAs (bottom) in 50 bp bins. B Sankey plot depicting relationships between Pol III and Pol II for the genebody-up genes and genebody-unaffected genes after Pol III depletion and four hypotheses in the subgroup, namely, transcription interference (interference), 3D interactions (looping), noncoding RNA (ncRNA), and nearby models. For detailed definitions, see Fig. S2E. C Working model for the cross-regulatory relationship between Pol III and Pol II by transcriptional interference, noncoding RNAs, 3D chromatin looping, and they occupy nearby but could not be explained the mechanisms listed above. D Volcano plots showing differentially accessible regions within active mRNA promoters (N=8845, ±1 kb centered on the TSS) identified by ATAC-seq upon depletion of Pol I, Pol II, and Pol III. The red dots represent a significant increase in chromatin accessibility, whereas the blue dots represent a significant decrease (adjusted P < 0.05). E ATAC-seq metaplots of mononucleosomes over the promoter regions of genebody-up mRNAs (N = 773, blue), genebody-unaffected mRNAs (N = 3290, green), and unchanged mRNAs (control, gray, for the definition, see “Methods”) upon Pol III depletion in Pol III_degron and Pol I_degron cells that were untreated or treated with IAA for 1 h (upper panel). Violin plots measuring the changes in promoter-proximal ATAC-seq mononucleosome signals over genebody-up or genebody-unaffected mRNA genes (bottom panel). Each violin plot shows the range of values, with the median indicated by a blue dot. The p value was calculated using the Mann–Whitney test. F Top panel: Composite metagene analysis of ATAC-Seq (upper) around the promoters, Pol II ChIP-Seq (middle), and PRO-Seq signals (bottom) around the gene bodies of mRNA genes in Pol III_degron cells with decreased and unchanged chromatin accessibility upon Pol III depletion, as shown in Fig. 4D. Promoters were defined as the regions within ± 2 kb of the transcription start site. For each metagene plot, the average profile (Y-axis) is displayed in normalized reads per million (RPM). Bottom panel: Violin plots (right) showing the quantification of ATAC-Seq, Pol II ChIP-Seq, and PRO-Seq signal changes for each group of gene sets shown in the top panel. The p value was calculated using the Mann–Whitney test
Fig. 5
Fig. 5
Local nucleosome positioning changes helps to explain the effects of Pol II on tRNA transcription. A Volcano plots showing the PRO-Seq signal changes over tRNA genes (N = 435) upon depletion of Pol I, Pol II, or Pol III. Statistically significant changes were determined from two biological replicates by the threshold criteria of an adjusted p value < 0.05 and absolute log2(fold change) >1 using DESeq2, with red representing upregulated genes and blue representing downregulated genes. B PRO-Seq in Pol II_degron cells under untreated conditions and after 1 h of IAA treatment. The Genome Browser track at the 21,166,370–21,202,236 region on chromosome 13 is shown with a bidirectional transcription signal. The y-axis shows the normalized read density in reads per kilobase per million mapped reads (RPKM). C The same data as described in Fig. 5B are shown for the 21,239,788–21,242,246 region on chromosome 13. D Under the same representations described in Fig. 4A, downregulated (N = 12, blue) and unchanged tRNA genes (N = 244, green) upon Pol II depletion in PRO-Seq were clustered based on their distance from the nearest expressed mRNAs and Pol II-bound peaks in 50-bp bins. E Under the same conditions described in Fig. 4D, differentially accessible sites around tRNA loci (N = 435, ±1 kb region centered on the tRNA genes) upon depletion of Pol I, Pol II, and Pol III are shown. F The ATAC-seq metaplots and violin plots shown are the same as those described in Fig. 4E but are based on the downregulated or unchanged tRNA genes upon Pol II depletion identified by PRO-Seq. The p value was calculated using the Mann–Whitney test
Fig. 6
Fig. 6
Pol III depletion alters the Pol II interactome and significantly impairs recruitment of the FACT complex. A Experimental setup for mass spectrometry of anti-Pol II immunoprecipitates obtained from crosslinking chromatin fractions of Pol III_degron cells that were untreated or treated with IAA for 1 h (upper). The protein factors listed here showed a similar trend of differential interactions with Pol II in both the canonical DDA and DIA-MS experiments (see the detailed procedure in the Supplementary Methods section). The color bar indicates proteins differentially interacting with Pol II, characterized by the log2FC and −log10(P value) with DIA-MS data (bottom). B Western blot analysis of anti-Pol II immunoprecipitates obtained from crosslinking chromatin fractions of Pol III_degron cells that were untreated or treated with IAA for 1 h revealed decreased interaction of FACT (SSRP1 and SPT16) and integrator (INTS3 and INTS11) complex components with Pol II after Pol III depletion. RPB3 is a subunit of Pol II with no change in its interaction with Pol II after the depletion of Pol III. The quantitative data shown under each panel were measured by ImageJ and normalized to the input under untreated conditions based on the representative figure shown. Three independent western blotting analyses were performed. Each showed a similar trend regarding a decreased interaction between FACT and Pol II upon Pol III depletion. However, the technical limitations of western blotting, such as large molecular weight or poor antibody sensitivity, may cause experimental variations. C MA plots showing differential enrichment of SSRP1, INTS3, and TBP ChIP-Seq signals in Pol III_degron cells under 1 h IAA treatment versus untreated conditions at Pol II peaks called in wild-type mESCs. Each dot represents one peak. Red indicates a significant change that meets both criteria of a false discovery rate (FDR) < 0.05 and fold change > 2 (upper). Venn diagrams comparing the Pol II-bound regions that had significantly altered binding affinities for SSRP1 (N = 5520, left), INTS3 (N = 332, middle), or TBP (N = 190, right) after Pol III depletion, as shown in the top panel, and the differential Pol II peaks upon Pol III depletion (N = 2526), as shown in Fig. 2D (bottom). D Venn diagrams showing the overlap of active promoters with significantly reduced SSRP1 (N = 4147, upper) or INTS3 (N = 95, lower) binding affinities with genebody-up mRNA genes upon Pol III depletion (N = 773). E Under the same representations described in Fig. 4A, downregulated mRNA genes upon Pol III depletion in SSRP1, INTS3, and TBP ChIP-Seq as identified in Fig. 6C were clustered based on their distance from the nearest Pol III-bound peaks and expressed tRNAs in 50 bp bins. Equal numbers of unchanged active genes and silent genes were selected as the control group. The y-axis in Fig. 6E represents the normalized counts of Pol III peaks or tRNAs by calculating their average density within 10 kb of the Pol II gene TSS for each category. F Bar graphs showing relative SSRP1, Pol II, and Pol III ChIP enrichment normalized to input (5%) at the presented example genes under Pol III untreated, + IAA 10 min, 20 min, 30 min, and 1 h conditions. Each sample was analyzed with two technical replicates per biological replicate and two biological replicates in total. Statistical significance was evaluated by Student’s t test (**: <0.01, *: <0.05). G Bar graphs showing relative SSRP1 ChIP enrichment normalized to input (5%) at the presented example genes under Pol III untreated, + IAA 1 h and +IAA 1 h followed by 6 h IAA withdrawal conditions. Each sample was analyzed with two technical replicates per biological replicate and two biological replicates in total. Statistical significance was evaluated by Student’s t test (**: <0.01, *: <0.05). H Under the same representations described in Fig. 4F, NET-seq data in mES cells were obtained from the public dataset (GSE90906). The average signal levels at the gene bodies using the gene groups from Fig. 4A were calculated and presented as metaplots and violin plots. The p value was calculated using the Mann–Whitney test
Fig. 7
Fig. 7
Pol III depletion increased nucleosome occupancy as an underlying mechanism related to slow down the Pol II transcription rate. A Mean coverage profiles for the ratio of PRO-Seq over Pol II ChIP-Seq signal (PRO-Seq/Pol II ChIP-Seq), as a proxy for transcription rate, and the ratio of EU-Seq over Pol II ChIP-Seq signal (EU-Seq/Pol II ChIP-Seq) upon RPC1 or RPAC1 depletion. Violin plots showing the quantification of the ratio changes for each group of gene sets in the right panel. The p value was calculated using the Mann–Whitney test. B Metaplots of H3K36me3 and S2P Pol II ChIP-Seq over the gene body regions of genebody-up mRNAs (N = 773, blue) and genebody-unaffected mRNAs (N = 3290, green) upon Pol III depletion. Violin plots showing the changes in ChIP-Seq signals over genebody-up or genebody-unaffected mRNA genes by Pol II upon depletion of Pol III, as shown in Fig. 3B (right). The p value was calculated using the Mann–Whitney test. C Genome browser track at the 8,269,424-8,592,237 region on chromosome 15 for Pol II ChIP-Seq signals in Pol III_degron and RPAC1_degron cells and SSRP1 ChIP-Seq signals in Pol III_degron cells that were untreated or treated with IAA for 1 h. PRO-Seq and ATAC-Seq in Pol III_degron cells that were untreated or treated with IAA for 1 h and Pol III ChIP-Seq in wild-type mESCs are shown in the same region. Only sense strand signals of PRO-Seq and ChAR-Seq are presented, and all tracks are flipped horizontally. D Upper panel: workflow of the DRB treatment assay with Pol III_degron cells that were untreated or treated with IAA for 1 h. Bottom panel: bar graphs showing relative ChIP enrichment normalized to input (5%) at the locus indicated in Fig. 7C. Each sample was analyzed with two technical replicates per biological replicate and two biological replicates in total. Statistical significance was evaluated by Student’s t test (**: <0.01, *: <0.05). E Heatmap representing the gene expression levels of the genebody-up genes upon Pol III depletion (n=773) from time-series RNA-Seq data (Pol III depletion for 0, 24, 48, and 96 h with two biological replicates). Each row represents the z score-transformed log2 (FPKM+1) values for one gene across different time points (green, low expression; red, high expression). F Working model for the cross-regulatory relationship between Pol II and Pol III by maintaining local chromatin structure. Pol II and Pol III help each other to destabilize nucleosome positioning and facilitate FACT-mediated chromatin structures maintenance when they occupy nearby regions in the genome

Similar articles

Cited by

References

    1. Roeder RG, Rutter WJJN. Multiple forms of DNA-dependent RNA polymerase in eukaryotic organisms. Nature. 1969;224:234–237. doi: 10.1038/224234a0. - DOI - PubMed
    1. Cramer P. Eukaryotic transcription turns 50. Cell. 2019;179:808–812. doi: 10.1016/j.cell.2019.09.018. - DOI - PubMed
    1. Lis JT. A 50 year history of technologies that drove discovery in eukaryotic transcription regulation. Nat Struct Mol Biol. 2019;26:777–782. doi: 10.1038/s41594-019-0288-9. - DOI - PMC - PubMed
    1. Roeder RG. Lasker Basic Medical Research Award. The eukaryotic transcriptional machinery: complexities and mechanisms unforeseen. Nat Med. 2003;9:1239–1244. doi: 10.1038/nm938. - DOI - PubMed
    1. Seifart KH, Sekeris CE. Alpha-amanitin, a specific inhibitor of transcription by mammalian RNA-polymerase. Z Naturforsch B. 1969;24:1538–1544. doi: 10.1515/znb-1969-1211. - DOI - PubMed

Publication types