. 2022 Nov 28;13(11):1007.
doi: 10.1038/s41419-022-05456-7.

Ciclopirox drives growth arrest and autophagic cell death through STAT3 in gastric cancer cells

Affiliations

Ciclopirox drives growth arrest and autophagic cell death through STAT3 in gastric cancer cells

Lingyan Chen et al. Cell Death Dis. .

Abstract

Ciclopirox (CPX), an antifungal drug, has recently been identified as a promising agent for cancer treatment. However, the effects and underlying mechanism of CPX as an antitumor agent of gastric cancer (GC) remain largely unknown. Here, we found that CPX dramatically suppresses GC xenograft growth in vitro via inhibiting proliferation and stimulating autophagic cell death rather than apoptosis. Moreover, CPX (20 mg/kg, intraperitoneally) substantially inhibits GC xenograft tumor growth in vivo. Mechanistically, CPX promotes growth arrest and autophagic cell death through suppressing the phosphorylation of signal transducers and activators of transcription 3 (STAT3) at tyrosine 705 (Tyr705) and serine 727 (Ser727) sites, respectively. Additionally, CPX induces STAT3 ubiquitination, which subsequently leads to a decrease in the p-STAT3 (Ser727) level. On the other hand, CPX represses the p-STAT3 (Tyr705) level via p-Src (Tyr416) inhibition. Collectively, our findings unmask a novel mechanism by which CPX regulates growth and autophagic cell death in GC cells via regulating the phosphorylation of STAT3 both at Tyr705 and Ser727 residues, and suggest that CPX may be a potential treatment for GC.


Conflict of interest statement

The authors declare no competing interests.

Figures
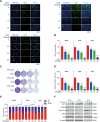
Fig. 1
Fig. 1. CPX remarkably inhibits GC cell proliferation in vitro.
A, B Proliferation of MGC, AGS, and SGC cells treated with various concentrations of CPX for 24 h. Cell proliferation was detected using an EdU cell proliferation kit with Alexa Fluor 488 (Scale bar, 200 µm) (A). EdU incorporation was quantified using ImageJ Plus software (B). Data were shown as mean ± SD (n = 3, *P < 0.05, **P < 0.01, ***P < 0.001, ****P < 0.0001). C, D Colony formation of MGC, AGS, and SGC cells treated with various concentrations of CPX for 1–2 weeks. Cell colonies were stained with 0.1% crystal violet solution (C). Colony numbers were counted using ImageJ Plus software (D). Data were shown as mean ± SD (n = 3, ***P < 0.001, ****P < 0.0001). E Cell cycle arrest assay analysis of MGC, AGS, and SGC cells treated with a serial dose of CPX for 24 h. The percentage of cell cycle distribution was analyzed using flow cytometry. Data were shown as mean ± SD (n = 3, **P < 0.01, ***P < 0.001, ****P < 0.0001). F The protein levels of cell cycle-related proteins were examined using Western blotting analysis.
Fig. 2
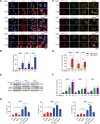
Fig. 2. CPX induces autophagic death of GC cells.
A, B The LC3 fluorescence in GC cells treated with CPX at the indicated concentration (MGC: 10 µM; AGS: 10 µM; SGC: 40 µM) for 24 h. Representative images of endogenous LC3 puncta (Scale bar, 40 µm) (A). The relative ratio of LC3 puncta to cell number was quantified using ImageJ Plus software (B). Data were shown as mean ± SD (n = 3, **P < 0.01, ***P < 0.001).C, D GC cells were transiently transfected mRFP-GFP-tagged LC3 and treated with CPX at the indicated concentration (MGC: 10 µM; AGS: 10 µM; SGC: 40 µM) for 24 h. Representative images of red or green LC3 puncta (Scale bar, 40 µm) (C). The relative ratio of red puncta (autolysosome, GFP-/RFP+) to yellow puncta (autophagosome, GFP+/RFP+) was quantified using ImageJ Plus software (D). Data were shown as mean ± SD (n = 3, **P < 0.01, ***P < 0.001). E, F Western blotting analysis of autophagy-related protein LC3 and p62 in MGC, AGS, and SGC cells treated with various concentrations of CPX for 24 h. Representative protein levels of LC3 and p62 were shown (E) and the relative ratio of LC3-II to β-actin from three independent experiments (F). Data were shown as mean ± SD (n = 3, *P < 0.05, ** P < 0.01, ***P < 0.001, ****P < 0.0001, or n.s., not significant by unpaired Student’s t test). G Cell death of GC cells co-treated with CPX (MGC: 10 µM; AGS: 10 µM; SGC: 40 µM) and RAPA (MGC: 50 nM; AGS: 50 nM; SGC: 100 nM) or BafA1 (20 nM) for 24 h and stained with PI was analyzed using flow cytometry. Data were shown as mean ± SD (n = 3, *P < 0.05, **P < 0.01, ***P < 0.001, ****P < 0.0001).
Fig. 3
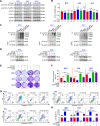
Fig. 3. CPX induces proliferation inhibition and autophagic death by promoting STAT3 ubiquitination in GC cells.
A Western blotting analysis of p-STAT3 (Ser727), p-STAT3 (Tyr705). STAT3, STAT1, and STAT6 in GC cells treated with a serial dose of CPX for 24 h. B RT-qPCR analysis of STAT3 mRNA levels in GC cells treated with a different dose of CPX for 24 h. Data were shown as mean ± SD (n = 3, n.s., not significant by unpaired Student’s t test). C Ubiquitination of STAT3 in GC cells treated with a serial dose of CPX for 24 h was detected using immunoprecipitation. D Western blotting analysis demonstrating STAT3 overexpression in the indicated GC cells with or without CPX for 24 h. E, F Colony formation of STAT3-overexpressing cell lines treated with CPX for 1–2 weeks. Cell colonies were stained with 0.1% crystal violet solution (E). Colony numbers were counted using ImageJ Plus software (F). Data were shown as mean ± SD (n = 3, *P < 0.05, ***P < 0.001, ****P < 0.0001). G, H Cells treated with CPX (MGC: 10 µM; AGS: 10 µM; SGC: 40 µM) for 24 h and then stained with annexin V-FITC/PI were determined using flow cytometry (G). The cell death rate was plotted followed by statistical analysis (H). Data were shown as mean ± SD (n = 3, **P < 0.01, *** P < 0.001, ****P < 0.0001).
Fig. 4
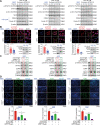
Fig. 4. CPX decreases p-STAT3 (Tyr705) to promote proliferation inhibition in GC cells.
A The protein levels of p-STAT3 (Tyr705), STAT3, p-Src (Tyr416), Src, CDK4, and Cyclin D1 in GC cells pretreated with MG132 (MGC: 100 nM; AGS: 100 nM; SGC: 200 nM) for 24 h and then treated with CPX at different times. B The levels of p-STAT3 (Tyr705) in the nucleus and cytoplasm of GC cells treated with CPX (MGC: 10 µM; AGS: 10 µM; SGC: 40 µM) for 24 h. Representative images of p-STAT3 (Tyr705) and the ratio of nuclear to cytoplasmic fluorescence were shown (Scale bar, 25 µm). The protein levels of p-STAT3 (Tyr705) in the nucleus and cytoplasm of GC cells were analyzed by nuclear/cytosolic fractionation and Western blotting. Data were shown as mean ± SD (n = 3, ****P < 0.0001). C Western blotting analysis of p-STAT3 (Tyr705), STAT3, CDK4, and LC3 protein levels in STAT3Y705F cell lines treated with CPX for 24 h. D The proliferation of STAT3Y705F GC cells after being treated with CPX for 24 h was detected using an EdU Cell Proliferation kit with Alexa Fluor 488. EdU incorporation was quantified using ImageJ Plus software (Scale bar, 200 µm). Data were shown as mean ± SD (n = 3, *P < 0.05, **P < 0.01).
Fig. 5
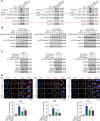
Fig. 5. CPX induces autophagy of GC cells through targeting p-STAT3 (Ser727).
A The interaction between p-ERK (Thr202/Tyr204) and STAT3 in GC cells treated with CPX for 24 h. B The protein levels of p-ERK (Thr202/Tyr204), ERK1/2, p-STAT3 (Ser727), and STAT3 in GC cells pretreated with MG132 (MGC: 100 nM; AGS: 100 nM; SGC: 200 nM) for 24 h and then treated with CPX at different times. C Western blotting analysis of p-STAT3 (Ser727), STAT3, CDK4, and LC3 protein levels in STAT3S727A GC cells treated with CPX for 24 h. D The endogenous LC3 puncta fluorescence in STAT3S727A GC cells treated with CPX for 24 h. The ratio of LC3 puncta to cell number was quantified using ImageJ Plus software (Scale bar, 40 µm). Data were shown as mean ± SD (n = 3, **P < 0.01, *** P < 0.001, **** P < 0.0001, or n.s., not significant by unpaired Student’s t test).
Fig. 6
Fig. 6. CPX inhibits tumor growth in a mouse xenograft model of GC.
AD Tumor-bearing nude mice of MGC, AGS, and SGC cells (4 mice per group) were intraperitoneally injected with 0.9% NaCl or CPX (20 mg/kg), respectively. Images of dissected tumors from tumor-bearing mice were shown (A). Tumor volume was measured once in 2 days (B). Tumor weight was measured after 12 days of consecutive injections (C). Changes in the mean body weight from mice treated with 0.9% NaCl or CPX (D). Data were shown as mean ± SD (n = 4, *P < 0.05, **P < 0.01, or n.s., not significant by unpaired Student’s t test). E Images of immunohistochemistry staining of Ki67, LC3, STAT3, and p-STAT3 (Tyr705) in the tumor of GC mouse xenograft model intraperitoneally injected with 0.9% NaCl or CPX (Scale bar, 100 µm).
Fig. 7
Fig. 7. The proposed antitumorigenic mechanism of CPX on GC growth.
CPX treatment induces cell cycle arrest and then inhibits GC cell proliferation by regulating the p-Src (Tyr416)/p-STAT3 (Tyr705) pathway. Moreover, CPX enhances autophagic death by inducing total STAT3 ubiquitination and decreasing p-STAT3 (Ser727) levels in GC cells.

Similar articles

Cited by

References

    1. Sung H, Ferlay J, Siegel RL, Laversanne M, Soerjomataram I, Jemal A, et al. Global cancer statistics 2020: GLOBOCAN estimates of incidence and mortality worldwide for 36 cancers in 185 countries. Ca Cancer J Clin. 2021;71:209–49. doi: 10.3322/caac.21660. - DOI - PubMed
    1. Joshi SS, Badgwell BD. Current treatment and recent progress in gastric cancer. Ca Cancer J Clin. 2021;71:264–79.. doi: 10.3322/caac.21657. - DOI - PMC - PubMed
    1. Bang YJ, Van Cutsem E, Feyereislova A, Chung H, Shen L, Sawaki A, et al. Trastuzumab in combination with chemotherapy versus chemotherapy alone for treatment of HER2-positive advanced gastric or gastro-oesophageal junction cancer (ToGA): a phase 3, open-label, randomised controlled trial. Lancet. 2010;376:687–97. doi: 10.1016/S0140-6736(10)61121-X. - DOI - PubMed
    1. Brower V. Apatinib in treatment of refractory gastric cancer. Lancet Oncol. 2016;17:e137. doi: 10.1016/S1470-2045(16)00138-8. - DOI - PubMed
    1. Aftab BT, Dobromilskaya I, Liu JO, Rudin CM. Itraconazole inhibits angiogenesis and tumor growth in non-small cell lung cancer. Cancer Res. 2011;71:6764–72. doi: 10.1158/0008-5472.CAN-11-0691. - DOI - PMC - PubMed

Publication types