

Small noncoding vault RNA2-1 disrupts gut epithelial barrier function via interaction with HuR
- PMID: 36440604
- PMCID: PMC9900329
- DOI: 10.15252/embr.202254925
Small noncoding vault RNA2-1 disrupts gut epithelial barrier function via interaction with HuR
Abstract
Vault RNAs (vtRNAs) are small noncoding RNAs and highly expressed in many eukaryotes. Here, we identified vtRNA2-1 as a novel regulator of the intestinal barrier via interaction with RNA-binding protein HuR. Intestinal mucosal tissues from patients with inflammatory bowel diseases and from mice with colitis or sepsis express increased levels of vtRNAs relative to controls. Ectopically expressed vtRNA2-1 decreases the levels of intercellular junction (IJ) proteins claudin 1, occludin, and E-cadherin and causes intestinal epithelial barrier dysfunction in vitro, whereas vtRNA2-1 silencing promotes barrier function. Increased vtRNA2-1 also decreases IJs in intestinal organoid, inhibits epithelial renewal, and causes Paneth cell defects ex vivo. Elevating the levels of tissue vtRNA2-1 in the intestinal mucosa increases the vulnerability of the gut barrier to septic stress in mice. vtRNA2-1 interacts with HuR and prevents HuR binding to claudin 1 and occludin mRNAs, thus decreasing their translation. These results indicate that vtRNA2-1 impairs intestinal barrier function by repressing HuR-facilitated translation of claudin 1 and occludin.
Keywords: RNA-binding proteins; gut permeability; mucosal defense; posttranscriptional regulation; vault RNAs.
© 2022 The Authors.
Figures
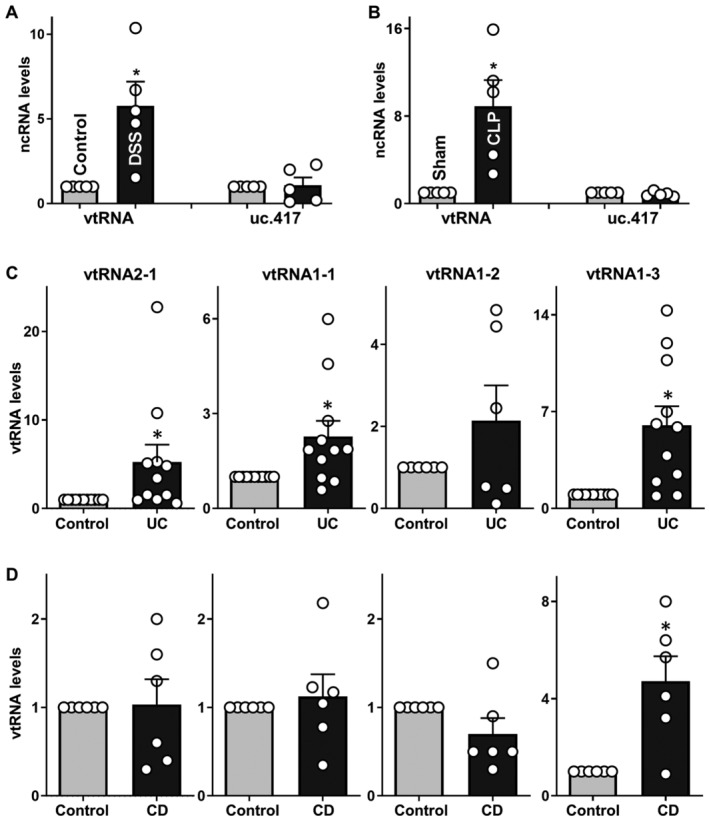
Levels of mucosal vtRNA and uc.417 in the colons of mice treated with 3% DSS for 5 days, as measured by RT‐Q‐PCR analysis. Values are the means ± SEM (n = 5 mice per group). Unpaired, two‐tailed Student's t‐test was used. *P < 0.05 compared with control mice.
Levels of mucosal vtRNA and uc.417 in the small intestines of mice exposed to CLP for 24 h. Values are the means ± SEM (n = 5 mice per group). Unpaired, two‐tailed Student's t‐test was used. *P < 0.05 compared with sham mice.
Levels of mucosal vtRNA2‐1, vtRNA1‐1, vtRNA1‐2, and vtRNA1‐3 in the colon of patients with active ulcerative colitis (UC). Values are the means ± SEM (n = 6 per group). Unpaired, two‐tailed Student's t‐test was used. *P < 0.05 compared with controls.
Levels of tissue vtRNAs in the ileal mucosa of patients with Crohn's disease (CD). Values are the means ± SEM (n = 6 per group). Unpaired, two‐tailed Student's t‐test was used. *P < 0.05 compared with controls.
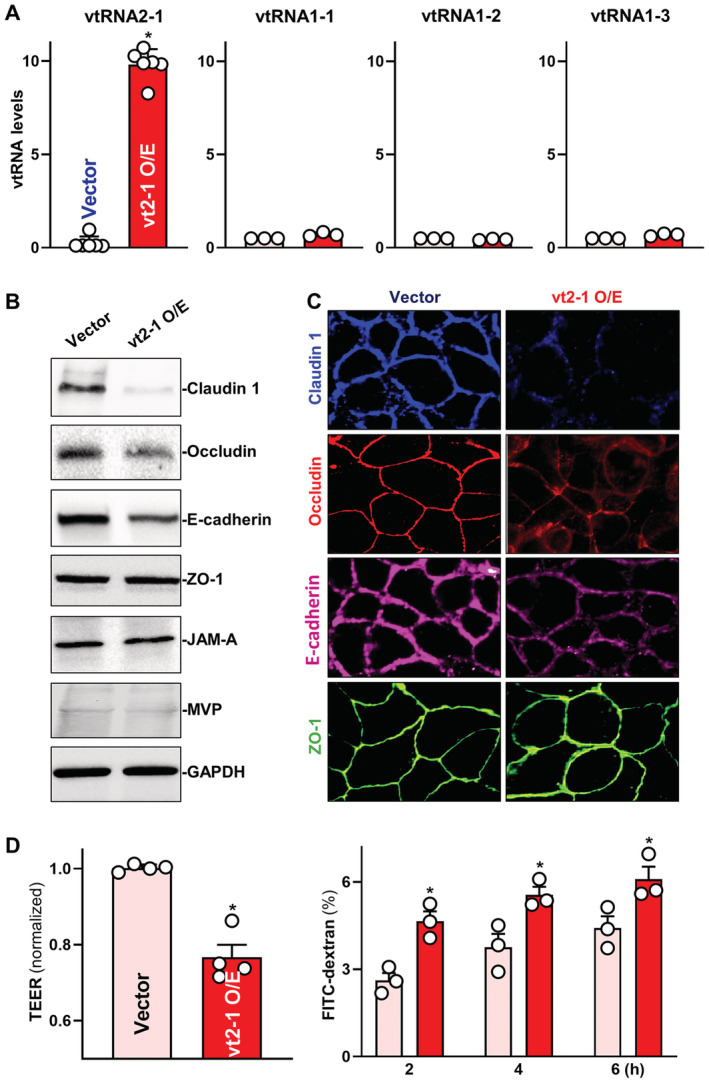
Levels of vtRNAs in Caco‐2 cells 48 h after transfection with vtRNA2‐1 expression vector (vt2‐1). Values are the means ± SEM (n = 6 or 3 biological replicates). Unpaired, two‐tailed Student's t‐test was used. *P < 0.05 compared with control vector.
Expression levels of claudin 1, occludin, E‐cadherin, ZO‐1, JAM‐A, and MVP in cells described in (A). Hsc70 immunoblotting was performed as an internal control for equal loading.
Distribution of claudin 1, occludin, E‐cadherin, and ZO‐1 in cells treated as described in (A). Forty‐eight hours after transfection, cells were fixed, permeabilized, and incubated first with antibodies against different intercellular junction proteins and then with FITC‐conjugated anti‐IgG. Original magnification, ×500. Three separate experiments were performed and showed similar results.
Changes in TEER (left) and FITC‐dextran paracellular permeability (right) in cells treated as described in (A). TEER assays were performed on 12‐mm Transwell filters; paracellular permeability was assayed by adding the membrane‐impermeable trace molecule FITC‐dextran to the insert medium. Values are the means ± SEM (n = 3 biological replicates). Unpaired, two‐tailed Student's t‐test was used. *P < 0.05 compared with control vector.
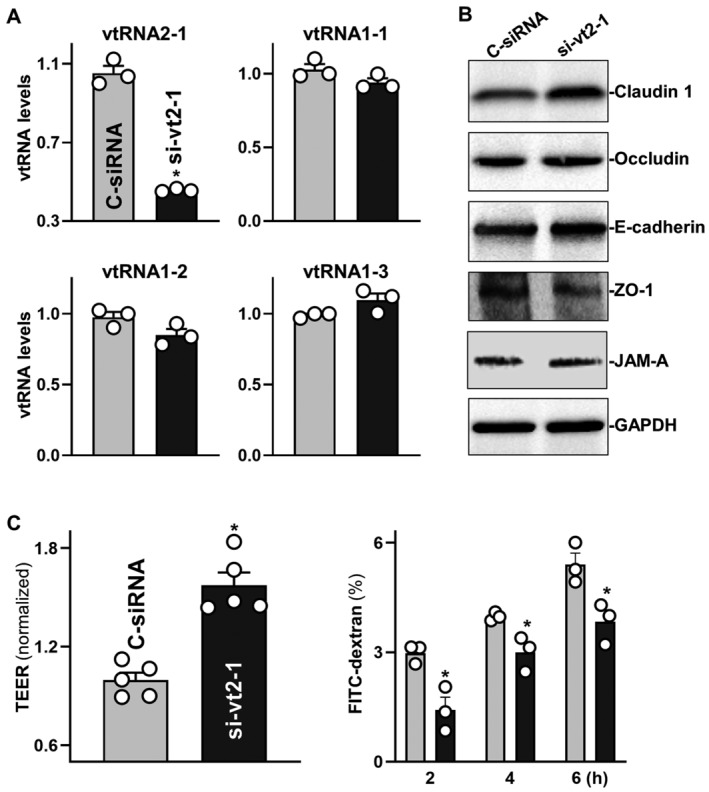
Levels of vtRNAs in Caco‐2 cells 48 h after transfection with the siRNA targeting vtRNA2‐1 (si‐vt2‐1) or control siRNA (C‐siRNA). Values are the means ± SEM (n = 3 biological replicates). Unpaired, two‐tailed Student's t‐test was used. *P < 0.05 compared with C‐siRNA.
Immunoblots of claudin 1, occludin, E‐cadherin, ZO‐1, and JAM‐A in cells treated as described in (A). Hsc70 immunoblotting served as an internal control for equal loading. Three separate experiments were performed and showed similar results.
Changes in TEER (left) and FITC‐dextran paracellular permeability (right) in cells treated as described in (A). Values are the means ± SEM (n = 3 biological replicates). Unpaired, two‐tailed Student's t‐test was used. *P < 0.05 compared with C‐siRNA.
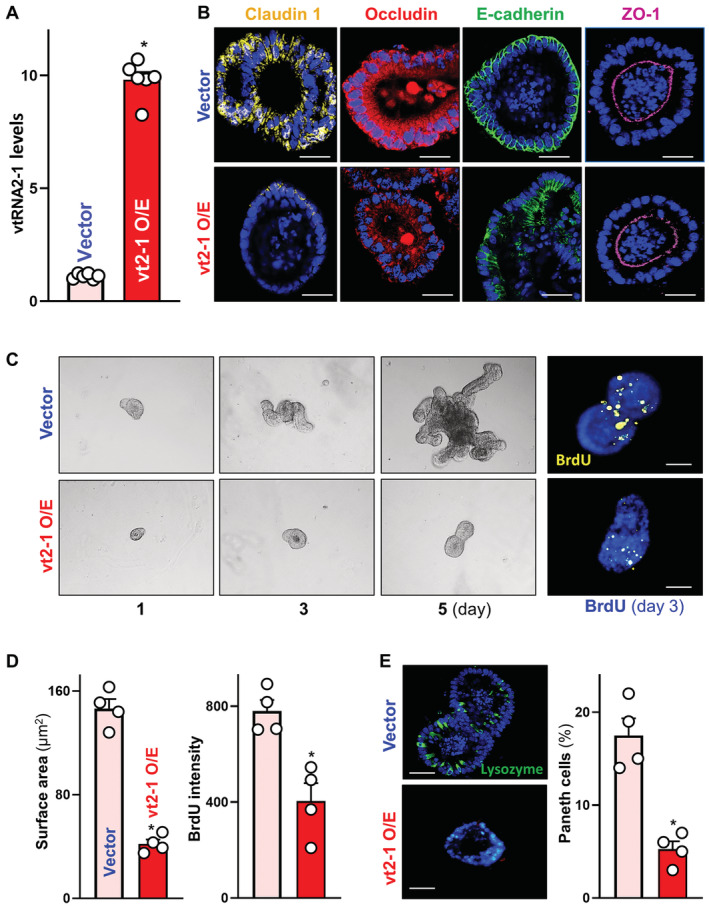
Levels of vtRNA2‐1 in primarily cultured intestinal organoids 48 h after transfection with vtRNA2‐1 expression vector (vt2‐1). Organoids were derived from proximal small intestine and grown in the indicated conditions. Values are the means ± SEM (n = 6 biological replicates). Unpaired, two‐tailed Student's t‐test was used. *P < 0.05 compared with control vector.
Images of immunofluorescence staining of claudin 1, occludin, E‐cadherin, and ZO‐1 in intestinal organoids treated as described in (A). Scale bars, 100 μm. Three separate experiments showed similar results.
Sizes of intestinal organoids at different times after vtRNA2‐1 overexpression. Left, bright field microscopy analysis of growth of organoids; right, confocal analysis of BrdU (yellow) and DAPI (blue) on day 3 after culture. Scale bars, 100 μm.
Quantitative data of surface area of organoids (left) and BrdU (right) in organoids treated as described in (C). Values are means ± SEM (n = 4 biological replicates). Unpaired, two‐tailed Student's t‐test was used. *P < 0.05 compared with control vector.
Immunostaining (left) of Paneth (lysozyme‐positive) cells and quantitative data (right) in intestinal organoids treated as described in (A). Lysozyme: green. Scale bars, 100 μm. Values are means ± SEM (n = 4 biological replicates). Unpaired, two‐tailed Student's t‐test was used. *P < 0.05 compared with control vector.
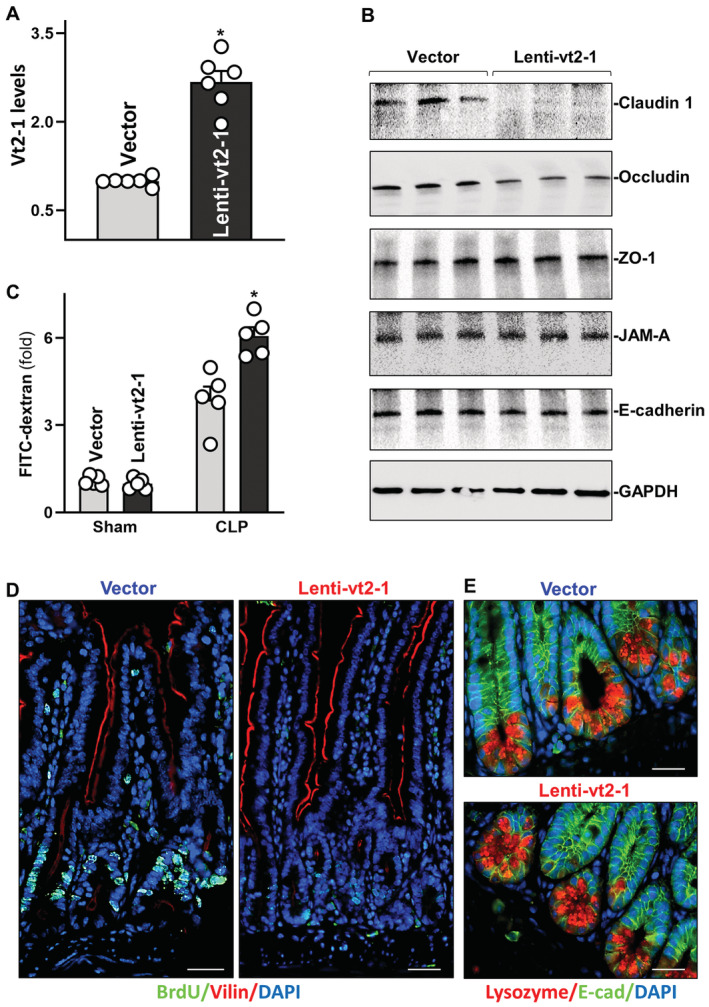
Levels of vtRNA2‐1 in the small intestinal mucosa of mice on day 5 after intraperitoneal injection with a recombinant vtRNA2‐1 lentiviral expression vector (Lenti‐vt2‐1) or empty control lentiviral vector (vector). Values are means ± SEM (n = 6 biological replicates). Unpaired, two‐tailed Student's t‐test was used. *P < 0.05 compared with vector.
Immunoblots of claudin 1, occludin, JAM‐A, ZO‐1, and E‐cadherin in the mucosa from mice treated as described in (A). GAPDH immunoblotting served as an internal control for equal loading.
Changes in gut permeability in sham‐ and CLP (septic stress)‐mice. CLP was induced on day 5 after injection with lenti‐vt2‐1 or control vector. FITC‐dextran was given orally 20 h after CLP, and blood samples were collected 4 h later. Values are means ± SEM (n = 5 biological replicates). Unpaired, two‐tailed Student's t‐test was used. *P < 0.05 compared with vector.
Proliferating cells as measured by BrdU labeling assays in the mucosa from mice treated as described in (A). BrdU (1 h post‐injection, S phase): green. Scale bars, 25 μm. Experiments were repeated in four mice injected with either lenti‐vt2‐1 or control vectors and showed similar results.
Paneth cells (lysozyme‐positive cells) in the small intestinal mucosa from mice treated as described in (A). Lysozyme: red. Scale bars, 25 μm.
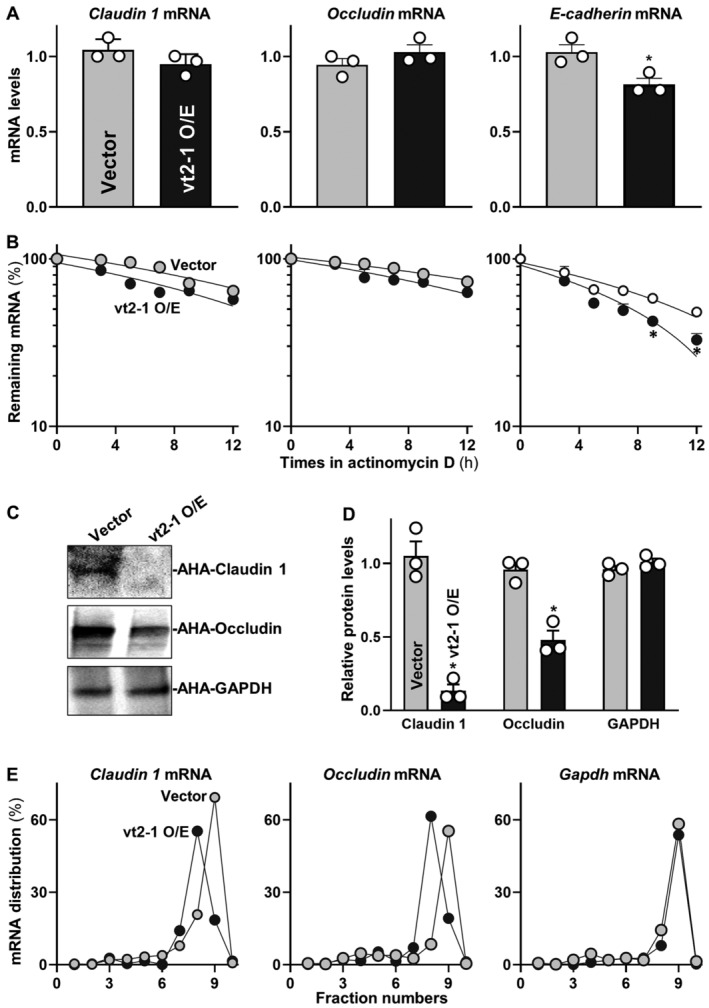
Levels of claudin‐1, occludin, and E‐cadherin mRNAs in Caco‐2 cells 48 h after transfection with vtRNA2‐1 expression vector. Values are means ± SEM (n = 3 biological replicates). Unpaired, two‐tailed Student's t‐test was used. *P < 0.05 compared with control vector.
Stability of the mRNAs in cells treated as described in (A). The mRNA levels were examined at different times after administration with actinomycin D. Values are means ± SEM (n = 3 biological replicates). Unpaired, two‐tailed Student's t‐test was used. *P < 0.05 compared with control vector.
Newly synthesized claudin 1 and occludin proteins in cells treated as described in (A). After cells were exposed to L‐azidohomoalaine (AHA), cell lysates were incubated with the reaction buffer containing biotin/alkyne reagent; the biotin‐alkyne‐azide‐modified protein complex was pulled down by paramagnetic streptavidin‐conjugated dynabeads.
Quantitative data of immunoblots shown in (C). Values are means ± SEM (n = 3 biological replicates). Unpaired, two‐tailed Student's t‐test was used. *P < 0.05 compared with control vector.
Distribution of claudin 1 (left), occludin (center), and GAPDH (right) mRNAs in each gradient fraction of polysomal profiles prepared from cells treated as described in (A).
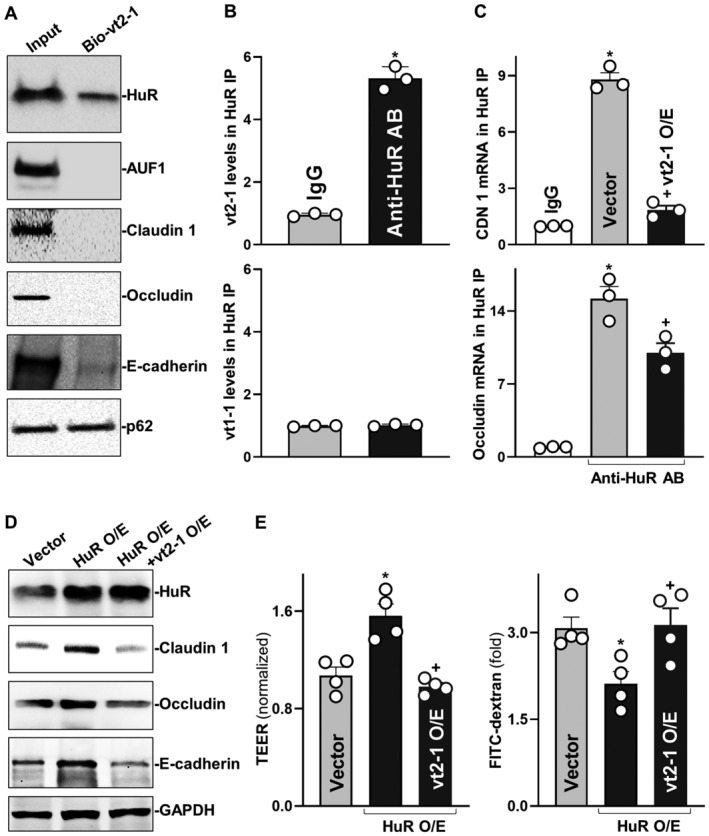
Association of vtRNA2‐1 with HuR in Caco‐2 cells as measured by biotin‐labeled RNA pull‐down assays. After cytoplasmic lysates were incubated with biotinylated vtRNA2‐1, levels of HuR and other proteins in the pull‐down material were assessed. Three separate experiments showed similar results.
Association of endogenous HuR with endogenous vtRNA2‐1 (top) and vtRNA1‐1 (bottom). After immunoprecipitation (IP) of RNA‐protein complexes from cell lysates using anti‐HuR antibody (AB) or control IgG, RNAs were isolated and measured by RT‐Q‐PCR analysis. Values are means ± SEM (n = 3 biological replicates). Unpaired, two‐tailed Student's t‐test was used. *P < 0.05 compared with IgG.
Effect of increasing the levels of vtRNA2‐1 on HuR binding to claudin 1 (CDN 1; top) and occludin (bottom) mRNAs. Twenty‐four hours after cells were transfected with vtRNA2‐1 expression vector, the levels of CLDN1 and occludin mRNAs in the materials pulled down by anti‐HuR AB were examined. Values are means ± SEM (n = 3 biological replicates). One‐way ANOVA was utilized with Tukey's post hoc test. *, + P < 0.05 compared with IgG or cells transfected with control vector, respectively.
Changes in the expression levels of claudin‐1, occludin, and E‐cadherin proteins 48 h after cells were transfected with HuR expression vector alone or co‐transfected with HuR and vtRNA2‐1 expression vectors.
Changes in TEER (left) and FITC‐dextran paracellular permeability (right) in cells treated as described in (D). Values are the means ± SEM (n = 4 biological replicates). One‐way ANOVA was utilized with Tukey's post hoc test. *, + P < 0.05 compared with cells transfected with control vector or cells transfected with HuR expression vector alone, respectively.
Similar articles
-
Interaction between microRNA-195 and HuR regulates Paneth cell function in the intestinal epithelium by altering SOX9 translation.Am J Physiol Cell Physiol. 2024 Sep 1;327(3):C817-C829. doi: 10.1152/ajpcell.00325.2024. Epub 2024 Aug 5. Am J Physiol Cell Physiol. 2024. PMID: 39099425
-
Human antigen R (HuR) and Cold inducible RNA-binding protein (CIRP) influence intestinal mucosal barrier function in ulcerative colitis by competitive regulation on Claudin1.Biofactors. 2021 May;47(3):427-443. doi: 10.1002/biof.1719. Epub 2021 Feb 27. Biofactors. 2021. PMID: 33638934
-
Regulation of Intestinal Epithelial Barrier Function by Long Noncoding RNA uc.173 through Interaction with MicroRNA 29b.Mol Cell Biol. 2018 Jun 14;38(13):e00010-18. doi: 10.1128/MCB.00010-18. Print 2018 Jul 1. Mol Cell Biol. 2018. PMID: 29632078 Free PMC article.
-
HuR and Its Interactions with Noncoding RNAs in Gut Epithelium Homeostasis and Diseases.Front Biosci (Landmark Ed). 2023 Oct 25;28(10):262. doi: 10.31083/j.fbl2810262. Front Biosci (Landmark Ed). 2023. PMID: 37919092 Review.
-
Regulation of Paneth Cell Function by RNA-Binding Proteins and Noncoding RNAs.Cells. 2021 Aug 17;10(8):2107. doi: 10.3390/cells10082107. Cells. 2021. PMID: 34440876 Free PMC article. Review.
Cited by
-
Stabilization of Cx43 mRNA via RNA-binding protein HuR regulated by polyamines enhances intestinal epithelial barrier function.Am J Physiol Gastrointest Liver Physiol. 2023 Dec 1;325(6):G518-G527. doi: 10.1152/ajpgi.00143.2023. Epub 2023 Oct 3. Am J Physiol Gastrointest Liver Physiol. 2023. PMID: 37788332 Free PMC article.
-
Crosstalk between vault RNAs and innate immunity.Mol Biol Rep. 2024 Mar 5;51(1):387. doi: 10.1007/s11033-024-09305-y. Mol Biol Rep. 2024. PMID: 38443657 Free PMC article. Review.
-
Control of Paneth cell function by HuR regulates gut mucosal growth by altering stem cell activity.Life Sci Alliance. 2023 Sep 11;6(11):e202302152. doi: 10.26508/lsa.202302152. Print 2023 Nov. Life Sci Alliance. 2023. PMID: 37696579 Free PMC article.
-
Human Vault RNAs: Exploring Their Potential Role in Cellular Metabolism.Int J Mol Sci. 2024 Apr 6;25(7):4072. doi: 10.3390/ijms25074072. Int J Mol Sci. 2024. PMID: 38612882 Free PMC article. Review.
-
Posttranscriptional Regulation of Intestinal Mucosal Growth and Adaptation by Noncoding RNAs in Critical Surgical Disorders.J Invest Surg. 2024 Dec;37(1):2308809. doi: 10.1080/08941939.2024.2308809. Epub 2024 Feb 7. J Invest Surg. 2024. PMID: 38323630 Review.
References
Publication types
MeSH terms
Substances
Grants and funding
LinkOut - more resources
Full Text Sources
Miscellaneous
