A pyroptosis expression pattern score predicts prognosis and immune microenvironment of lung squamous cell carcinoma
- PMID: 36437960
- PMCID: PMC9685532
- DOI: 10.3389/fgene.2022.996444
A pyroptosis expression pattern score predicts prognosis and immune microenvironment of lung squamous cell carcinoma
Abstract
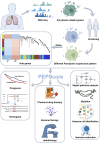
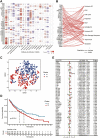
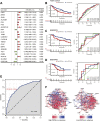
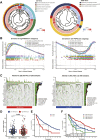
Pyroptosis has been proved to significantly influence the development of lung squamous cell carcinoma (LUSC). To better predict overall survival (OS) and provide guidance on the selection of therapy for LUSC patients, we constructed a novel prognostic biomarker based on pyroptosis-related genes. The dataset for model construction were obtained from The Cancer Genome Atlas and the validation dataset were obtained from Gene Expression Omnibus. Differential expression genes between different pyroptosis expression patterns were identified. These genes were then used to construct pyroptosis expression pattern score (PEPScore) through weighted gene co-expression network analysis, univariate and multivariate cox regression analysis. Afterward, the differences in molecule and immune characteristics and the effect of different therapies were explored between the subgroups divided by the model. The PEPScore was constructed based on six pyroptosis-related genes (CSF2, FGA, AKAP12, CYP2C18, IRS4, TSLP). Compared with the high-PEPScore subgroup, the low-PEPScore subgroup had significantly better OS, higher TP53 and TTN mutation rate, higher infiltration of T follicular helper cells and CD8 T cells, and may benefit more from chemotherapeutic drugs, immunotherapy and radiotherapy. PEPScore is a prospective prognostic model to differentiate prognosis, molecular and immune microenvironmental features, as well as provide significant guidance for selecting clinical therapies.
Keywords: TCGA; immune microenvironment; lung squamous cell carcinoma; prognosis; pyroptosis.
Copyright © 2022 Chen, Wen, Yang, Zheng and Li.
Conflict of interest statement
The authors declare that the research was conducted in the absence of any commercial or financial relationships that could be construed as a potential conflict of interest.
Figures
Similar articles
-
Prediction of lung squamous cell carcinoma immune microenvironment and immunotherapy efficiency with pyroptosis-derived genes.Medicine (Baltimore). 2022 Sep 16;101(37):e30304. doi: 10.1097/MD.0000000000030304. Medicine (Baltimore). 2022. PMID: 36123889 Free PMC article.
-
A Novel Pyroptosis-Related Gene Signature for Early-Stage Lung Squamous Cell Carcinoma.Int J Gen Med. 2021 Oct 5;14:6439-6453. doi: 10.2147/IJGM.S331975. eCollection 2021. Int J Gen Med. 2021. PMID: 34675612 Free PMC article.
-
A novel pyroptosis-related lncRNA prognostic signature associated with the immune microenvironment in lung squamous cell carcinoma.BMC Cancer. 2022 Jun 23;22(1):694. doi: 10.1186/s12885-022-09790-z. BMC Cancer. 2022. PMID: 35739504 Free PMC article.
-
Comprehensive analyses of a CD8+ T cell infiltration related gene signature with regard to the prediction of prognosis and immunotherapy response in lung squamous cell carcinoma.BMC Bioinformatics. 2023 Jun 6;24(1):238. doi: 10.1186/s12859-023-05302-3. BMC Bioinformatics. 2023. PMID: 37280525 Free PMC article.
-
Pyroptosis related genes signature predicts prognosis and immune infiltration of tumor microenvironment in hepatocellular carcinoma.BMC Cancer. 2022 Sep 20;22(1):999. doi: 10.1186/s12885-022-10097-2. BMC Cancer. 2022. PMID: 36127654 Free PMC article.
References
-
- Chen J., Tao Q., Lang Z., Gao Y., Jin Y., Li X., et al. (2022). Signature construction and molecular subtype identification based on pyroptosis-related genes for better prediction of prognosis in hepatocellular carcinoma. Oxid. Med. Cell. Longev. 2022, 4494713. 10.1155/2022/4494713 - DOI - PMC - PubMed
-
- Eschrich S. A., Pramana J., Zhang H., Zhao H., Boulware D., Lee J. H., et al. (2009). A gene expression model of intrinsic tumor radiosensitivity: Prediction of response and prognosis after chemoradiation. Int. J. Radiat. Oncol. Biol. Phys. 75 (2), 489–496. 10.1016/j.ijrobp.2009.06.014 - DOI - PMC - PubMed
LinkOut - more resources
Full Text Sources
Research Materials
Miscellaneous

