. 2022 Nov 27;5(1):1301.
doi: 10.1038/s42003-022-04264-1.

Single-cell multiomics reveals the complexity of TGFβ signalling to chromatin in iPSC-derived kidney organoids

Affiliations

Single-cell multiomics reveals the complexity of TGFβ signalling to chromatin in iPSC-derived kidney organoids

Jessica L Davis et al. Commun Biol. .

Abstract

TGFβ1 plays a regulatory role in the determination of renal cell fate and the progression of renal fibrosis. Here we show an association between SMAD3 and the histone methyltransferase, EZH2, during cell differentiation; ChIP-seq revealed that SMAD3 and EZH2 co-occupy the genome in iPSCs and in iPSC-derived nephron progenitors. Through integration of single cell gene expression and epigenome profiling, we identified de novo ACTA2+ve/POSTN+ve myofibroblasts in kidney organoids treated with TGFβ1, characterised by increased SMAD3-dependent cis chromatin accessibility and gene expression associated with fibroblast activation. We have identified fibrosis-associated regulons characterised by enrichment of SMAD3, AP1, the ETS family of transcription factors, and NUAK1, CREB3L1, and RARG, corresponding to enriched motifs at accessible loci identified by scATACseq. Treatment with the EZH2 specific inhibitor GSK343, blocked SMAD3-dependent cis co-accessibility and inhibited myofibroblast activation. This mechanism, through which TGFβ signals directly to chromatin, represents a critical determinant of fibrotic, differentiated states.


Conflict of interest statement

The authors declare no competing interests.

Figures

Fig. 1
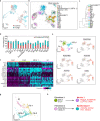
Fig. 1. Genome-wide localisation of SMAD3 and EZH2 in induced pluripotent stem cells and iPSC-derived nephron progenitor cells.
a iPSCs were differentiated towards nephron progenitors using established protocols. Samples for ChIP-seq were taken at day 0 and day 7 of differentiation. b Immunostaining of OCT4, T/Brachury, HOXD11, and PAX2 at days 0, 3, and 7. Magnification, ×40. Scale 50 µm. Images are representative of three independent experiments. c. Western blots showing expression of EZH2, SMAD3, Phosphorylated SMAD3, H3K4me3, H3K27me3 and β-actin over the course of nephrogenic specification. Blots are representative of 3 independent experiments. d SMAD3 and EZH2 co-occupy the genome in iPSCs. Binding plots show the location of SMAD3(left) and EZH2(right) bound sites relative to 971 SMAD3-bound sites. For each SMAD3 bound site (y-axis) the presence of SMAD3 (blue) and EZH2 (grey) sites are displayed within a 10 kb window centred on the SMAD3 bound site. Intensity at position 0 indicates that sites overlap. e Venn diagram illustrating the number of SMAD3 and EZH2 bound loci in iPSCs. f Motifs enriched and SMAD3 and EZH2 overlapping sites in iPSCs. g. SMAD3 and EZH2 co-occupy the genome in NPCs. Binding plots show the location of SMAD3(left) and EZH2(right) bound sites relative to 2416 SMAD3-bound sites. h Venn diagram illustrating the number of SMAD3 and EZH2 bound loci in NPCs. i Motifs enriched at SMAD3 and EZH2 overlapping sites in iPSCs.
Fig. 2
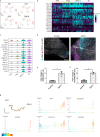
Fig. 2. Single-cell RNA-seq characterisation of iPSC-derived kidney organoids after treatment with TGFβ1.
a UMAP projection of 8176 single cells (4119 Control/4,057 TGFβ1) revealing 17 distinct clusters in iPSC-derived kidney organoids, including new distinct populations of stromal and muscle like cells in response to TGFβ1. Each dot represents a single cell, colour coded for control (red) and TGFβ1 (red). b RNA Velocity Map illustrating altered trajectories of cells in organoid in response to TGFβ1. Long arrows correspond to changes in gene expression and are undergoing differentiation while short arrows represent terminally differentiated cells. c Cluster tree illustrating relationship between new clusters. d Three new populations of cells were apparent in response to TGFβ1 and annotated as MFib1, S1 and Kp2, corresponding to differentiating myofibroblast-like and epithelial populations, respectively. e Expression of PDGFRA, PDGFRB, POSTN, ACTA2, and OGN in Fib1-2 and MFib1, and S1. f Heatmap of selected marker genes used to annotate the MFib1 and S1 clusters. g Cell Phate Map illustrating fate trajectories of Fib 1, Fib 2, MFib1, and S1 within the organoid. h Lineage tree of the fibroblast and stromal clusters in response to TGFβ1.
Fig. 3
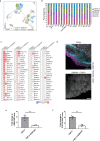
Fig. 3. TGFβ1 induces the differentiation of stromal clusters and activation of fibroblasts.
a UMAPs of differentially upregulated genes in TGFβ1-treated organoids. b Scaled expression of collagens in Fib1-2 and MFib1, and S1. c Violin plots of differentially expressed genes in MFib1 and S1 compared to parent populations Fib1-2. d Organoids were treated with TGFβ1 for 48 h. TGFβ1 induced expression of α-smooth muscle actin (αSMA) and periostin (POSTN) in kidney organoids relative to control Scale bar: Control, 200 µm, TGFβ1, 150 µm. Images are representative of three independent experiments. e αSMA/DAPI area and f POSTN/DAPI area in untreated or TGFβ1 treated organoids. Each symbol represents the mean of 18 randomly imaged fields, taken from one organoid per condition, from three independent experiments. Data are presented as the mean ± SEM. *P ≤ 0.01, **P ≤ 0.0015. g Single-cell trajectory analysis plots of gene expression changes for ACTA2, FN1, COL22A1, COL1A1, and POSTN in Fib2 and MFib1. Cells are coloured by pseudotime.
Fig. 4
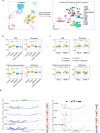
Fig. 4. GSK343 attenuates a subset of TGFβ1-induced fibrotic gene expression.
a Integrated UMAP of scRNAseq data for all conditions. b Bar chart depicting the percentage of cells per cluster in each sample. c Scaled gene expression for MFib1 in control, TGFβ1, and TGFβ1 + GSK343 treated organoids. d Organoids were pre-treated with the EZH2 inhibitor GSK343 for 1 h prior to treatment with TGFβ1 for 48 h. Immunostaining of αSMA and periostin (POSTN) in TGFβ1−, and TGFβ1 + GSK343-treated organoids. Scale bar 150 µm. Images are representative of three independent experiments. e αSMA/DAPI area and f POSTN/DAPI area in TGFβ1 and TGFβ1 + GSK343 treated organoids. Each symbol represents the mean of 18 randomly imaged fields, taken from one organoid per condition, from three independent experiments. Data are presented as the mean ± SEM. **P ≤ 0.01 (αSMA/DAPI area = P ≤ 0.0083; POSTN/DAPI area = P ≤ 0.0017).
Fig. 5
Fig. 5. Integration of single cell RNA-seq and ATAC-seq identifies open chromatin regions and increased accessibility in response to TGFβ1.
a Multi-omics integration strategy for processing the scATACseq dataset. Annotated clusters in the scRNAseq dataset were used to predict cell types in the scATACseq dataset. UMAP plot of scATACseq dataset with gene activity-based cell type assignments. b Global changes in chromatin accessibility at Transcription Start Site (TSS), promoters, enhancers, and DNase I hypersensitivity sites. ****P ≤ 0.0001, pairwise t-test with Bonferroni correction. c Changes in chromatin accessibility at Transcription Start Site (TSS), promoters, enhancers, and DNase I hypersensitivity sites in response to TGFβ1 in Fib2 and MFib1 is inhibited by GSK343. **P ≤ 0.01; ***P ≤ 0.001; ****P ≤ 0.0001; pairwise t-test with Bonferroni correction. d Prediction of cis co-accessibility networks (CCAN) at sample loci in response to TGFβ1 and GSK343. Higher co-accessibility score (red) indicates higher co-accessibility between promoter and enhancer elements.
Fig. 6
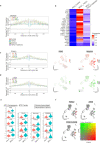
Fig. 6. De novo clusters in response to TGFβ1 represent a “fibrotic” regulon, enriched with motifs for SMAD3 and Fos/Jun.
a Motif-centric footprinting showing enrichment for SMAD3. b Motif activity at accessible regions in MFib1 treated with TGFβ1 or TGFβ1 + GSK343, compared to Fib2 (Control). AP1 motif enrichment in myofibroblasts is decreased by inhibition of EZH2. c, d Motif-centric footprinting showing enrichment for factors associated with a “fibrotic” regulon; Shown are representative SCENIC-UMAPs of the regulons from the top enriched motifs (right hand panels), and the correspondence with scATACseq enriched motifs (centre panels). e Differentially regulated transcription factor networks (“regulons”) associated with AP1 complex, ETS family, and other fibrosis-associated transcription factors in MFib1 compared to its parent cluster Fib 2. f Blended UMAPs of transcription factor regulon for FOSL2 and JUNB identified by SCENIC in MFib1 and S1.

Similar articles

Cited by

References

    1. Ziyadeh FN, et al. Long-term prevention of renal insufficiency, excess matrix gene expression, and glomerular mesangial matrix expansion by treatment with monoclonal antitransforming growth factor-β antibody in db/db diabetic mice. Proc. Natl Acad. Sci. USA. 2000;97:8015–8020. doi: 10.1073/pnas.120055097. - DOI - PMC - PubMed
    1. Sharma K, et al. Increased Renal Production of Transforming Growth Factor- 1 in Patients with Type II Diabetes. Diabetes. 1997;46:854–859. doi: 10.2337/diab.46.5.854. - DOI - PubMed
    1. Sharma K, Jin Y, Guo J, Ziyadeh FN. Neutralization of TGF-beta by anti-TGF-beta antibody attenuates kidney hypertrophy and the enhanced extracellular matrix gene expression in STZ-induced diabetic mice. Diabetes. 1996;45:522–530. doi: 10.2337/diab.45.4.522. - DOI - PubMed
    1. Kasuga H, et al. Effects of anti-TGF-β type II receptor antibody on experimental glomerulonephritis. Kidney Int. 2001;60:1745–1755. doi: 10.1046/j.1523-1755.2001.00990.x. - DOI - PubMed
    1. Chen S, et al. Reversibility of established diabetic glomerulopathy by anti-TGF-β antibodies in db/db mice. Biochem. Biophys. Res. Commun. 2003;300:16–22. doi: 10.1016/S0006-291X(02)02708-0. - DOI - PubMed

Publication types