. 2022 Nov 24;13(11):995.
doi: 10.1038/s41419-022-05441-0.

Naa10p promotes cell invasiveness of esophageal cancer by coordinating the c-Myc and PAI1 regulatory axis

Affiliations

Naa10p promotes cell invasiveness of esophageal cancer by coordinating the c-Myc and PAI1 regulatory axis

Ke-Fan Pan et al. Cell Death Dis. .

Abstract

N-α-acetyltransferase 10 protein, Naa10p, is involved in various cellular functions impacting tumor progression. Due to its capacity to acetylate a large spectrum of proteins, both oncogenic and tumor-suppressive roles of Naa10p have been documented. Here, we report an oncogenic role of Naa10p in promoting metastasis of esophageal cancer. NAA10 is more highly expressed in esophageal cancer tissues compared to normal tissues. Higher NAA10 expression also correlates with poorer survival of esophageal cancer patients. We found that NAA10 expression was transcriptionally regulated by the critical oncogene c-Myc in esophageal cancer. Furthermore, activation of the c-Myc-Naa10p axis resulted in upregulated cell invasiveness of esophageal cancer. This increased cell invasiveness was also elucidated to depend on the enzymatic activity of Naa10p. Moreover, Naa10p cooperated with Naa15p to interact with the protease inhibitor, PAI1, and prevent its secretion. This inhibition of PAI1 secretion may derive from the N-terminal acetylation effect of the Naa10p/Naa15p complex. Our results establish the significance of Naa10p in driving metastasis in esophageal cancer by coordinating the c-Myc-PAI1 axis, with implications for its potential use as a prognostic biomarker and therapeutic target for esophageal cancer.


Conflict of interest statement

The authors declare no competing interests.

Figures
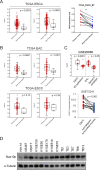
Fig. 1
Fig. 1. NAA10 is highly expressed in both esophageal adenocarcinoma (EAC) and esophageal squamous carcinoma (ESCC).
A Left panel: Comparison of NAA10/15 expression levels between ESCA and normal tissues. Right panel: Comparison of NAA10/15 expression levels in paired ESCA and adjacent normal tissues. B Comparison of NAA10/15 expression levels between cancerous and normal tissues. Upper panel: EAC, lower panel: ESCC. C Comparison of NAA10 expression levels between cancerous, premalignant, and normal tissues. D Western blot analysis of Naa10p in ESCA cell lines and immortalized ES epithelial cell line, Het-1A.
Fig. 2
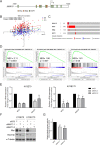
Fig. 2. NAA10 expression in ESCA was regulated by oncogenic c-Myc.
A Predicted binding motifs of transcription factors on NAA10 promoter region in UCSC genome browser. B Correlation plot comparing RNA levels of transcription factors (MYC, MAZ, and E2F1) and NAA10 in TCGA. C Gene alteration frequencies of NAA10, MYC, MAZ, and E2F1 in ESCA from TCGA database. D GSEA analysis identified the MYC signatures among the top ranked activated pathways in NAA10-high ESCA patients (TCGA). E NAA10 expression in MYC-knockdown KYSE70 and KYSE170 were detected by qPCR. F Naa10p expression in c-Myc knockdown KYSE70 and KYSE170 were detected by Western blot. G c-Myc-depleted KYSE70 cells and control cells were transfected with NAA10 reporter and subjected to luciferase activity assays. GSEA gene set enrichment analysis, NES normalized enrichment score.
Fig. 3
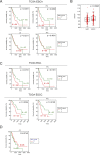
Fig. 3. NAA10 is a prognostic marker of ESCA.
A Kaplan–Meier plot of overall (OS) and progress-free (PFS) survival of ESCA patients stratified by NAA10 expression level. A log rank test was used to show differences between groups. B Comparison of the NAA10 expression level between EAC and ESCC. C Kaplan–Meier plot of OS and PFS survival of EAC or ESCC patients stratified by NAA10 expression level. A log rank test was used to show differences between groups. D Kaplan–Meier plot of overall (OS) survival of ESCA patients stratified by MYC expression level. A log rank test was used to show differences between groups.
Fig. 4
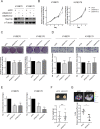
Fig. 4. Naa10p regulates the cell invasiveness of ESCA cells.
A Naa10p protein expression in KYSE70 and KYSE170 cells transfected with either Control-shRNA or NAA10-shRNA. B Cell proliferation assays of KYSE70 and KYSE170 cells transfected with either Control-shRNA or NAA10-shRNA. The data are shown as the relative fold change of the optical density (OD) compared to the baseline OD measured on Day 0. C Colony formation assays of KYSE70 and KYSE170 cells transfected with either Control-shRNA or NAA10-shRNA. D Cell migration assays of KYSE70 and KYSE170 cells transfected with either Control-shRNA or NAA10-shRNA. E Cell invasion assays of KYSE70 and KYSE170 cells transfected with either Control-shRNA or NAA10-shRNA. Differences are shown compared with control cells presented as the mean ± SD of three independent experiments. *P < 0.05, **P < 0.01 when compared to control group by two-tailed Student’s t test. F KYSE70 cells transfected with either Control-shRNA or NAA10-shRNA were subcutaneously injected into NOD/SCIDγ mice. Tumor weight was analyzed. Scale bar: 0.5 cm. Bars are the mean ± SD of indicated (n) independent experiments. G Representative bioluminescence images of lung metastasis in mice after subcutaneous injection of KTSE70-Luc cells transfected with either Control-shRNA or NAA10-shRNA. Scale bar: 0.5 cm. Quantification of lung bioluminescence in photons/second.
Fig. 5
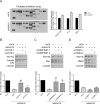
Fig. 5. Naa10p regulates ESCA cell invasion via its acetyltransferase activity.
A Left, KYSE70 cells with stable Naa10p knockdown were transfected with either Naa10p-V5 or Naa10p-R82A-V5 and immunoblotting analysis was performed. Right, cell invasion assays were performed on KYSE70 cells with different levels of Naa10p expression. Bars are mean ± SD of three independent experiments. **P < 0.01 when compared to shCtl group and ## P < 0.01 when compared with shNAA10-vector cells by two-tailed Student’s t test. Scale bar: 100 μm. B Left, the knockdown efficiency of KYSE70 and KYSE170 cells receiving shNAA15 or control shRNA. Right, cell invasion assays of KYSE70 and KYSE170 cells transfected with either Ctl-shRNA or NAA15-shRNA. The data are shown as relative fold change of invasive cells compared with the shCtl group. **P < 0.01 when compared to the control group by two-tailed Student’s t test. Scale bar: 100 μm. C Left, KYSE70 cells with stable Naa15 knockdown were transfected with either Vector or Naa10p and immunoblotting analysis was performed. Right, cell invasion assays were performed on stable NAA15-silencing KYSE70 cells transfected with either Vector or Naa10p. The data are shown as relative fold change of invasive cells compared with the shCtl-Vector group. **P < 0.01 when compared to the shCtl-Vector group and ## P < 0.01 when compared with shNAA15-Vector cells by two-tailed Student’s t test. Scale bar: 100 μm.
Fig. 6
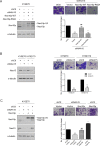
Fig. 6. Naa10p mediates c-Myc-induced cell invasiveness.
A Upper, suppression of c-Myc by shRNAs in KYSE70 and KYSE170 cells were confirmed by immunoblotting analysis. Middle, representative views of cells in the transwell invasion assay. Lower, quantification of cells that invaded through a Matrigel-coated membrane following transfection of Ctl-shRNA or MYC-shRNAs. Bars are the mean ± SD of three independent experiments. **P < 0.01 when compared to shCtl group by two-tailed Student’s t test. Scale bar: 100 μm. B Upper, immunoblotting analysis of stably c-Myc-silencing KYSE70 cells transfected with either vector or Naa10p-V5. Lower, representative images and quantitative data comparing cell invasion of stably c-Myc-silencing KYSE70 cells transfected with either vector or Naa10p-V5. Bars are the mean ± SD of three independent experiments. **P < 0.01 when compared to shCtl group and # P < 0.01 when compared with shMYC-vector cells by two-tailed Student’s t test. Scale bar: 100 μm.
Fig. 7
Fig. 7. Naa10p regulates cell invasiveness by inducing protease inhibitor expression.
A Protease inhibitor arrays were used to analyze the expression of protease inhibitors in the cell supernatant of KSYE70 transfected with shCtl or shNAA10. B Immunoblotting analysis of stably Naa10p-silencing KYSE70 cells transfected with either Ctl-shRNA or CST6 shRNAs. Quantitative data comparing cell invasion of stably Naa10p-silencing KYSE70 cells transfected with either Ctl-shRNA or CST6 shRNAs. Bars are the mean ± SD of three independent experiments. **P < 0.01 when compared to shCtl group and # P < 0.05 when compared with shNAA10-shCtl cells by two-tailed Student’s t test. C Immunoblotting analysis of stably Naa10p-silencing KYSE70 cells transfected with either Ctl-shRNA or SERPINE1 shRNAs. Quantitative data comparing cell invasion of stably Naa10p-silencing KYSE70 cells transfected with either Ctl-shRNA or SERPINE1 shRNAs. Bars are the mean ± SD of three independent experiments. **P < 0.01 when compared to shCtl group and ## P < 0.01 when compared with shNAA10-shCtl cells by two-tailed Student’s t test. D Immunoblotting analysis of stably Naa10p-silencing KYSE70 cells transfected with either Ctl-shRNA or TIMP2 shRNAs. Quantitative data comparing cell invasion of stably Naa10p-silencing KYSE70 cells transfected with either Ctl-shRNA or TIMP2 shRNAs. Bars are the mean ± SD of three independent experiments. **P < 0.01 when compared to shCtl group and ## P < 0.01 when compared with shNAA10-shCtl cells by two-tailed Student’s t test.
Fig. 8
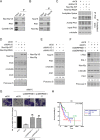
Fig. 8. Naa10p associates with PAI1 to regulate cell invasiveness of ESCA cells.
A Stably Naa10p-V5-expressing KYSE70 cells were immunoprecipitated with an V5 antibody and blotted with anti-PAI1 and anti-Cystatin E/M antibody. B KYSE70 cells were immunoprecipitated with Naa15 antibody and blotted with anti-Naa10p and anti-PAI1 antibody. C KYSE70 cells with stable Naa10p knockdown were transfected with either Naa10p-V5 or Naa10p-R82A-V5. Cell extracts were immunoprecipitated with an anti-PAI1 antibody or anti-acetylated lysine antibody and blotted with anti-acetylated lysine and anti-PAI1 antibody. D KYSE70 cells with stable Naa10p knockdown were transfected with either Naa10p-V5 or Naa10p-R82A-V5. Cell extracts and conditioned medium of these cells were collected and immunoblotting analysis was performed. E Cell extracts and conditioned medium of KYSE70 cells receiving shNAA15 or control shRNA were collected and immunoblotting analysis was performed. F Immunoblotting analysis of stably c-Myc-silencing KYSE70 cells transfected with either Ctl-shRNA or SERPINE1 shRNAs. G Quantitative data comparing cell invasion of stably c-Myc-silencing KYSE70 cells transfected with either Ctl-shRNA or SERPINE1 shRNAs. Bars are the mean ± SD of three independent experiments. **P < 0.01 when compared to shCtl group and ## P < 0.01 when compared with shMYC-shCtl cells by two-tailed Student’s t test. Scale bar: 100 μm. H Kaplan–Meier plot of overall (OS) survival of ESCA patients stratified by NAA10 and SERPINE1 expression level. A log rank test was used to show differences between groups.

Similar articles

References

    1. Rice TW, Apperson-Hansen C, DiPaola LM, Semple ME, Lerut TE, Orringer MB, et al. Worldwide Esophageal Cancer Collaboration: clinical staging data. Dis Esophagus. 2016;29:707–14. doi: 10.1111/dote.12493. - DOI - PMC - PubMed
    1. Sun S, Zhang H, Wang Y, Gao J, Zhou S, Li Y, et al. Proteomic analysis of human esophageal cancer using tandem mass tag quantifications. Biomed Res Int. 2020;2020:5849323. doi: 10.1155/2020/5849323. - DOI - PMC - PubMed
    1. Zlotnik O, Goshen-Lago T, Haddad R, Brenner B, Kundel Y, Ben-Aharon I, et al. Proteomic analysis to identify markers for response to neoadjuvant treatment in esophageal and gastroesophageal cancer. Cancer Rep. 2022;5:e1489. - PMC - PubMed
    1. Chen L, Liu S, Tao Y. Regulating tumor suppressor genes: post-translational modifications. Signal Transduct Target Ther. 2020;5:90. doi: 10.1038/s41392-020-0196-9. - DOI - PMC - PubMed
    1. Chen MW, Hua KT, Kao HJ, Chi CC, Wei LH, Johansson G, et al. H3K9 histone methyltransferase G9a promotes lung cancer invasion and metastasis by silencing the cell adhesion molecule Ep-CAM. Cancer Res. 2010;70:7830–40. doi: 10.1158/0008-5472.CAN-10-0833. - DOI - PubMed

Publication types

MeSH terms