. 2022 Nov 24;13(1):7235.
doi: 10.1038/s41467-022-34425-z.

Integration of single-cell transcriptomes and biological function reveals distinct behavioral patterns in bone marrow endothelium

Affiliations

Integration of single-cell transcriptomes and biological function reveals distinct behavioral patterns in bone marrow endothelium

Young-Woong Kim et al. Nat Commun. .

Abstract

Heterogeneity of endothelial cell (EC) populations reflects their diverse functions in maintaining tissue's homeostasis. However, their phenotypic, molecular, and functional properties are not entirely mapped. We use the Tie2-CreERT2;Rosa26-tdTomato reporter mouse to trace, profile, and cultivate primary ECs from different organs. As paradigm platform, we use this strategy to study bone marrow endothelial cells (BMECs). Single-cell mRNA sequencing of primary BMECs reveals that their diversity and native molecular signatures is transitorily preserved in an ex vivo culture that conserves key cell-to-cell microenvironment interactions. Macrophages sustain BMEC cellular diversity and expansion and preserve sinusoidal-like BMECs ex vivo. Endomucin expression discriminates BMECs in populations exhibiting mutually exclusive properties and distinct sinusoidal/arterial and tip/stalk signatures. In contrast to arterial-like, sinusoidal-like BMECs are short-lived, form 2D-networks, contribute to in vivo angiogenesis, and support hematopoietic stem/progenitor cells in vitro. This platform can be extended to other organs' ECs to decode mechanistic information and explore therapeutics.


Conflict of interest statement

The authors declare no competing interests.

Figures
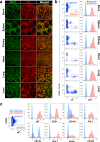
Fig. 1
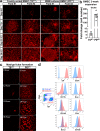
Fig. 1. Endothelial cell-specific tdT reporter expression in Tie2-CreERT2;Rosa26-tdTomato mice.
a Confocal images of CD31 (in green) staining and tdT reporter expression (in red) on the indicated tissues. Scale bar, 100 μm. Representative of n = 2 independent experiments. b Flow cytometry analysis of the dissociated cells from the indicated tissues for tdT (b, left) and CD31 expression (b, right). Representative of n = 5 independent experiments. c Expression of the indicated EC markers on fresh BM tdT+ cells from 4-6-month-old Tie2-CreERT2;Rosa26-tdTomato mice. Histograms show the expression of each marker in CD45+ tdT hematopoietic cells (blue) and CD45tdT+ ECs (red). Representative of n = 5 independent experiments. Gating strategies are shown in Supplementary Fig. 9.
Fig. 2
Fig. 2. Ex vivo WBM culture system preserves BMECs capable to form 2D-networks.
a Snapshot images of two representative fields of tdT+ BMEC cultures directly sorted from fresh BM (T0tdT+; left) or WBM culture (P0tdT+; right) at the indicated day of culture. Scale bar, 100 μm. Representative of n = 4 independent experiments. b Fold increase of absolute numbers of CD45tdT+ cells from each culture (day 14/day 0). T0tdT+ (n = 4), P0tdT+ (n = 8). Data are presented as the mean ± SEM; statistics were determined using unpaired t-test, two-sided, p  =  0.0001. Source data are provided as a Source Data file. c Time lapse images of Matrigel tube formation assay with CD45Ter119tdT+ cells directly sorted from BM (T0tdT+; left), or with CD45tdT+ cells sorted after two weeks of P0 WBM culture (P0tdT+; right). Scale bar, 200 μm. Representative of n = 4 independent experiments. d BMECs from P0 WBM culture at day 14. Histograms show expression of the indicated EC markers on gated CD45+ tdT hematopoietic cells (blue) and CD45tdT+ ECs (red). Representative of n = 4 independent experiments. Gating strategies are shown in Supplementary Fig. 9.
Fig. 3
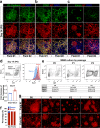
Fig. 3. Endomucin expression defines two distinct BMEC populations in WBM culture.
ac P0 WBM culture at day 14. Immunostaining of tdT+BMECs with antibodies for VE-Cadherin (a), CD31 (b), and Emcn (c). Confocal images of two fields in the two independent cultures. Scale bar, 100 μm. Representative of n = 3 independent experiments. d Emcn expression on gated tdT+BMECs in P0 WBM culture at day 14. Emcn+ and Emcn populations (dot plot, left) were gated and analyzed for Sca-1 expression (histogram, right). Representative of n = 5 independent experiments. Bar graph (bottom left) summarizes fold increase in mean fluorescence intensity of Sca-1 expression in Emcn + (blue) vs. Emcn- (red) cells; n = 5. Data are presented as the mean ± SEM. Gating strategies are shown in Supplementary Figure 9. Source data are provided as a Source Data file. e, f At day 14, P0 WBM cultures were serially passaged every seven days and analyzed by flow cytometry at each passage. e Dot plots show Emcn+ and Emcn cells on gated tdT+ BMEC from P0 to P2 in a representative of n = 3 independent experiments. Source data are provided as a Source Data file. f Bar graph summarizes the relative proportion of the Emcn+ vs. Emcn cells at P0–P2. P0 n = 10; P1 n = 8; P2 n = 8. Source data are provided as a Source Data file. g At day 14, the P0 WBM culture was serially passaged every 7–14 days (P0 to P3). Confocal images of two fields at the last day of the indicated passage. Scale bar, 100 μm. Representative of n = 5 experiments. Note that web-like networks (bottom left) were no longer present after P0.
Fig. 4
Fig. 4. Characterization of WBM culture populations over time.
a Dot plots within gates show distribution of three different populations, CD45+tdT (HC/Mɸ), CD45tdT (MC), and CD45tdT+(EC), at day 0 and 14 of P0 WBM culture. Representative of independent experiments: n = 14 at day 0 and n = 10 at day 14. Source data are provided as a Source Data file. b Percentages of populations at day 0 (black bar) and 14 (red bar) of P0 WBM culture; n = 10. Data are presented as the mean ± SEM. Source data are provided as a Source Data file. c P0 WBM cultures were harvested and serially passaged up to 4 times (P4). At each passage, the relative percentages of CD45tdT+ (BMEC, red), CD45tdT (MC, gray), and CD45+tdT (HC/ Mɸ, CD11b+, orange) populations were evaluated by flow cytometry; Fresh WBM n = 10; P0 n = 10; P1 n = 8; P2 n = 8; P3 n = 7; P4 n = 6. Data are presented as the mean ± SEM. Source data are provided as a Source Data file.(d) Scheme of experimental design. Parts of the figure (the femur) were drawn by using pictures from Servier Medical Art by Servier, licensed under a Creative Commons Attribution 3.0 Unported License. At P0, tdT+ BMECs were: (i) passaged when confluent (every week) as WBM cultures; (ii) sorted into Emcn and Emcn+, plated as individual cultures and passaged once confluent (every week). e Total cell number of Emcn+ cells counted at the indicated passage (left); fold changes of cell numbers at the indicated passage compared to the previous one (right). Fresh WBM n = 8; P0 n = 10; P1 n = 8; sorted P1Emcn+ n = 3. Data are presented as the mean ± SEM. Statistics for all comparisons shown were determined using paired t-test, two-sided. Left graph: Fresh WBM vs. P0, p = 0.0008; P0 vs. P1, p = 0.0193. Right graph: P0 vs. P1, p = 0.0027. * p < 0.05, **p < 0.01, ***p < 0.001. Source data are provided as a Source Data file. f Total cell number of Emcn cells counted at the indicated passage (left); fold changes of cell numbers at the indicated passage compared to the previous one (right). Fresh WBM n = 8; P0 n = 10; unsorted P1 and P2, sorted P1Emcn-, P2Emcn-, and P3Emcn- n = 8 (each group); unsorted P3 n = 7; unsorted P4 n = 6, sorted P4Emcn- n = 6. Data are presented as the mean ± SEM. Statistics for all comparisons shown were determined using paired t-test, two-sided. Left graph: Fresh WBM vs. P0, p < 0.0001; P0 vs. P1, p = 0.0015; P1 vs. P2, p = 0.0151; P0 vs. P1Emcn-, p = 0.0005; P1Emcn- vs. P2Emcn-, p < 0.0001. Right graph: P0 vs. P1, p < 0.0001; P1 vs. P2, p = 0.0027; P2 vs. P3, p = 0.0141; P1Emcn- vs. P2Emcn-, p = 0.0045; P2Emcn- vs. P3Emcn-, p = 0.0296. *p < 0.05, **p < 0.01, ***p < 0.001, and ****p < 0.0001. Source data are provided as a Source Data file.
Fig. 5
Fig. 5. Impact of HC/MΦ and MC on BMEC in WBM culture.
ad P0 WBM cultures were divided in three conditions: control and supplement at day 0 with additional HC/Mɸ or MC. a, b Snapshot images at day 14 culture showing tdT+ BMECs in P0 WBM cultures that were supplemented with a HC/MΦ or b MC, compared to control; two representative fields; Scale bar, 2000 μm. n = 12. c Fold change in BMEC numbers: tdT+ (left), Emcn (middle) and Emcn+ (right) when P0 WBM culture is supplemented with HC/Mɸ or MC, vs. culture control. Data are presented as the mean ± SEM. Emcn+ cells expanded on average 48-fold in control cultures (set up in this graph at value 1), 96-fold when supplemented with HC/MΦ, and 24-fold when supplemented with MC. BMEC + MΦ, n = 8; BMEC + MC, n = 6. n = 3 independent experiments. Statistics for all comparisons shown were determined using unpaired t-test, two-sided. tdT+ MΦ, p = 0.0026; tdT+ MC, p < 0.0001; Emcn MΦ, p < 0.0001; Emcn MC, p < 0.0001; Emcn+ MΦ, p < 0.0001; Emcn+ MC, ***p < 0.001, and ****p < 0.0001. Source data are provided as a Source Data file. d Total cell number of Emcn+ and Emcn cells of P0 WBM culture with or without additional HC/MΦ or MC at different WBM cell densities. Representative of n = 3 independent experiments. Source data are provided as a Source Data file. e, f P1 WBM cultures were supplemented with additional HC/MΦ and cultured for seven days: e total cell number and f fold changes of Emcn+ and Emcn cells supplemented with additional HC/MΦ vs. control, at different cell densities; n = 3. Data are presented as the mean ± SEM. Statistics for all comparisons shown were determined using unpaired t-test, two-sided. e Cell density 1, Emcn, p = 0.0020; cell density 1/4, Emcn, p = 0.0006; cell density 1/8, Emcn, p = 0.0001; Emcn+ p = ns at all cell densities. f Cell density 1, Emcn, p = 0.0006; cell density 1/4, Emcn, p = 0.0004; cell density 1/8, Emcn, p < 0.0001; Emcn+ p = ns at all cell densities. **p < 0.01, ***p < 0.001, and ****p < 0.0001. Source data are provided as a Source Data file. g P0 WBM cultures were supplemented with recombinant M-CSF (50 ng/mL) and cultured for fifteen days. Total cell number of Emcn+ and Emcn cells of P0 WBM culture with or without M-CSF; n = 3 independent cultures. Data are presented as the mean ± SEM. Statistics were determined using unpaired t-test, two-sided *p = 0.0336.
Fig. 6
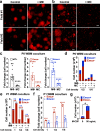
Fig. 6. Distinct functional properties of Emcn + and Emcn BMEC.
a, b Time lapse images of cells in Matrigel at the indicated time points: a Emcn+ and Emcn cells sorted from P0 WBM cultures; b Emcn+ cells from P1Emcn+ (grown in culture as sorted cells), and Emcn cells from P1Emcn-, P2Emcn-, and P3Emcn- (grown in culture as sorted cells). Scale bar, 200 μm. Representative of n = 8-12 independent experiments. c Quantification of cords formation and structure integrity by Emcn cells at P1 and P2. Line graph shows differences in growth patterns of cells at P1 and P2, indicated as a decrease in the contour area with passage (see details in Methods section). P1Emcn- n = 12; P2Emcn- n = 8. Data are presented as the mean ± SEM. Source data are provided as a Source Data file. d Immunostaining of CD31 marker on Matrigel plugs. Matrigel was admixed with sorted P0 Emcn (left) or P0 Emcn+ (right) cells and implanted into the flanks of syngeneic mice for two months, prior collection and fixation. Note that only exogenous P0 Emcn+ cells (nucleus in red), but not P0 Emcn cells, can be observed in new blood vessels formed by endogenous ECs (nucleus not in red). Zoom-in image of white-dashed squares 1 and 2 are depicted on the right panel. Scale bar, 100 μm. Representative of n = 3 experiments. e, f Monolayers of Emcn+ or Emcn cells sorted from P0 WBM culture were cocultured with sorted LSK (6000 cells/well) for seven days in the presence or absence of SCF (50 ng/ml). Bar graphs show total cell numbers at day 7 for e LSK cells and f LK and CD11b + cells; n = 2. Data are presented as the mean ± SEM. Source data are provided as a Source Data file.
Fig. 7
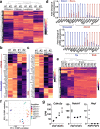
Fig. 7. Molecular Signatures of Emcn+ and Emcn BMEC.
ac Bulk-RNA-seq of sorted populations at day 14 of culture: Emcn+ and Emcn BMEC from P0 WBM; Emcn EC from lung; MSC from BM. a Heatmap of the top 5% variable genes. b Heatmap of arterial-sinusoidal gene signature and c tip-stalk signature. Measurements are expressed in scaled log2 counts per million (CPM). d Real-time (RT-) PCR for the indicated genes in Emcn+ and Emcn BMEC from P0 WBM culture at day 1; n = 2. Source data are provided as a Source Data file. e Bulk-RNA-seq of Emcn BMECs at the different passages. Heatmap of the top 5% variable genes. f Principal Component Analysis (PCA) of BMEC P0 Emcn+ and Emcn and P1-P4 Emcn; lung Emcn, and MSC transcriptomes. g Analysis of the most differentially expressed genes in Emcn BMEC cells during passages. Source data are provided as a Source Data file.
Fig. 8
Fig. 8. Native BMEC identity is preserved in ex vivo culture.
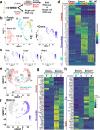
a Scheme of experimental design for freshly isolated BM tdT+ and P0 WBM cultured cells. Parts of the figure (the femur) were drawn by using pictures from Servier Medical Art by Servier, licensed under a Creative Commons Attribution 3.0 Unported License. b, c UMAP plot of single-cell gene expression profile from fresh cells. Clusters ranging from 0 to 4 identified by PCA and nearest neighbors are displayed in b using different colors. c Level of expression, reported as z-scaled log2 counts per million (CPM), of Emcn, Tek, Lepr, and Ptprc are shown in blue for each cluster in the UMAP visualization. d Gene expression profile for the sinusoidal/arterial gene signature. The levels of expression are reported as z-scaled log2 counts per million (CPM). e Integrated UMAP plot of the single-cell gene expression profile of fresh sorted P0tdT+ (Emcn+ and Emcn) (cyan) and cultured BMEC cells sorted at P0 (red). Numbers indicate clusters. f Level of Emcn expression, reported as z-scaled log2 counts per million (CPM), visualized in Integrated UMAP plot as in e. g, h Heatmaps of gene expression profiles in fresh and cultured BMECs using the arterial/sinusoidal signature (g) and the tip/stalk signature (h). Dendrograms above heatmaps show hierarchical clusters and the distance between the subpopulation’s transcriptomes. Results show differences between Emcn and Emcn+ and the linkage between freshly isolated and cultured cells of the respective groups. The levels of expression are reported as z-scaled log2 counts per million (CPM).
Fig. 9
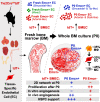
Fig. 9. Summary of WBM ex vivo culture workflow and BMEC distinct characteristics.
ECs can be isolated from all organs via their Tie2Cre-driven tdTomato expression. In vivo, three major BMEC populations can be identified in the BM by scRNA-seq transcriptomic profile: Emcn+ sinusoidal-like, Emcn- arterial-like and Emcn+ with mixed sinusoidal/arterial-like signature, which are no longer observed in ex vivo culture. BMECs require interactions with WBM to maintain their heterogeneity and their native molecular signatures ex vivo. Macrophages (MΦ) promote maintenance of Emcn+ sinusoidal-like BMEC and expansion of all BMECs, whereas mesenchymal cells (MC) have an inhibitory effect. Endomucin expression distinguishes BMEC in Emcn+ and Emcn populations exhibiting distinct behaviors, as summarized in the table shown at the bottom of the figure.

Similar articles

Cited by

References

    1. Kalucka J, et al. Single-cell transcriptome atlas of murine endothelial cells. Cell. 2020;180:764–779.e720. doi: 10.1016/j.cell.2020.01.015. - DOI - PubMed
    1. Nolan DJ, et al. Molecular signatures of tissue-specific microvascular endothelial cell heterogeneity in organ maintenance and regeneration. Dev. Cell. 2013;26:204–219. doi: 10.1016/j.devcel.2013.06.017. - DOI - PMC - PubMed
    1. Morrison SJ, Scadden DT. The bone marrow niche for haematopoietic stem cells. Nature. 2014;505:327–334. doi: 10.1038/nature12984. - DOI - PMC - PubMed
    1. Kubota Y, Takubo K, Suda T. Bone marrow long label-retaining cells reside in the sinusoidal hypoxic niche. Biochem. Biophys. Res. Commun. 2008;366:335–339. doi: 10.1016/j.bbrc.2007.11.086. - DOI - PubMed
    1. Itkin T, et al. Distinct bone marrow blood vessels differentially regulate haematopoiesis. Nature. 2016;532:323–328. doi: 10.1038/nature17624. - DOI - PMC - PubMed

Publication types