. 2022 Nov 17;23(22):14209.
doi: 10.3390/ijms232214209.

Impact of Siponimod on Enteric and Central Nervous System Pathology in Late-Stage Experimental Autoimmune Encephalomyelitis

Affiliations

Impact of Siponimod on Enteric and Central Nervous System Pathology in Late-Stage Experimental Autoimmune Encephalomyelitis

Alicia Weier et al. Int J Mol Sci. .

Abstract

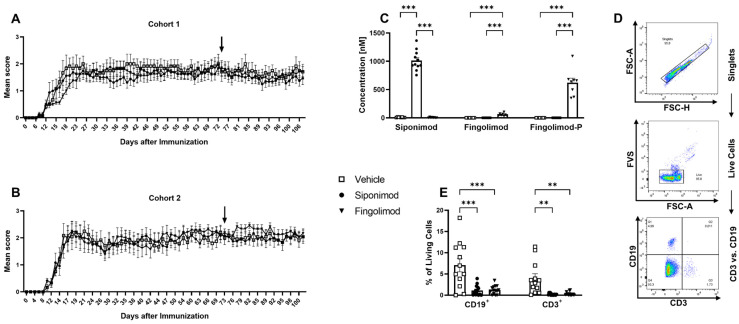
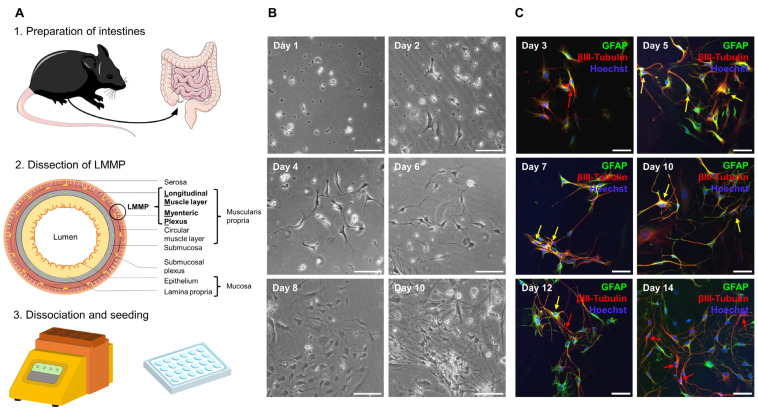
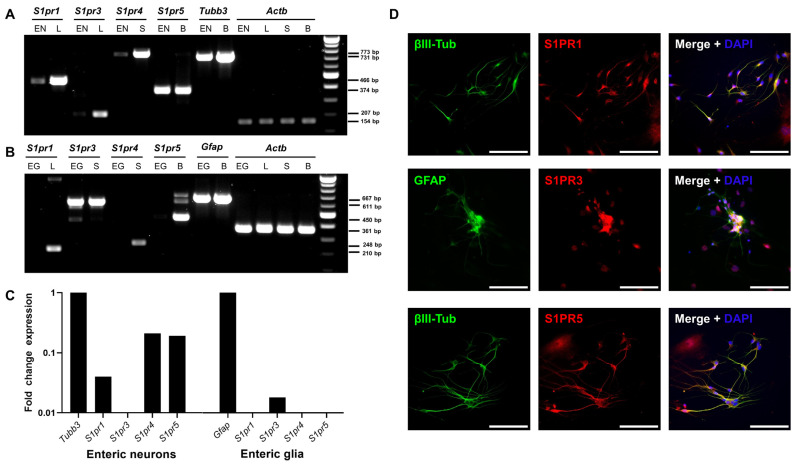
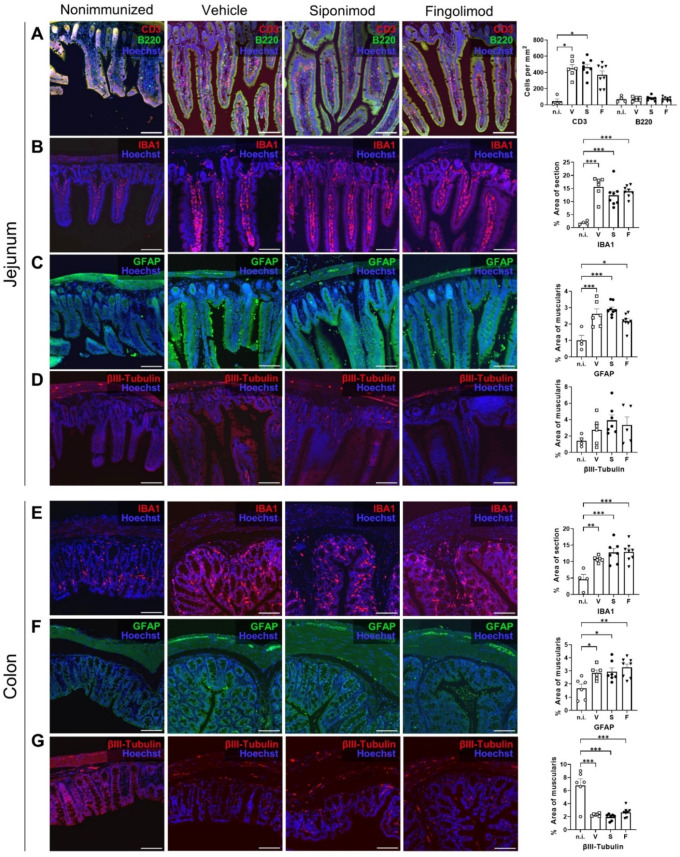
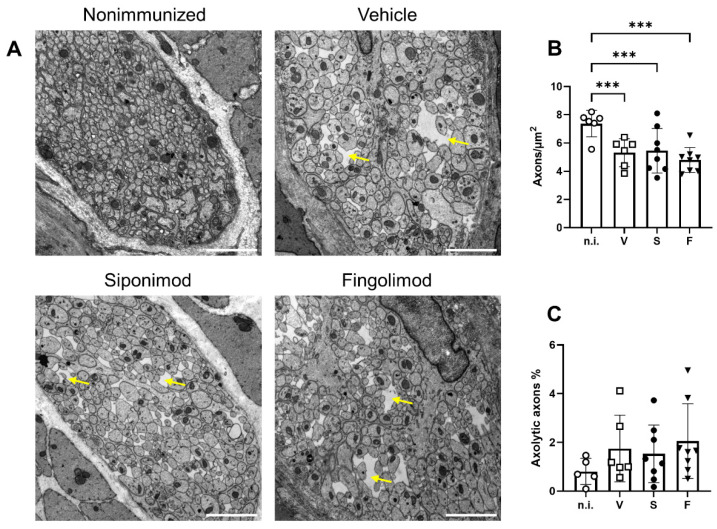
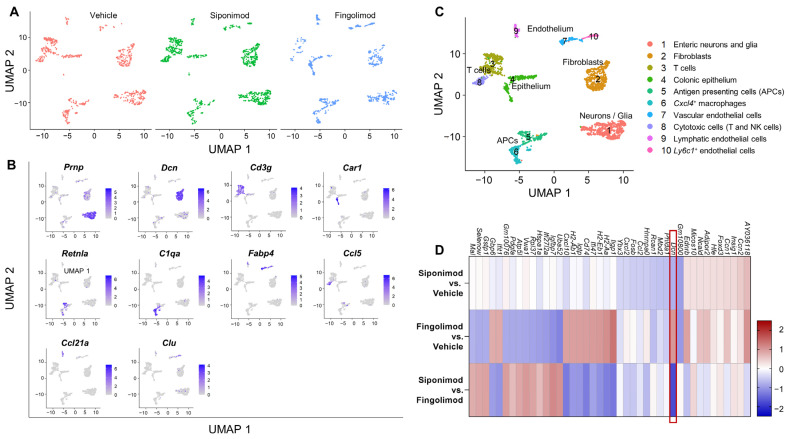
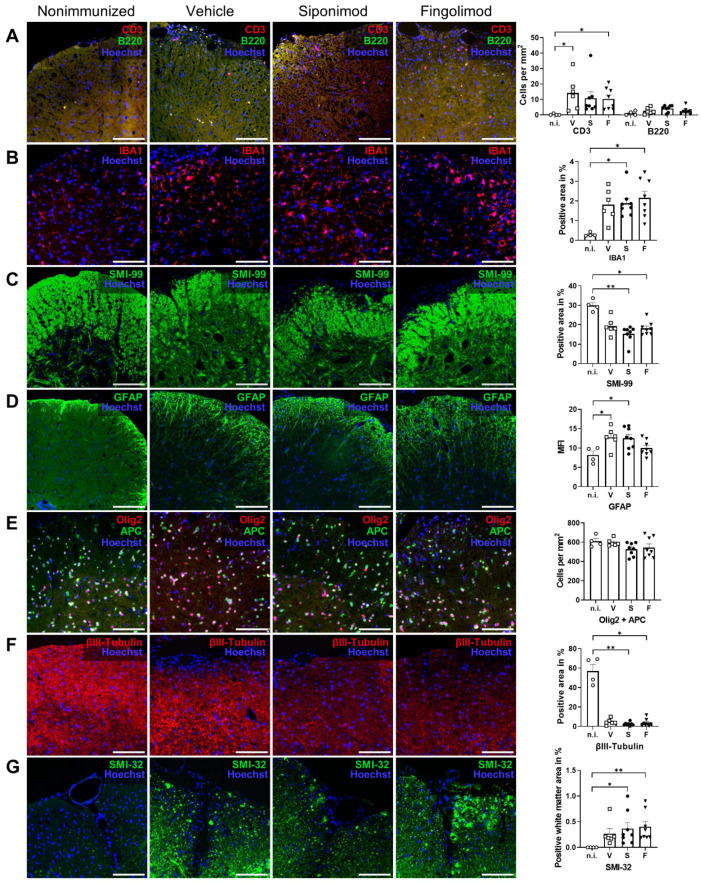
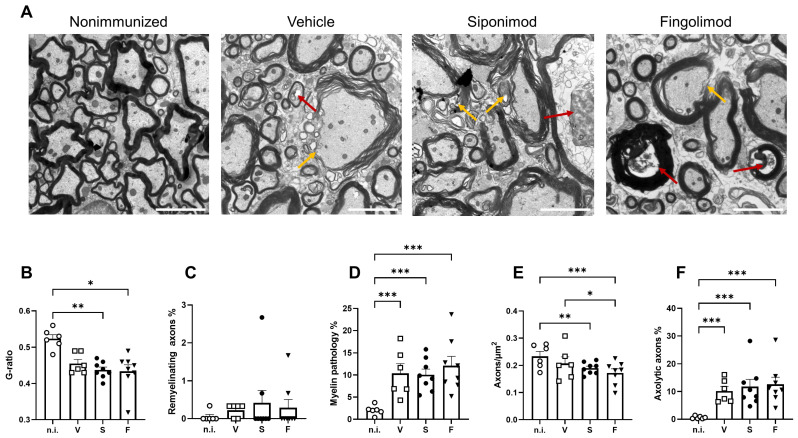
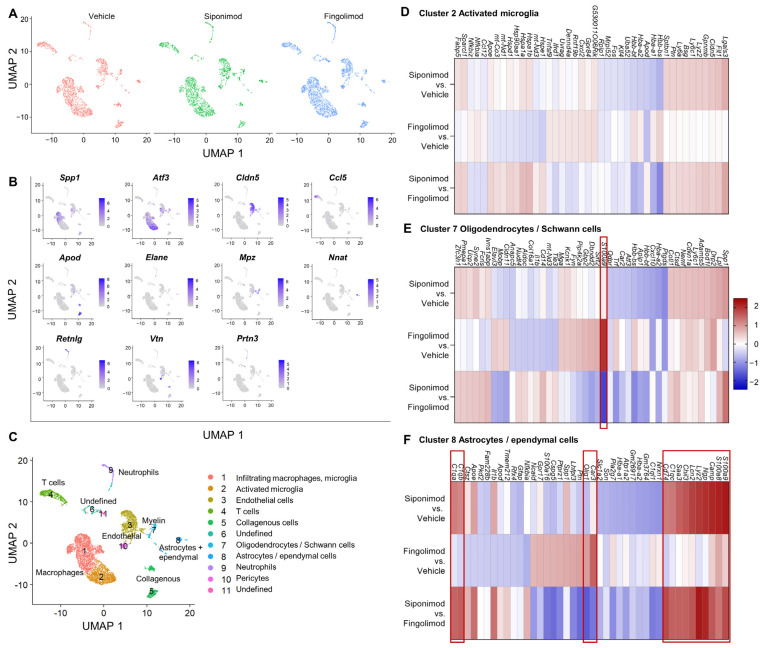
Multiple sclerosis (MS) is an autoimmune disease of the central nervous system (CNS). Although immune modulation and suppression are effective during relapsing-remitting MS, secondary progressive MS (SPMS) requires neuroregenerative therapeutic options that act on the CNS. The sphingosine-1-phosphate receptor modulator siponimod is the only approved drug for SPMS. In the pivotal trial, siponimod reduced disease progression and brain atrophy compared with placebo. The enteric nervous system (ENS) was recently identified as an additional autoimmune target in MS. We investigated the effects of siponimod on the ENS and CNS in the experimental autoimmune encephalomyelitis model of MS. Mice with late-stage disease were treated with siponimod, fingolimod, or sham. The clinical disease was monitored daily, and treatment success was verified using mass spectrometry and flow cytometry, which revealed peripheral lymphopenia in siponimod- and fingolimod-treated mice. We evaluated the mRNA expression, ultrastructure, and histopathology of the ENS and CNS. Single-cell RNA sequencing revealed an upregulation of proinflammatory genes in spinal cord astrocytes and ependymal cells in siponimod-treated mice. However, differences in CNS and ENS histopathology and ultrastructural pathology between the treatment groups were absent. Thus, our data suggest that siponimod and fingolimod act on the peripheral immune system and do not have pronounced direct neuroprotective effects.

Keywords: central nervous system; enteric nervous system; experimental autoimmune encephalomyelitis; fingolimod; multiple sclerosis; siponimod.


Conflict of interest statement

A.W., M.E., P.K., A.E., C.K., and J.W. declare no conflicts of interest. M.B. is a Novartis employee and declares no further conflicts of interests. S.K. reports grants from the Deutsche Forschungsgemeinschaft (DFG), Novartis, F. Hoffmann-La Roche, and Sanofi; and speaker fees and consultancy honoraria from Novartis, F. Hoffmann-La Roche, Sanofi, and Teva (outside the submitted work). The funders had no role in the design of the study; in the interpretation of data; in the writing of the manuscript, or in the decision to publish the results.

Figures

Figure 1
Figure 1
Development of experimental autoimmune encephalomyelitis in different treatment cohorts and validation of treatment success. Female C57BL/6J mice (9–12 weeks old) were immunized with MP4. (A,B) Disease course in two independent EAE cohorts. Arrows mark the beginning of siponimod or fingolimod treatment. (C) Thirty days after treatment initiation, serum samples were analyzed using mass spectrometry to determine siponimod, fingolimod, and fingolimod phosphate (fingolimod-P) concentrations. (D) Gating strategy for flow cytometry analysis of whole blood 30 d after treatment onset, which is shown in (E). Forward scatter height (FSC-H) vs. forward scatter area (FSC-A) was used to identify singlets. A fixable viability stain (FVS) was used to exclude dead cells. CD3 vs. CD19 comparison showed T (CD3+, CD19), B (CD3, CD19+), double negative, and double positive cells. Statistical analysis was performed using two-way ANOVA. ** p < 0.01; *** p < 0.001. EAE = experimental autoimmune encephalomyelitis, fingolimod-P = fingolimod phosphate, FCS-A = forward scatter area, FSC-H = forward scatter height, FVS = fixable viability stain, ANOVA = analysis of variance.
Figure 2
Figure 2
Establishment of a primary enteric nervous system culture. (A) Complete intestine from duodenum to rectum was removed, cleared of feces, and rinsed. Pieces that were 2–4 cm in length were threaded onto a glass rod and incised longitudinally. Then, the outer longitudinal muscle layer with attached myenteric plexus (LMMP) was dissected. LMMP was digested with collagenase and trypsin using the Miltenyi gentleMACSTM Octo Dissociator with heaters. Cells were plated onto coated coverslips in a 24-well plate. The figure was partly generated using Servier Medical Art, provided by Servier, licensed under the Creative Commons Attribution 3.0 Unported license. (B) Cells began to adhere after 24 h. After 2 d, processes began to form and grow before cells started proliferating at approximately day 8. On day 10, a stable network had formed. Scale bars represent 100 µm. (C) Cells in culture expressed the marker proteins glial fibrillary acidic protein (GFAP) and βIII-tubulin. Immediately after culture preparation, few neuronal cells could be detected (red arrows). From day 5 onward, cells expressing both markers were visible (yellow arrows). From day 10 onward, coexpression decreased and more neuronal cells were detected. Scale bars represent 50 µm. ENS = enteric nervous system, GFAP = glial fibrillary acidic protein, LMMP = longitudinal muscle layer with attached myenteric plexus.
Figure 3
Figure 3
S1pr expression in the enteric nervous system. (A) RT-PCR was used to determine mRNA expression of S1P receptors in a murine enteric neuronal cell line (EN). As positive controls, the lung (L) was used for S1pr1 and S1pr3, the spleen (S) for S1pr4, and the brain (B) for S1pr5 and Tubb3, which served as a marker control for neuronal origin genes. (B) Expression of S1P receptors was determined in a rat enteric glial cell line (EG). Gfap was used as a control marker gene. (C) RT-PCR results were verified by qRT-PCR in EN and rat EG cell lines. Fold change expression was compared with the marker gene expression of Tubb3 and Gfap. (D) Murine ENS primary cell cultures were stained for S1PR1, S1PR3 or S1PR5 in combination with the corresponding cell type markers GFAP or βIII-tubulin. Scale bars represent 100 µm. S1PR = sphingosine-1-phosphate receptor. EN = enteric neurons, L = lung, S = spleen, B = brain, EG = enteric glial cells, GFAP = glial fibrillary acidic protein, RT-PCR = reverse transcription polymerase chain reaction, qRT-PCR = quantitative real-time polymerase chain reaction.
Figure 4
Figure 4
Immunohistochemical (IHC) staining of the jejunum and colon in siponimod- or fingolimod-treated experimental autoimmune encephalomyelitis (EAE) mice. IHC staining of (AD) jejunum and (EG) colon from nonimmunized (n.i.) versus chronic EAE mice treated with siponimod (S), fingolimod (F), or vehicle (V) and corresponding quantitative analysis. (A) Lamina propria infiltrating B and T cells were counted. (B,E) IBA1+ area was measured and compared with whole section area. (C,F) GFAP+ area was measured and compared with the muscularis area. (D,G) βIII-tubulin+ area was measured and compared with the muscularis area. Scale bars represent 100 µm. Statistical analysis was performed using one-way ANOVA with Tukey’s (IBA1, GFAP, and βIII-tubulin) or the Kruskal–Wallis (CD3) post hoc test. * p < 0.05; ** p < 0.01; *** p < 0.001. IBA1 = ionized calcium-binding adapter molecule 1, GFAP = glial fibrillary acidic protein, n.i. = nonimmunized, V = vehicle, S = siponimod, F = fingolimod, ANOVA = analysis of variance.
Figure 5
Figure 5
Analysis of the myenteric plexus in the colon of MP4-immunized mice using transmission electron microscopy. (A) Representative images of each treatment group in 10,000× magnification. Scale bars represent 2 µm. Yellow arrows indicate edematous gaps. (B) Quantification of the number of axons/µm2. (C) Quantification of the percentage of axolytic axons. Statistical analysis was performed using two-way ANOVA. *** p < 0.001. n.i. = nonimmunized, V = vehicle, S = siponimod, F = fingolimod, ANOVA = analysis of variance.
Figure 6
Figure 6
Single-cell RNA sequencing of the longitudinal muscle layer with attached myenteric plexus in chronic EAE mice. LMMP was digested mechanically and enzymatically, and mRNA from single cell suspensions was analyzed using scRNA-seq. (A) UMAP clustering with a resolution of 0.2 revealed 10 different clusters evenly detected in all treatment groups. (B) Top genes expressed by each cluster. (C) Clusters were classified according to marker genes. (D) Heatmap of differentially expressed mRNA between treatment groups of cluster 1. The heatmap shows the top 10 genes of each comparison with highest and lowest logFC values. The red box highlights the only gene with a logFC >|1.5|. LMMP = longitudinal muscle layer with attached myenteric plexus, scRNA-seq = single-cell RNA sequencing, logFC = log(fold change), UMAP = uniform manifold approximation and projection.
Figure 7
Figure 7
Immunohistochemical (IHC) staining of spinal cord sections of siponimod- or fingolimod-treated experimental autoimmune encephalomyelitis (EAE) mice. IHC staining of spinal cord sections from nonimmunized (n.i.) vs. chronic EAE mice treated with siponimod (S), fingolimod (F), or vehicle (V). Representative images of each treatment group and corresponding quantification. (A) Spinal cord infiltrating B and T cells were counted, (B) IBA1+ and (C) SMI-99+ area was measured and compared with the whole spinal cord section area, (D) mean fluorescence intensity (MFI) of GFAP staining was determined, (E) Olig2 + APC double-positive cells were counted, (F) βIII-tubulin+ area was measured and compared with the whole spinal cord section area, and (G) SMI-32+ area in the white matter was measured and compared with the white matter area. Scale bars represent 100 µm. Statistical analysis was performed using one-way ANOVA with either Tukey’s (GFAP, Olig2 + APC) or the Kruskal–Wallis (CD3 + B220, IBA1, SMI-99, βIII-tubulin, and SMI-32) post hoc test. * p < 0.05; ** p < 0.01. EAE = experimental autoimmune encephalomyelitis, GFAP = glial fibrillary acidic protein, MFI = mean fluorescence intensity, n.i. = nonimmunized, S = siponimod, F = fingolimod, V = vehicle, MBP = myelin basic protein, ANOVA = analysis of variance.
Figure 8
Figure 8
Transmission electron microscopy analysis of the spinal cord of siponimod- or fingolimod-treated experimental autoimmune encephalomyelitis (EAE) mice. (A) Representative images of all treatment groups. Red arrows indicate axolytic axons, and yellow arrows indicate myelin pathology. Scale bars represent 2 µm. Quantification of the (B) g-ratio, (C) percentage of axons with pathological myelin, (D) percentage of remyelinating axons, (E) axons/µm2, and (F) percentage of axons undergoing axolysis. Statistical analysis was performed using one-way ANOVA with either Tukey’s (myelin pathology, axons/µm2, and axolytic axons) or the Kruskal–Wallis (g-ratio and remyelinating axons) post hoc test. * p < 0.05; ** p < 0.01; *** p < 0.001. EAE = experimental autoimmune encephalomyelitis, n.i. = nonimmunized, S = siponimod, F = fingolimod, V = vehicle, ANOVA = analysis of variance.
Figure 9
Figure 9
Single-cell RNA sequencing of spinal cord from chronic experimental autoimmune encephalomyelitis (EAE) mice. The spinal cord was digested mechanically and enzymatically, and mRNA from single cell suspensions was analyzed using scRNA-seq. (A) UMAP clustering with a resolution of 0.1 revealed 11 different clusters evenly detected in all three treatment groups. (B) Top genes expressed by each cluster. (C) Clusters were classified, according to marker genes. (DF) Differentially expressed mRNA between treatment groups of clusters 2 (D), 7 (E) and 8 (F). Heatmaps show the 10 genes with the greatest difference in each comparison in both directions (up- and downregulation). Genes with a logFC >|1.5| are highlighted by red boxes. ScRNA-seq = single cell RNA sequencing, logFC = log(fold change); UMAP = uniform manifold approximation and projection.

Similar articles

References

    1. Pugliatti M., Rosati G., Carton H., Riise T., Drulovic J., Vecsei L., Milanov I. The Epidemiology of Multiple Sclerosis in Europe. Eur. J. Neurol. 2006;13:700–722. doi: 10.1111/j.1468-1331.2006.01342.x. - DOI - PubMed
    1. Walton C., King R., Rechtman L., Kaye W., Leray E., Marrie R.A., Robertson N., La Rocca N., Uitdehaag B., van der Mei I., et al. Rising Prevalence of Multiple Sclerosis Worldwide: Insights from the Atlas of MS, Third Edition. Mult. Scler. 2020;26:1816–1821. doi: 10.1177/1352458520970841. - DOI - PMC - PubMed
    1. Kalincik T. Multiple Sclerosis Relapses: Epidemiology, Outcomes and Management. A Systematic Review. Neuroepidemiology. 2015;44:199–214. doi: 10.1159/000382130. - DOI - PubMed
    1. Bjornevik K., Cortese M., Healy B.C., Kuhle J., Mina M.J., Leng Y., Elledge S.J., Niebuhr D.W., Scher A.I., Munger K.L., et al. Longitudinal Analysis Reveals High Prevalence of Epstein-Barr Virus Associated with Multiple Sclerosis. Science. 2022;375:296–301. doi: 10.1126/science.abj8222. - DOI - PubMed
    1. Doshi A., Chataway J. Multiple Sclerosis, a Treatable Disease. Clin. Med. 2016;16:s53–s59. doi: 10.7861/clinmedicine.16-6-s53. - DOI - PMC - PubMed

MeSH terms