Association of Irisin/FNDC5 with ERRα and PGC-1α Expression in NSCLC
- PMID: 36430689
- PMCID: PMC9694131
- DOI: 10.3390/ijms232214204
Association of Irisin/FNDC5 with ERRα and PGC-1α Expression in NSCLC
Abstract
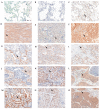
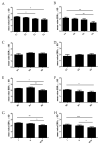
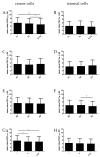
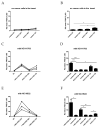
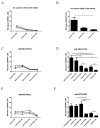
The rapid growth and division of cancer cells are associated with mitochondrial biogenesis or switching to glycolysis. ERRα, PGC-1α and irisin/FNDC5 are some of the proteins that can influence these processes. The aim of this study was to determine the correlation of these proteins in non-small cell lung cancer (NSCLC) and to investigate their association with clinicopathological parameters. Immunohistochemistry reactions were performed on tissue microarrays (860 NSCLC, 140 non-malignant lung tissue). The normal fibroblast cell line (IMR-90) and lung cancer cell lines (NCI-H1703 and NCI-H522) were used as co-cultures. The mRNA levels of FNDC5 and ESRRA (encoding ERRα) were assessed in IMR-90 cells after co-culture with lung cancer cells. We observed a decreased level of ERRα with an increase in tumor size (T), stages of the disease, and lymph node metastases (N). In the adenocarcinoma (AC) subtype, patients with a higher ERRα expression had significantly longer overall survival. A moderate positive correlation was observed between FNDC5 mRNA and ESRRA mRNA in NSCLCs. The expression of FNDC5 mRNA in IMR-90 cells increased after 24 h, and ESRRA gene expression increased after 48 h of co-culture. The ERRα receptor with PGC-1α participates in the control of FNDC5/irisin expression. Normal fibroblasts revealed an upregulation of the FNDC5 and ESRRA genes under the influence of lung cancer cells.
Keywords: ERRα; ESRRA; FNDC5; NSCLC; PGC-1α; irisin; non-small cell lung cancer.
Conflict of interest statement
The authors declare no conflict of interest. The funders had no role in the design of the study; in the collection, analyses, or interpretation of data; in the writing of the manuscript; or in the decision to publish the results.
Figures




Similar articles
-
Time-Dependent Changes in Increased Levels of Plasma Irisin and Muscle PGC-1α and FNDC5 after Exercise in Mice.Tohoku J Exp Med. 2018 Feb;244(2):93-103. doi: 10.1620/tjem.244.93. Tohoku J Exp Med. 2018. PMID: 29415899
-
A polymorphic autoregulatory hormone response element in the human estrogen-related receptor alpha (ERRalpha) promoter dictates peroxisome proliferator-activated receptor gamma coactivator-1alpha control of ERRalpha expression.J Biol Chem. 2004 Apr 30;279(18):18504-10. doi: 10.1074/jbc.M313543200. Epub 2004 Feb 20. J Biol Chem. 2004. PMID: 14978033
-
Are skeletal muscle FNDC5 gene expression and irisin release regulated by exercise and related to health?J Physiol. 2013 Nov 1;591(21):5393-400. doi: 10.1113/jphysiol.2013.263707. Epub 2013 Sep 2. J Physiol. 2013. PMID: 24000180 Free PMC article.
-
SMAD3 negatively regulates serum irisin and skeletal muscle FNDC5 and peroxisome proliferator-activated receptor γ coactivator 1-α (PGC-1α) during exercise.J Biol Chem. 2015 Mar 20;290(12):7671-84. doi: 10.1074/jbc.M114.617399. Epub 2015 Feb 3. J Biol Chem. 2015. PMID: 25648888 Free PMC article.
-
[Transcriptional regulation of metabolic switching PDK4 gene under various physiological conditions].Yakugaku Zasshi. 2007 Jan;127(1):153-62. doi: 10.1248/yakushi.127.153. Yakugaku Zasshi. 2007. PMID: 17202796 Review. Japanese.
Cited by
-
The Role of FNDC5/Irisin in Cardiovascular Disease.Cells. 2024 Feb 2;13(3):277. doi: 10.3390/cells13030277. Cells. 2024. PMID: 38334669 Free PMC article. Review.
-
The Effect of Hypoxia on Irisin Expression in HL-1 Cardiomyocytes.In Vivo. 2024 Sep-Oct;38(5):2126-2133. doi: 10.21873/invivo.13675. In Vivo. 2024. PMID: 39187335 Free PMC article.
-
The Role of Irisin/FNDC5 Expression and Its Serum Level in Breast Cancer.Int J Mol Sci. 2023 May 11;24(10):8628. doi: 10.3390/ijms24108628. Int J Mol Sci. 2023. PMID: 37239973 Free PMC article.
References
-
- Pawelczyk K., Piotrowska A., Ciesielska U., Jablonska K., Gletzel-Plucinska N., Grzegrzolka J., Podhorska-Okolow M., Dziegiel P., Nowinska K. Role of PD-L1 Expression in Non-Small Cell Lung Cancer and Their Prognostic Significance According to Clinicopathological Factors and Diagnostic Markers. Int. J. Mol. Sci. 2019;20:824. doi: 10.3390/ijms20040824. - DOI - PMC - PubMed
-
- Cruz-Bermúdez A., Laza-Briviesca R., Vicente-Blanco R.J., García-Grande A., Coronado M.J., Laine-Menéndez S., Alfaro C., Sanchez J.C., Franco F., Calvo V., et al. Cancer-Associated Fibroblasts Modify Lung Cancer Metabolism Involving ROS and TGF-β Signaling. Free Radic. Biol. Med. 2019;130:163–173. doi: 10.1016/j.freeradbiomed.2018.10.450. - DOI - PubMed
MeSH terms
Substances
Grants and funding
LinkOut - more resources
Full Text Sources

