. 2022 Nov 21;11(22):3701.
doi: 10.3390/cells11223701.

Melatonin Attenuates Ischemic-like Cell Injury by Promoting Autophagosome Maturation via the Sirt1/FoxO1/Rab7 Axis in Hippocampal HT22 Cells and in Organotypic Cultures

Affiliations

Melatonin Attenuates Ischemic-like Cell Injury by Promoting Autophagosome Maturation via the Sirt1/FoxO1/Rab7 Axis in Hippocampal HT22 Cells and in Organotypic Cultures

Francesca Luchetti et al. Cells. .

Abstract

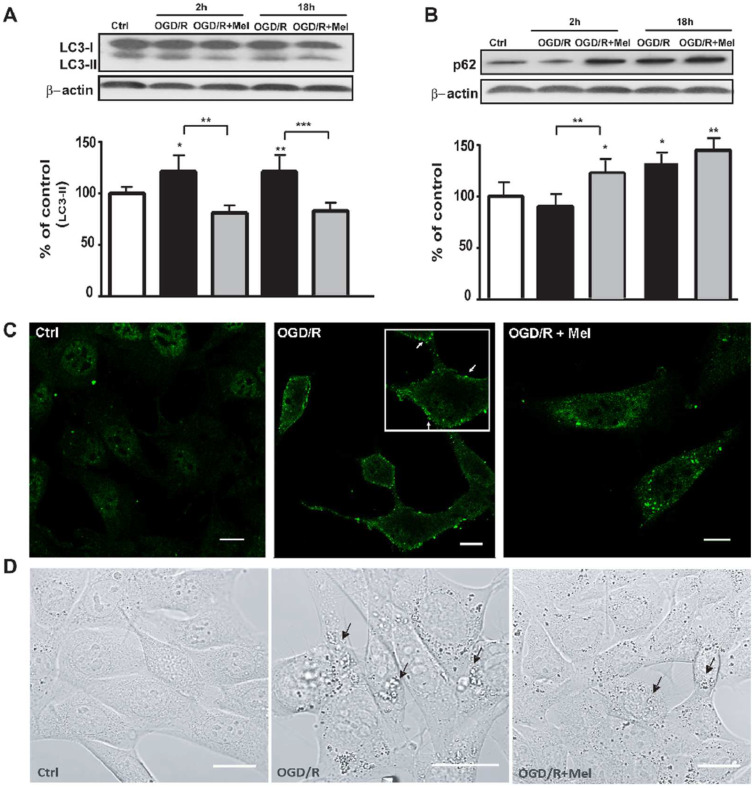
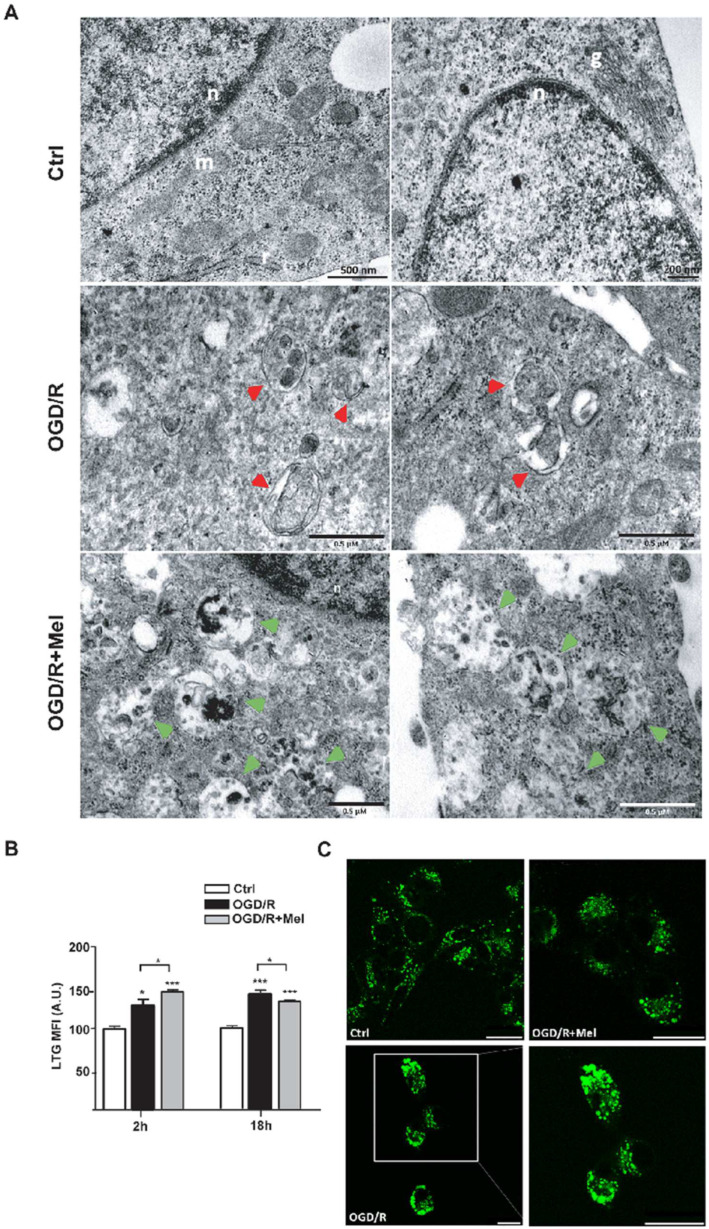
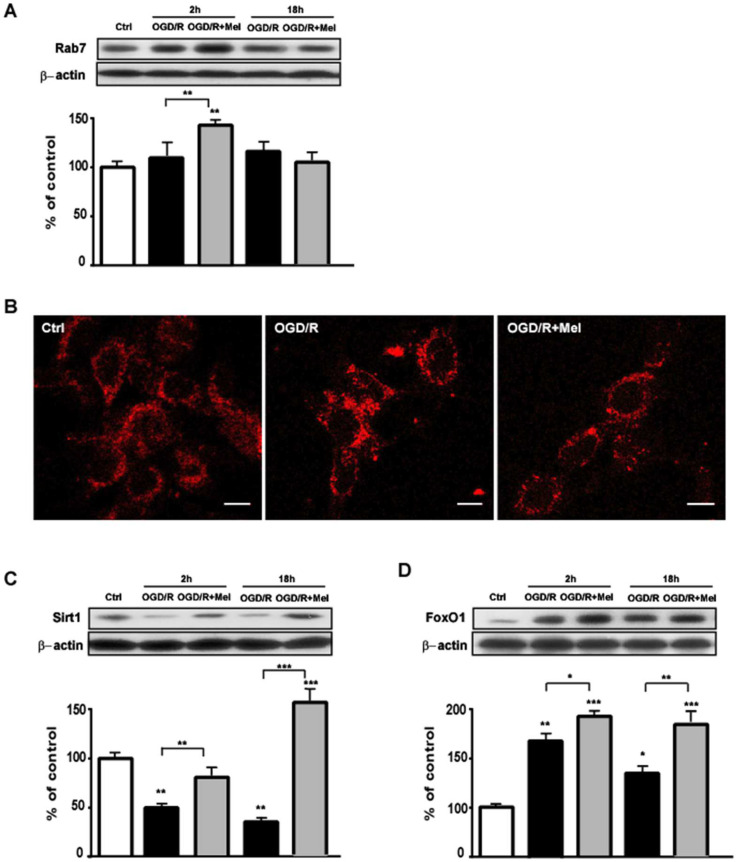
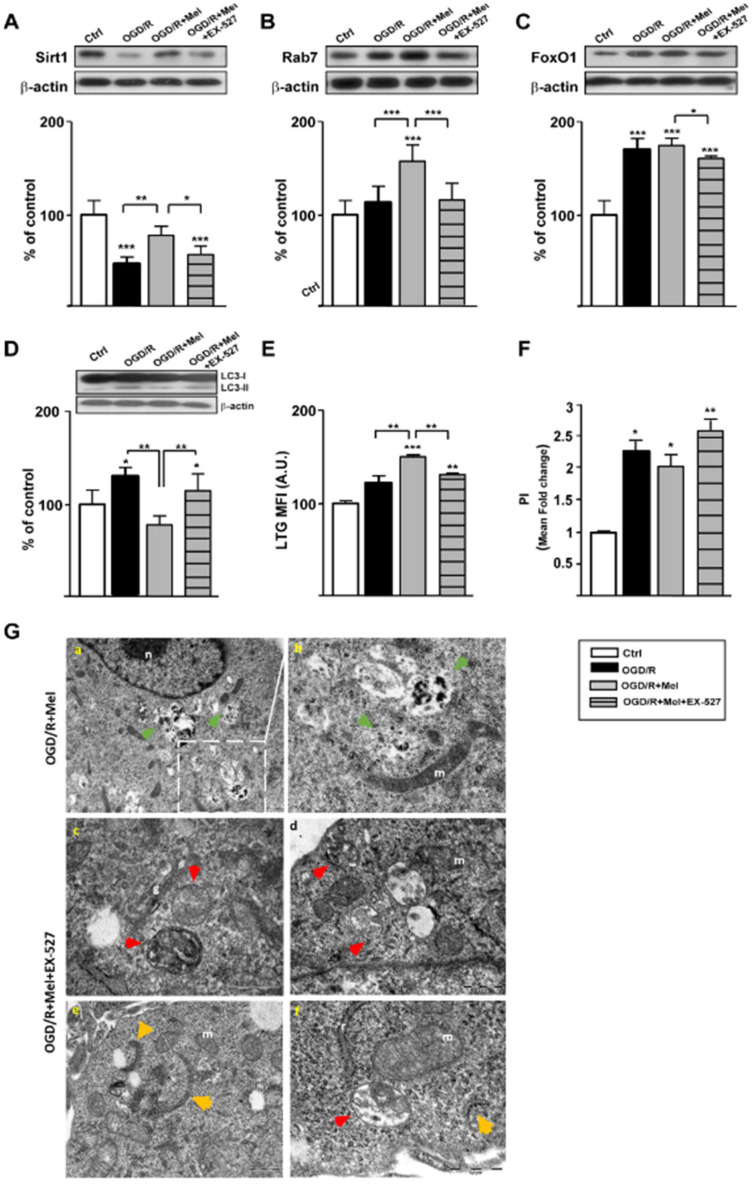
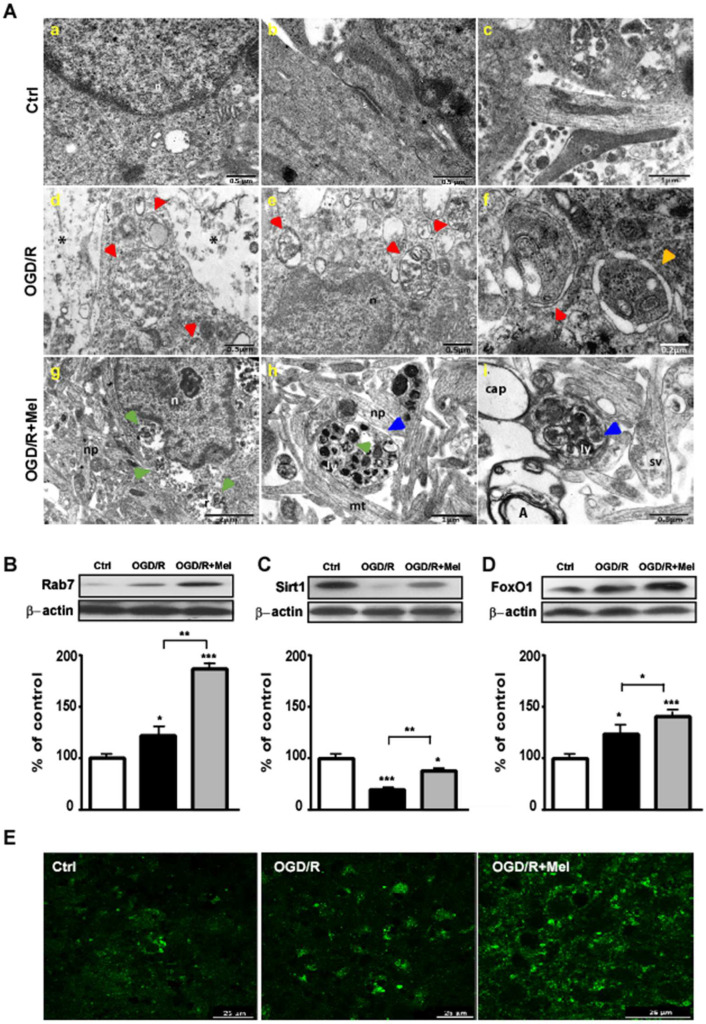
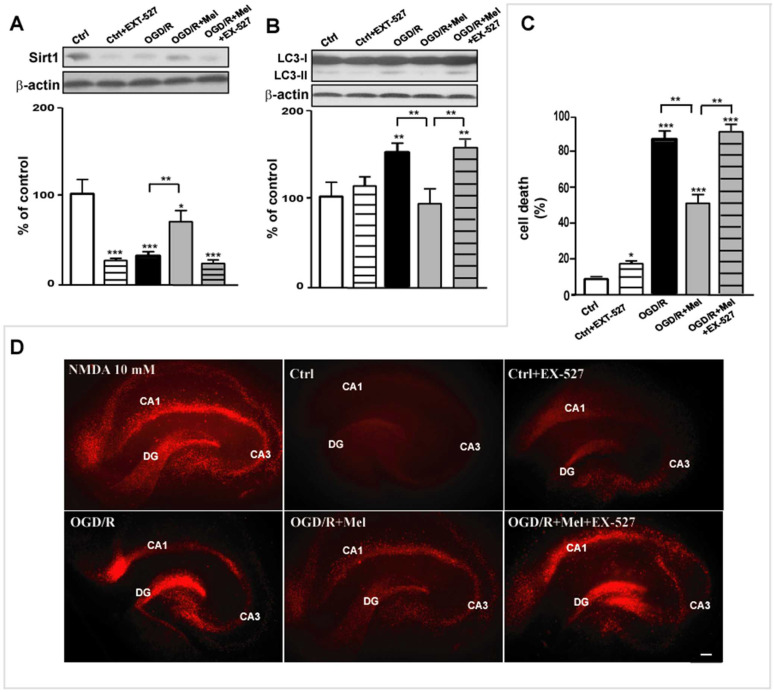
Dysfunctional autophagy is linked to neuronal damage in ischemia/reperfusion injury. The Ras-related protein 7 (Rab7), a member of the Rab family of small GTPases, appears crucial for the progression of the autophagic flux, and its activity is strictly interconnected with the histone deacetylase Silent information regulator 1 (Sirt1) and transcription factor Forkhead box class O1 (FoxO1). The present study assessed the neuroprotective role of melatonin in the modulation of the Sirt1/FoxO1/Rab7 axis in HT22 cells and organotypic hippocampal cultures exposed to oxygen-glucose deprivation followed by reoxygenation (OGD/R). The results showed that melatonin re-established physiological levels of autophagy and reduced propidium iodide-positive cells, speeding up autophagosome (AP) maturation and increasing lysosomal activity. Our study revealed that melatonin modulates autophagic pathways, increasing the expression of both Rab7 and FoxO1 and restoring the Sirt1 expression affected by OGD/R. In addition, the Sirt1 inhibitor EX-527 significantly reduced Rab7, Sirt1, and FoxO1 expression, as well as autolysosomes formation, and blocked the neuroprotective effect of melatonin. Overall, our findings provide, for the first time, new insights into the neuroprotective role of melatonin against ischemic injury through the activation of the Sirt1/FoxO1/Rab7 axis.

Keywords: Forkhead box class O1; Ras-related protein 7; autolysosome; autophagic flux; hippocampal slices; ischemia; silent information regulator 1.


Conflict of interest statement

The authors declare no conflict of interest.

Figures

Figure 1
Figure 1
Melatonin modulates autophagic proteins during OGD/R in HT22 cells. (A) Representative Western blots and quantitative evaluations of LC3 II and p62 (B) expression in untreated HT22 cells (Ctrl), 8 h OGD-exposed cells followed by 2 or 18 h reoxygenation (OGD/R), and 8 h OGD-exposed cells followed by 2 h or 18 h 50 μmol/L melatonin reoxygenation (OGD/R + Mel). Data are normalized using the loading control β-actin and are expressed as percentages of control (mean ± SD (N = 3 independent experiments); * p < 0.05, ** p < 0.01 vs. Ctrl, one-way ANOVA followed by Dunnett multiple comparison test; ** p < 0.01, *** p < 0.01, Newman-Keuls multiple comparison test (lines). (C) Representative confocal images of LC3 immunostaining in Ctrl, OGD/R, and OGD/R + Mel cells after 18 h reoxygenation. The green puncta indicate LC3-positive structures (arrows). Scale bars: 10 μm. (D) Representative confocal microscope images of Ctrl, OGD/R, and OGD/R + Mel cells after 18 h reoxygenation. Arrows indicate vacuoles. Scale bars: 25μm.
Figure 2
Figure 2
Melatonin accelerates autophagosomes maturation during OGD/R in HT22 cells. (A) Transmission electron microscopy (TEM) micrographs from untreated HT22 cells (Ctrl), 8 h OGD-exposed cells followed by 2 h reoxygenation (OGD/R), and 8 h OGD-exposed cells followed by 2 h 50 μmol/L melatonin reoxygenation (OGD/R + Mel). Images show autophagosomes (red arrowheads) and autolysosomes (green arrowheads) in OGD/R and OGD/R + Mel cells, respectively. n, nucleus; m, mitochondria; g, Golgi apparatus. (B) Quantitative evaluation and representative confocal microscopy images (C) of Lysotracker green (LTG) labeling in Ctrl, OGD/R, and OGD/R + Mel cells after 2 or 18 h reoxygenation. Results are expressed as mean fluorescence intensity (MFI) (mean ± SD, N = 3 independent experiments performed in triplicate); * p < 0.05, *** p < 0.001, vs. Ctrl, one-way ANOVA followed by Tukey’s multiple comparison test. Scale bars: 25 μm.
Figure 3
Figure 3
Melatonin modulation of the Sirt1/FoxO1/Rab7 axis during OGD/R in HT22 cells. (A) Representative Western blot and quantitative evaluation of Rab7 expression in untreated HT22 cells (Ctrl), 8 h OGD-exposed cells followed by 2 or 18 h reoxygenation (OGD/R), and 8 h OGD-exposed cells followed by 2 or 18 h 50 μmol/L melatonin reoxygenation (OGD/R + Mel). Data are normalized to the loading control β-actin and are expressed as percentages of control (mean ± SD; N = 3 independent experiments); ** p < 0.01 vs. Ctrl, one-way ANOVA followed by Dunnett multiple comparison test; ** p < 0.01, Newman-Keuls multiple comparison test (lines). (B) Representative confocal images of Rab7 immunostaining in Ctrl, OGD/R, and OGD/R + Mel cells after 18 h reoxygenation. The red dots indicate Rab7 on late endosomes. Scale bars: 10 μm. (C) Representative Western blots and quantitative evaluation of Sirt1 and FoxO1 (D) expression in Ctrl, OGD/R, and OGD/R + Mel cells after 2 h or 18 h reoxygenation. Data are normalized to the loading control β-actin and are expressed as % of control (mean ± SD, N = 3 independent experiments); * p < 0.05, ** p < 0.01, *** p < 0.001 vs. Ctrl, one-way ANOVA followed by Dunnett multiple comparison test; * p < 0.05, ** p < 0.01, *** p < 0.001, Newman-Keuls multiple comparison test (lines).
Figure 4
Figure 4
Effect of the Sirt1 inhibitor EX-527 on Sirt1/FoxO1/Rab7 axis and lysosome formation during OGD/R in HT22 cells. (A) Representative Western blots and quantitative evaluation of Sirt1, Rab7 (B), FoxO1 (C), and LC3 II (D) expression in untreated HT22 cells (Ctrl), 8 h OGD-exposed cells followed by 2 h reoxygenation (OGD/R), 8 h OGD-exposed cells followed by 2 h 50 μmol/L melatonin reoxygenation (OGD/R + Mel) and EX-527 10μmol/L-treated cells exposed to 8 h OGD followed by 2 h 50 μmol/L melatonin and reoxygenation (OGD/R + Mel + EX-527). Data are normalized to the loading control β-actin and are expressed as % of control (mean ± SD, N = 3 independent experiments); * p < 0.05, *** p < 0.001 vs. Ctrl, one-way ANOVA followed by Dunnett multiple comparison test; * p < 0.05, ** p < 0.01, *** p < 0.001, Newman-Keuls multiple comparison test (lines). (E) Quantitative evaluation of Lysotracker green (LTG) labeling in Ctrl, OGD/R, OGD/R + Mel and OGD/R + Mel + EX-527 cells after 2 h reoxygenation. Results are expressed as mean fluorescence intensity (MFI) (mean ± SD, N = 3 independent experiments performed in triplicate); * p < 0.05, ** p < 0.01, *** p < 0.001 vs. Ctrl, one-way ANOVA followed by Tukey’s multiple comparison test. (F) Quantitative evaluation of cell death by Propidium Iodide (PI) fluorescence analysis in Ctrl, OGD/R, OGD/R + Mel and OGD/R + Mel + EX-527 cells after 2 h reoxygenation. * p < 0.05, ** p < 0.01 vs. Ctrl, one-way ANOVA followed by Tukey’s multiple comparison test. (G) Transmission Electron Microscopy (TEM) micrographs from OGD/R + Mel and OGD/R + Mel + EX-527 cells after 2 h reoxygenation. Images show autolysosomes (green arrowheads) in OGD/R + Mel cells (panels a,b) and phagophores (orange arrowheads) and autophagosomes (red arrowheads) in OGD/R + Mel + EX-527 cells (panels cf). n, nucleus; m, mitochondria; r, endoplasmic reticulum; g, Golgi apparatus.
Figure 5
Figure 5
Melatonin modulates the Sirt1/FoxO1/Rab7 axis during OGD/R in organotypic hippocampal slice cultures. (A) Transmission electron microscopy (TEM) micrographs from untreated hippocampal slice cultures (Ctrl, panels ac), 45 min OGD-exposed hippocampal slice cultures followed by 2 h reoxygenation (OGD/R, panels df), 45 min OGD-exposed hippocampal slice cultures followed by 2 h 50 μmol/L melatonin reoxygenation (OGD/R + Mel, panels gi). Images show autophagosomes (red arrowheads) and autolysosomes (green arrowheads) in OGD/R and OGD/R + Mel cells, respectively. n, nucleus; s, synapse; np, neuropil, mt, microtubule; ly, lysosome; sv, synaptic vesicles; cap, capillary; A, Axon; *, necrotic area; orange arrowhead, phagophore; blue arrowhead, dystrophic neurite. (B) Representative Western blot and quantitative evaluation of Rab7, Sirt1 (C) and FoxO1 (D) in Ctrl, OGD/R, and OGD/R + Mel hippocampal slice cultures after 2 h reoxygenation. Data are normalized to the loading control β-actin and are expressed as a percentage of control (mean ± SD (N = 3 independent experiments); * p < 0.05, *** p < 0.001 vs. Ctrl, one-way ANOVA followed by Dunnett multiple comparison test; * p < 0.05, ** p < 0.01, Newman-Keuls multiple comparison test (lines). (E) Representative confocal images of Rab7 immunostaining in Ctrl, OGD/R, and OGD/R + Mel hippocampal slice cultures after 2 h reoxygenation. The green dots indicate Rab7 on late endosomes. Scale bars: 25, 50 μm.
Figure 6
Figure 6
Sirt1 inhibitor EX-527 blocks the melatonin effects on OGD/R-induced cell death in organotypic hippocampal slice cultures. (A) Representative Western blot and quantitative evaluation of Sirt1 and LC3 II (B) expression in vehicle-treated (Ctrl), EX-527-treated (Ctrl + EX-527) hippocampal slice cultures, 45 min OGD-exposed hippocampal slice cultures followed by 2 h reoxygenation (OGD/R), 45 min OGD-exposed hippocampal slice cultures followed by 2 h 50 μmol/L melatonin reoxygenation (OGD/R + Mel), and EX-527-treated and 45 min OGD-exposed hippocampal slice cultures followed by 2 h 50 μmol/L melatonin reoxygenation (OGD/R + Mel + EX-527). Data are normalized to the loading control β-actin and are expressed as % of control (mean ± SD, N = 3 independent experiments); * p < 0.05, ** p < 0.01, *** p < 0.001 vs. Ctrl, One-way ANOVA followed by Dunnett multiple comparison test; ** p < 0.01, Newman-Keuls multiple comparison test (lines). (C) Quantitative evaluation of cell death and representative images (D) of Propidium Iodide (PI) fluorescence from NMDA-treated (NMDA 10 μM), Ctrl, Ctrl + EX-527, OGD/R, OGD/R + Mel and OGD/R + Mel + EX-527 hippocampal slice cultures after 24 h reoxygenation. * p < 0.05, *** p < 0.001 vs. Ctrl, one-way ANOVA followed by Dunnett multiple comparison test; ** p < 0.01, Newman-Keuls multiple comparison test (lines), n = 15/group. CA1, DG (dentate gyrus), and CA3 represent the 3 main areas of the hippocampus damaged by NMDA or OGD/R and subjected to quantitative analysis. Images were acquired as described in Materials and Methods. Scale bar, 50 μm.

Similar articles

Cited by

References

    1. Ravikumar B., Sarkar S., Davies J.E., Futter M., Garcia-Arencibia M., Green-Thompson Z.W., Jimenez-Sanchez M., Korolchuk V., Lichtenberg M., Luo S., et al. Regulation of Mammalian Autophagy in Physiology and Pathophysiology. Physiol. Rev. 2010;90:1383–1435. doi: 10.1152/physrev.00030.2009. - DOI - PubMed
    1. Rubinsztein D.C., Shpilka T., Elazar Z. Mechanisms of Autophagosome Biogenesis. Curr. Biol. 2012;22:R29–R34. doi: 10.1016/j.cub.2011.11.034. - DOI - PubMed
    1. Jahn R., Scheller R.H. SNAREs—Engines for membrane fusion. Nat. Rev. Mol. Cell Biol. 2006;7:631–643. doi: 10.1038/nrm2002. - DOI - PubMed
    1. Yu I.-M., Hughson F.M. Tethering Factors as Organizers of Intracellular Vesicular Traffic. Annu. Rev. Cell Dev. Biol. 2010;26:137–156. doi: 10.1146/annurev.cellbio.042308.113327. - DOI - PubMed
    1. Langemeyer L., Fröhlich F., Ungermann C. Rab GTPase Function in Endosome and Lysosome Biogenesis. Trends Cell Biol. 2018;28:957–970. doi: 10.1016/j.tcb.2018.06.007. - DOI - PubMed

Grants and funding

This research received no external funding.