Establishment of an ovarian cancer omentum metastasis-related prognostic model by integrated analysis of scRNA-seq and bulk RNA-seq
- PMID: 36424614
- PMCID: PMC9686070
- DOI: 10.1186/s13048-022-01059-0
Establishment of an ovarian cancer omentum metastasis-related prognostic model by integrated analysis of scRNA-seq and bulk RNA-seq
Abstract
Objective: Ovarian cancer has the highest mortality rate among gynecological malignant tumors, and it preferentially metastasizes to omental tissue, leading to intestinal obstruction and death. scRNA-seq is a powerful technique to reveal tumor heterogeneity. Analyzing omentum metastasis of ovarian cancer at the single-cell level may be more conducive to exploring and understanding omentum metastasis and prognosis of ovarian cancer at the cellular function and genetic levels.
Methods: The omentum metastasis site scRNA-seq data of GSE147082 were acquired from the GEO (Gene Expression Omnibus) database, and single cells were clustered by the Seruat package and annotated by the SingleR package. Cell differentiation trajectories were reconstructed through the monocle package. The ovarian cancer microarray data of GSE132342 were downloaded from GEO and were clustered by using the ConsensusClusterPlus package into omentum metastasis-associated clusters according to the marker genes gained from single-cell differentiation trajectory analysis. The tumor microenvironment (TME) and immune infiltration differences between clusters were analyzed by the estimate and CIBERSORT packages. The expression matrix of genes used to cluster GSE132342 patients was extracted from bulk RNA-seq data of TCGA-OV (The Cancer Genome Atlas ovarian cancer), and least absolute shrinkage and selection operator (LASSO) and multivariate Cox regression were performed to establish an omentum metastasis-associated gene (OMAG) signature. The signature was then tested by GSE132342 data. Finally, the clinicopathological characteristics of TCGA-OV were screened by univariate and multivariate Cox regression analysis to draw the nomogram.
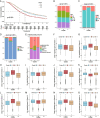
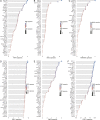
Results: A total of 9885 cells from 6 patients were clustered into 18 cell clusters and annotated into 14 cell types. Reconstruction of differentiation trajectories divided the cells into 5 branches, and a total of 781 cell trajectory-related characteristic genes were obtained. A total of 3769 patients in GSE132342 were subtyped into 3 clusters by 74 cell trajectory-related characteristic genes. Kaplan-Meier (K-M) survival analysis showed that the prognosis of cluster 2 was the worst, P < 0.001. The TME analysis showed that the ESTIMATE score and stromal score in cluster 2 were significantly higher than those in the other two clusters, P < 0.001. The immune infiltration analysis showed differences in the fraction of 8 immune cells among the 3 clusters, P < 0.05. The expression data of 74 genes used for GEO clustering were extracted from 379 patients in TCGA-OV, and combined with survival information, 10 candidates for OMAGs were filtered by LASSO. By using multivariate Cox regression, the 6-OMAGs signature was established as RiskScore = 0.307*TIMP3 + 3.516*FBN1-0.109*IGKC + 0.209*RPL21 + 0.870*UCHL1 + 0.365*RARRES1. Taking TCGA-OV as the training set and GSE132342 as the test set, receiver operating characteristic (ROC) curves were drawn to verify the prognostic value of 6-OMAGs. Screened by univariate and multivariate Cox regression analysis, 3 (age, cancer status, primary therapy outcome) of 5 clinicopathological characteristics were used to construct the nomogram combined with risk score.
Conclusion: We constructed an ovarian cancer prognostic model related to omentum metastasis composed of 6-OMAGs and 3 clinicopathological features and analyzed the potential mechanism of these 6-OMAGs in ovarian cancer omental metastasis.
Keywords: 6-OMAGs; Omentum metastasis; Ovarian cancer; Prognosis; Tumor microenvironment; scRNA-seq.
© 2022. The Author(s).
Conflict of interest statement
None.
Figures


Similar articles
-
Establishment of an ovarian cancer exhausted CD8+T cells-related genes model by integrated analysis of scRNA-seq and bulk RNA-seq.Eur J Med Res. 2024 Jul 5;29(1):358. doi: 10.1186/s40001-024-01948-8. Eur J Med Res. 2024. PMID: 38970067 Free PMC article.
-
Comprehensive analysis of scRNA-Seq and bulk RNA-Seq reveals dynamic changes in the tumor immune microenvironment of bladder cancer and establishes a prognostic model.J Transl Med. 2023 Mar 27;21(1):223. doi: 10.1186/s12967-023-04056-z. J Transl Med. 2023. PMID: 36973787 Free PMC article.
-
Development and validation a prognostic model based on natural killer T cells marker genes for predicting prognosis and characterizing immune status in glioblastoma through integrated analysis of single-cell and bulk RNA sequencing.Funct Integr Genomics. 2023 Aug 31;23(3):286. doi: 10.1007/s10142-023-01217-7. Funct Integr Genomics. 2023. PMID: 37650991
-
Phosphorus Metabolism-Related Genes Serve as Novel Biomarkers for Predicting Prognosis in Bladder Cancer: A Bioinformatics Analysis.Iran J Public Health. 2024 Sep;53(9):1935-1950. doi: 10.18502/ijph.v53i9.16449. Iran J Public Health. 2024. PMID: 39429662 Free PMC article. Review.
-
Single-cell RNA sequencing in endometrial cancer: exploring the epithelial cells and the microenvironment landscape.Front Immunol. 2024 Aug 20;15:1425212. doi: 10.3389/fimmu.2024.1425212. eCollection 2024. Front Immunol. 2024. PMID: 39229264 Free PMC article. Review.
Cited by
-
Single-cell analysis revealed that MTIF2 could promote hepatocellular carcinoma progression through modulating the ROS pathway.Heliyon. 2024 Jul 10;10(14):e34438. doi: 10.1016/j.heliyon.2024.e34438. eCollection 2024 Jul 30. Heliyon. 2024. PMID: 39082024 Free PMC article.
-
Establishment of an ovarian cancer exhausted CD8+T cells-related genes model by integrated analysis of scRNA-seq and bulk RNA-seq.Eur J Med Res. 2024 Jul 5;29(1):358. doi: 10.1186/s40001-024-01948-8. Eur J Med Res. 2024. PMID: 38970067 Free PMC article.
-
ULK2 suppresses ovarian cancer cell migration and invasion by elevating IGFBP3.PeerJ. 2024 Jun 28;12:e17628. doi: 10.7717/peerj.17628. eCollection 2024. PeerJ. 2024. PMID: 38952983 Free PMC article.
-
Identification and validation of immunity- and disulfidptosis-related genes signature for predicting prognosis in ovarian cancer.Heliyon. 2024 Jun 7;10(12):e32273. doi: 10.1016/j.heliyon.2024.e32273. eCollection 2024 Jun 30. Heliyon. 2024. PMID: 38952356 Free PMC article.
-
Glutamine metabolism prognostic index predicts tumour microenvironment characteristics and therapeutic efficacy in ovarian cancer.J Cell Mol Med. 2024 Apr;28(7):e18198. doi: 10.1111/jcmm.18198. J Cell Mol Med. 2024. PMID: 38506093 Free PMC article.
References
-
- Menon U, Gentry-Maharaj A, Burnell M, et al. Ovarian cancer population screening and mortality after long-term follow-up in the UK Collaborative Trial of Ovarian Cancer Screening (UKCTOCS): a randomised controlled trial. Lancet. 2021;397:2182–93. doi: 10.1016/S0140-6736(21)00731-5. - DOI - PMC - PubMed
MeSH terms
Substances
Grants and funding
LinkOut - more resources
Full Text Sources
Medical
Miscellaneous

