. 2022 Nov 3;6(4):40.
doi: 10.3390/epigenomes6040040.

Regulation of Polyhomeotic Condensates by Intrinsically Disordered Sequences That Affect Chromatin Binding

Affiliations

Regulation of Polyhomeotic Condensates by Intrinsically Disordered Sequences That Affect Chromatin Binding

Ibani Kapur et al. Epigenomes. .

Abstract

The Polycomb group (PcG) complex PRC1 localizes in the nucleus in condensed structures called Polycomb bodies. The PRC1 subunit Polyhomeotic (Ph) contains an oligomerizing sterile alpha motif (SAM) that is implicated in both PcG body formation and chromatin organization in Drosophila and mammalian cells. A truncated version of Ph containing the SAM (mini-Ph) forms phase-separated condensates with DNA or chromatin in vitro, suggesting that PcG bodies may form through SAM-driven phase separation. In cells, Ph forms multiple small condensates, while mini-Ph typically forms a single large nuclear condensate. We therefore hypothesized that sequences outside of mini-Ph, which are predicted to be intrinsically disordered, are required for proper condensate formation. We identified three distinct low-complexity regions in Ph based on sequence composition. We systematically tested the role of each of these sequences in Ph condensates using live imaging of transfected Drosophila S2 cells. Each sequence uniquely affected Ph SAM-dependent condensate size, number, and morphology, but the most dramatic effects occurred when the central, glutamine-rich intrinsically disordered region (IDR) was removed, which resulted in large Ph condensates. Like mini-Ph condensates, condensates lacking the glutamine-rich IDR excluded chromatin. Chromatin fractionation experiments indicated that the removal of the glutamine-rich IDR reduced chromatin binding and that the removal of either of the other IDRs increased chromatin binding. Our data suggest that all three IDRs, and functional interactions among them, regulate Ph condensate size and number. Our results can be explained by a model in which tight chromatin binding by Ph IDRs antagonizes Ph SAM-driven phase separation. Our observations highlight the complexity of regulation of biological condensates housed in single proteins.

Keywords: Drosophila; Polycomb; chromatin; condensate; intrinsically disordered region; phase separation; sterile alpha motif.


Conflict of interest statement

The authors declare no conflict of interest.

Figures
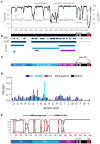
Figure 1
Figure 1
Identification of three IDRs in Ph. (A) Prediction of intrinsically disordered sequence using MetapredictV2, which integrates AlphaFold 2 predictions [32,33]. x-axis is amino acid position. Most of Ph was predicted to be disordered (>0.5 on left y-axis), with the exception of Ph SAM (indicated with a red line). The two other red lines correspond to the HD1 and FCS motifs, which were scored as disordered, although the AlphaFold2 signal predicted some order. The grey bar indicates a region predicted to have some order; this is a densely Q-rich region that was predicted to form helices/coiled coils. (B) SEG/CAST analysis of Ph using PlaToLoCo [39] suggested that the disordered region could be parsed into subregions based on which amino acids were masked (repetitive). CAST track indicated all masked regions, and the masked amino acids are indicated below. (C) Schematic of different regions in the disordered Ph region defined as Ph1(IDR1), Ph2(IDR2) and Ph3(IDR3). (D) Frequency of each amino acid in the three IDRs relative to the SwissProt and DisProt databases. (E) Prion-like domain prediction using PLAAC [40]. IDR 2 was dominated by high scoring prion-like regions, but all three IDRs had predicted PrDs. See Figure S2 for the full sequence of each IDR.
Figure 2
Figure 2
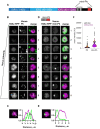
Characterization of Ph and mini-Ph condensates and their relationship to protein expression level. (A) Schematic of Polyhomeotic. (BE) Representative images of live S2 cells that were co-transfected with Venus-Ph (B,C) or Venus-mini-Ph (D,E). H2Av-RFP was co-transfected as a nuclear marker. Images are from a single slice from a confocal stack and are arranged (1–8) based on the mean nuclear Venus intensity. Note that images were adjusted to make the signals visible for presentation, so the intensities cannot be compared across images. Scale bar is 3 microns. (C,E) Line scans through condensates to assess co-localization with chromatin. Both signals are scaled to their maximum intensity on the y-axis. (F) Relationship between mean nuclear Venus intensity and condensate formation. Cells without condensates are indicated in magenta, and those with condensates are indicated in black. Intensity values for the cells shown in (B,D) are indicated by orange symbols. Bar shows median. WT-Ph, n = 391; mini-Ph, n = 93.
Figure 3
Figure 3
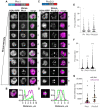
Effect of Ph1 IDR on condensates. (AD) Representative images of live S2 cells that were co-transfected with Venus-PhΔ1 (A,B) or Venus-PhΔ2Δ3 (C,D). H2Av-RFP was co-transfected as a nuclear marker. Images are from a single slice from a confocal stack and are arranged based on the mean nuclear Venus intensity. Images were adjusted to make the signals visible for presentation, so the intensities cannot be compared across images. Arrows indicate chromatin “fissures”. Scale bar is 3 microns. (B,D) Line scans through condensates to assess co-localization with chromatin. Both signals are scaled to their maximum intensity (y-axis). (E,F) Graph of the number of condensates (foci) per nucleus (E) and condensate size (F) from Cell Profiler analysis. The total number of transfected cells analyzed (with or without foci): WT-Ph, n = 3478; PhΔ1, n = 2426; PhΔ2Δ3, n = 2911. p-values are presented for comparison with WT using the Kruskal–Wallis test with Dunnett’s correction for multiple comparisons. *** p < 0.0001. (G) Relationship between mean nuclear intensity and condensate formation. Cells without condensates are indicated in magenta, and those with condensates are indicated in black. Intensity values for the cells shown in (A,C) are indicated by orange symbols. Bar shows median. PhΔ1, n = 78; PhΔ2Δ3, n = 48.
Figure 4
Figure 4
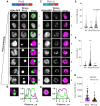
Effect of Ph2 IDR on condensates. (AD) Representative images of live S2 cells that were co-transfected with Venus-PhΔ2 (B) or Venus-PhΔ1Δ3. H2Av-RFP was co-transfected as a nuclear marker. Images are from a single slice from a confocal stack and are arranged based on the mean nuclear Venus intensity. Images were adjusted to make the signals visible for presentation, so the intensities cannot be compared across images. White arrows indicate examples of chromatin “fissures”. Scale bar is 3 microns. (B,D) Line scans through condensates to assess co-localization with chromatin. Both signals are scaled to their maximum intensity (y-axis). (E,F) Graph of the number of condensates (foci) per nucleus (E) and condensate size (F) from Cell Profiler analysis. The total number of transfected cells analyzed (with or without foci): WT-Ph, n = 3478; PhΔ2, n = 1539; PhΔ1Δ3, n = 1568. p-values are presented for comparison with WT using the Kruskal–Wallis test with Dunnett’s correction for multiple comparisons. *** p < 0.0001. (G) Relationship between mean intensity and condensate formation. Cells without condensates are indicated in magenta, and those with condensates are indicated in black. Intensity values for the cells shown in (A,C) are indicated by orange symbols. Bar shows median. PhΔ2, n = 95; PhΔ1Δ3, n = 124.
Figure 5
Figure 5
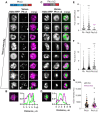
Effect of Ph3 IDR on condensates. (AD) Representative images of live S2 cells that were co-transfected with Venus-PhΔ3 (B) or Venus-PhΔ1Δ2. H2Av-RFP was co-transfected as a nuclear marker. Images are from a single slice from a confocal stack and are arranged based on the mean nuclear Venus intensity. Images were adjusted to make the signals visible for presentation, so the intensities cannot be compared across images. Scale bar is 3 microns. (B,D) Line scans through condensates to assess co-localization with chromatin. Both signals are scaled to their maximum intensity (y-axis). (E,F) Graph of the number of condensates (foci) per nucleus (E) and condensate size (F) from Cell Profiler analysis. The total number of transfected cells analyzed (with or without foci): WT-Ph, n = 3478; PhΔ3, n = 1557; PhΔ1Δ2, n = 1038. p-values are presented for comparison with WT using the Kruskal–Wallis test with Dunnett’s correction for multiple comparisons. *** p < 0.0001 (G) Relationship between mean intensity and condensate formation. Cells without condensates are indicated in magenta, and those with condensates are indicated in black. Intensity values for the cells shown in (A,C) are indicated by orange symbols. Bar shows median. PhΔ3, n = 71; PhΔ1Δ2, n = 67.
Figure 6
Figure 6
Effect of Ph IDRs on chromatin association. (A) Schematic of cell fractionation protocol (based on [47]). Note that P2 was digested with DNaseI and RNaseA, and the supernatant from this was analyzed as S4 on blots. However, this digest was not successful because histones were not released into the supernatant, so we pooled the signals from S4 and P2 for quantification. (B) Representative Western blot of the subcellular fractionation of untransfected S2 cells. Lamin was used as a nuclear marker, and tubulin was used as a cytoplasmic one. Endogenous Ph (Ph-p and Ph-d, with major isoforms at ~170 kDa and ~150 kDa) was mainly found in the chromatin fraction. (C) Representative Western blot of the subcellular fractionation of S2 cells transfected with Venus-Ph. Blots were probed with anti-GFP to recognize Venus-Ph (faintly visible, asterisk) and reprobed with anti-tubulin, anti-lamin, and anti-RFP to detect co-transfected H2Av-RFP. (D,E) Representative Western blots of the fractions of cells transfected with the indicated constructs, separated by whether they included (D) or did not include (E) the Ph2 IDR. Venus-Ph proteins were detected with anti-GFP. Note that in all Western blots, 2× more P2 was loaded than other fractions. Fractions for cells transfected with constructs lacking Ph2 were loaded at 0.67× the amount of those expressing constructs with Ph2. (F) Summary of quantification of three independent fractionation experiments. Error bars show mean and standard deviation. Numbers are p-values for one-way ANOVA comparing the fraction in chromatin relative to WT-Ph.
Figure 7
Figure 7
Effect of Ph IDRs on condensate formation in the absence of the SAM. (A) Representative live images of S2 cells transfected with Venus-Ph constructs lacking one or two IDRs and the SAM with H2Av-RFP as a nuclear marker. Images show maximum intensity projections of confocal stacks. Scale bar is 5 microns. (B) Quantification of foci count per nucleus for H2Av-RFP-positive cells. (C) Percent of H2Av-RFP-positive cells that formed foci. Note that for PhΔ1ΔSAM, most of the foci-forming cells were scored based on a single condensate. Manual inspection suggested that this likely reflected uneven protein distribution rather than true condensates. At least 100 cells from each of the three independent experiments were analyzed. The total number of cells analyzed was: PhΔSAM, n = 1348; PhΔ1ΔSAM, n = 411; PhΔ2ΔSAM, n = 359; PhΔ3ΔSAM, n = 214; PhΔ1Δ3ΔSAM, n = 922; PhΔ2Δ3ΔSAM, n = 1413. p-values are presented for comparison with PhΔSAM using the Kruskal–Wallis test with Dunnett’s correction for multiple comparisons.
Figure 8
Figure 8
Condensate formation by Ph IDRs. (A) Representative live images of S2 cells transfected with the Venus-Ph truncation constructs (IDRs only) with H2Av-RFP as a nuclear marker. Images show maximum intensity projections of confocal stacks, and the scale bar is 5 microns. (B) Quantification of foci per nucleus. Bars show the median value for cells that formed foci, pooled from three independent experiments. (C) Percent of H2Av-RFP-positive cells that formed foci. The total number of transfected cells analyzed (with and without foci) were as follows: Ph1, n = 268; Ph2, n = 412; Ph3, n = 309; Ph5, n = 857; Ph6, n = 460; Ph7, n = 175. p-values are presented for comparison with WT-Ph using the Kruskal–Wallis test with Dunnett’s correction for multiple comparisons.
Figure 9
Figure 9
Model for role of Ph IDRs in SAM-dependent condensate formation. (A) Comparison of condensates formed by mini-Ph and Ph demonstrates the effect of the IDRs. (B) Schematic of interactions that may be balanced to form multiple condensates in constructs containing the Ph2 IDR. Protein–protein interactions between the mini-Ph region and among the IDRs are predicted to drive phase separation, while tight binding to chromatin mediated by Ph2 may restrict condensate formation. (C) Schematic of how removing Ph2 may lead to the formation of large condensates by removing the constraint imposed by tight chromatin binding. (D) Working model for regulatory network among IDRs. Ph2 (gray arrow) restricts both the size of condensates and propensity for formation when Ph SAM is present, and it imparts tight chromatin association. Ph3 inhibits the ability of both Ph1 and Ph2 to promote condensate formation; it may also inhibit the SAM (as previously proposed).

Similar articles

Cited by

References

    1. Banani S.F., Lee H.O., Hyman A.A., Rosen M.K. Biomolecular condensates: Organizers of cellular biochemistry. Nat. Rev. Mol. Cell Biol. 2017;18:285–298. doi: 10.1038/nrm.2017.7. - DOI - PMC - PubMed
    1. Larson A.G., Narlikar G.J. The Role of Phase Separation in Heterochromatin Formation, Function, and Regulation. Biochemistry. 2018;57:2540–2548. doi: 10.1021/acs.biochem.8b00401. - DOI - PMC - PubMed
    1. Shin Y., Brangwynne C.P. Liquid phase condensation in cell physiology and disease. Science. 2017;357:eaaf4382. doi: 10.1126/science.aaf4382. - DOI - PubMed
    1. Boeynaems S., Alberti S., Fawzi N.L., Mittag T., Polymenidou M., Rousseau F., Schymkowitz J., Shorter J., Wolozin B., van den Bosch L., et al. Protein Phase Separation: A New Phase in Cell Biology. Trends Cell Biol. 2018;28:420–435. doi: 10.1016/j.tcb.2018.02.004. - DOI - PMC - PubMed
    1. Lasker K., Boeynaems S., Lam V., Stainton E., Jacquemyn M., Daelemans D., Villa E., Holehouse A.S., Gitler A.D., Shapiro L. A modular platform for engineering function of natural and synthetic biomolecular condensates. bioRxiv. 2021 doi: 10.1101/2021.02.03.429226. - DOI - PMC - PubMed

Grants and funding

LinkOut - more resources