

Gut microbiota dysbiosis as an inflammaging condition that regulates obesity-related retinopathy and nephropathy
- PMID: 36406423
- PMCID: PMC9666733
- DOI: 10.3389/fmicb.2022.1040846
Gut microbiota dysbiosis as an inflammaging condition that regulates obesity-related retinopathy and nephropathy
Abstract
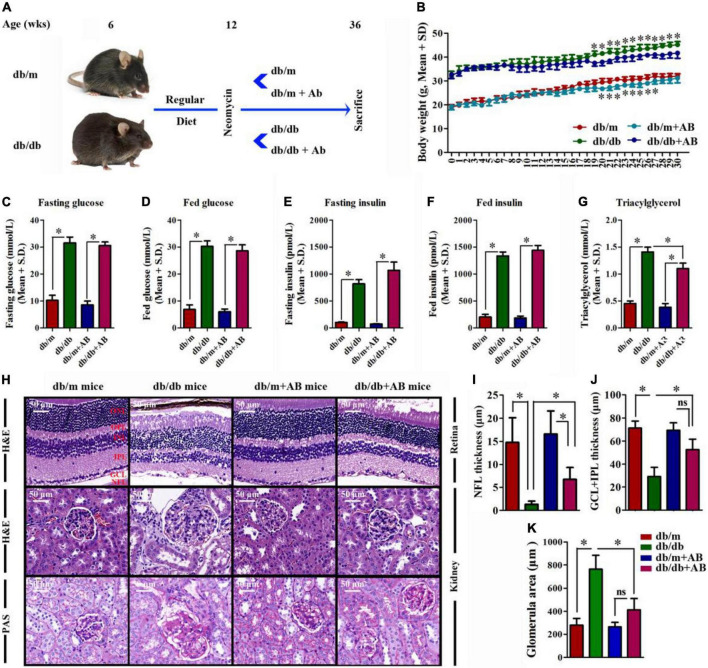
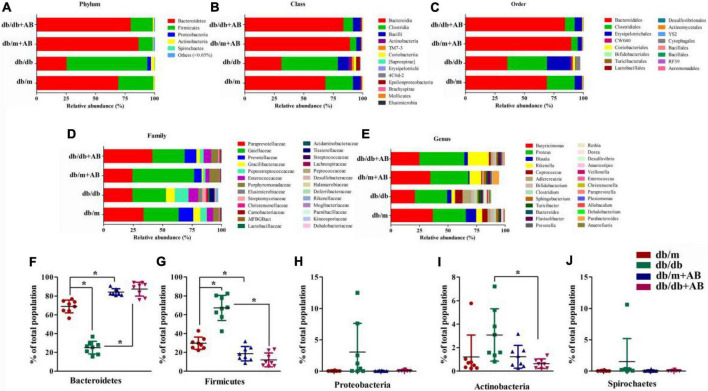
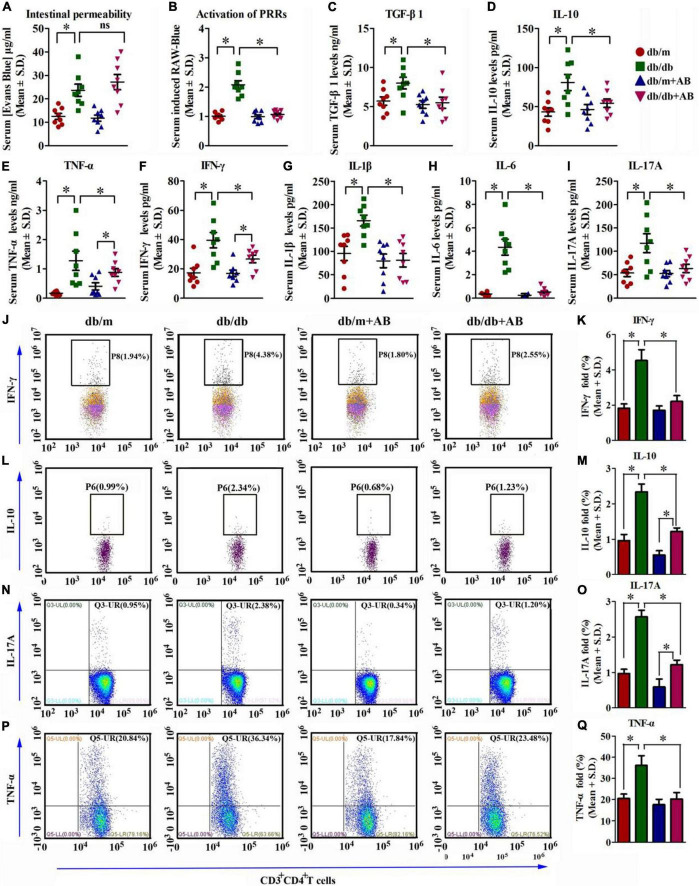
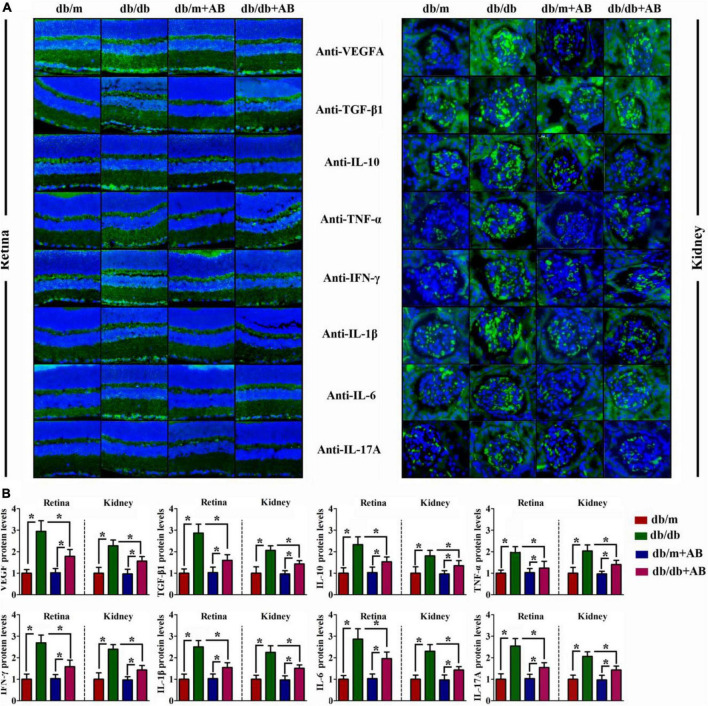
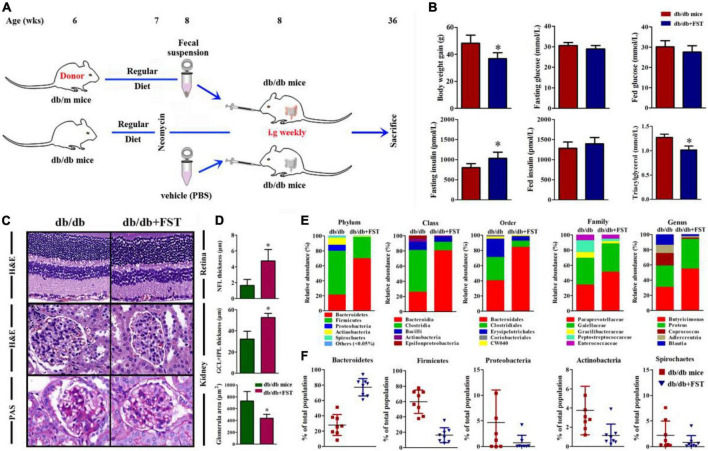
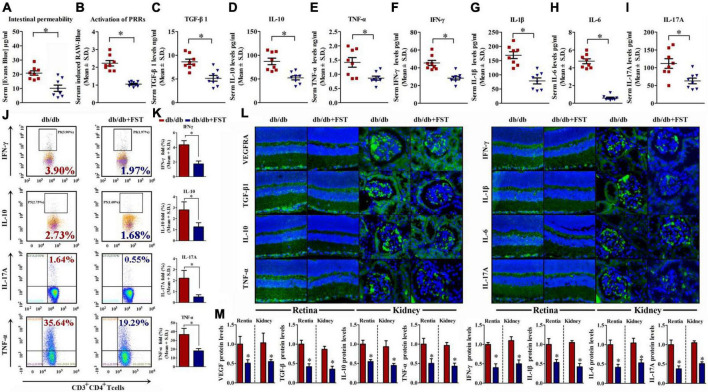
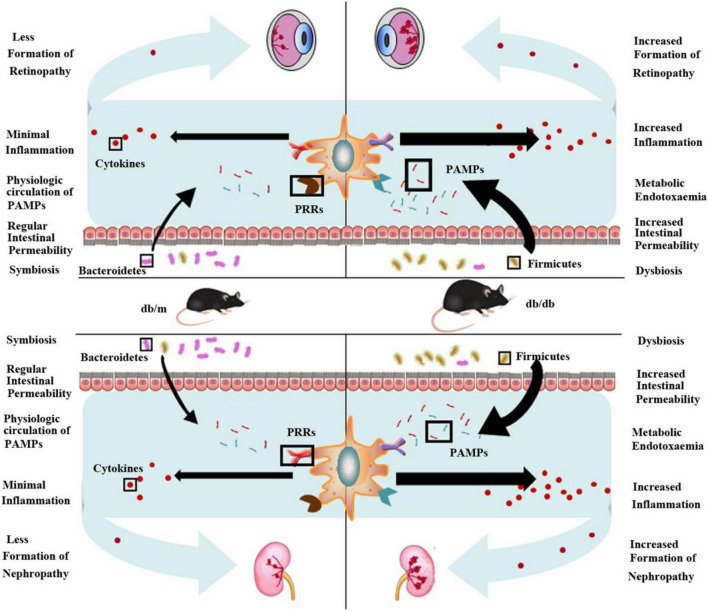
Diabetes-specific microvascular disease is a leading cause of blindness, renal failure and nerve damage. Epidemiological data demonstrated that the high morbidity of T2DM occurs as a result of obesity and gradually develops into serious complications. To date, the mechanisms that underlie this observation are still ill-defined. In view of the effect of obesity on the gut microflora, Leprdb/db mice underwent antibiotic treatment and microbiota transplants to modify the gut microbiome to investigate whether microbes are involved in the development of diabetic nephropathy (DN) and/or diabetic retinopathy (DR). The mouse feces were collected for bacterial 16S ribosomal RNA gene sequencing. Cytokines including TNF-α, TGF-β1, IFN-γ, IL-1β, IL-6, IL-17A, IL-10, and VEGFA were detected by enzyme-linked immunosorbent assay (ELISA), flow cytometry, real-time PCR and immunofluorescent assay. Eyes and kidney were collected for histopathological assay. Intestinal permeability was also detected using Evans Blue. The results showed that obesity influenced metabolic variables (including fast/fed glucose, insulin, and triglyceride), retinopathy and nephropathy, and the gut microbiota. Obesity mainly reduced the ratio of Bacteroidetes/Firmicutes and influenced relative abundance of Proteobacteria, Actinobacteria, and Spirochetes. Obesity also increased intestinal permeability, metabolic endotoxemia, cytokines, and VEGFA. Microbiota transplants confirm that obesity aggravates retinopathy and nephropathy through the gut microbiota. These findings suggest that obesity exacerbates retinopathy and nephropathy by inducing gut microbiota dysbiosis, which further enhanced intestinal permeability and chronic low-grade inflammation.
Keywords: diabetic nephropathy; diabetic retinopathy; gut microbiota (GM); inflammaging; obesity.
Copyright © 2022 Li, Lv, Cao, Zhang, Tan, Chu, Zhao, Liu and Ren.
Conflict of interest statement
Authors L-LZ and ZL were employed by Lunan Pharmaceutical Group Co., Ltd. The remaining authors declare that the research was conducted in the absence of any commercial or financial relationships that could be construed as a potential conflict of interest.
Figures
Similar articles
-
Diabetic gut microbiota dysbiosis as an inflammaging and immunosenescence condition that fosters progression of retinopathy and nephropathy.Biochim Biophys Acta Mol Basis Dis. 2019 Jul 1;1865(7):1876-1897. doi: 10.1016/j.bbadis.2018.09.032. Epub 2018 Oct 1. Biochim Biophys Acta Mol Basis Dis. 2019. PMID: 30287404 Review.
-
Association between Gut Microbiota Compositions with MicrovascularComplications in Individuals with Diabetes: A Systematic Review.Curr Diabetes Rev. 2024;20(10):e240124226068. doi: 10.2174/0115733998280396231212114345. Curr Diabetes Rev. 2024. PMID: 38275035
-
Gut microbiota influences pathological angiogenesis in obesity-driven choroidal neovascularization.EMBO Mol Med. 2016 Dec 1;8(12):1366-1379. doi: 10.15252/emmm.201606531. Print 2016 Dec. EMBO Mol Med. 2016. PMID: 27861126 Free PMC article.
-
Bifidobacterium pseudocatenulatum CECT 7765 Reduces Obesity-Associated Inflammation by Restoring the Lymphocyte-Macrophage Balance and Gut Microbiota Structure in High-Fat Diet-Fed Mice.PLoS One. 2015 Jul 10;10(7):e0126976. doi: 10.1371/journal.pone.0126976. eCollection 2015. PLoS One. 2015. PMID: 26161548 Free PMC article.
-
Gut Microbiota Dysbiosis in Diabetic Retinopathy-Current Knowledge and Future Therapeutic Targets.Life (Basel). 2023 Apr 7;13(4):968. doi: 10.3390/life13040968. Life (Basel). 2023. PMID: 37109497 Free PMC article. Review.
Cited by
-
Research progress of diabetic retinopathy and gut microecology.Front Microbiol. 2023 Sep 7;14:1256878. doi: 10.3389/fmicb.2023.1256878. eCollection 2023. Front Microbiol. 2023. PMID: 37744925 Free PMC article. Review.
-
Gut microbiota microbial metabolites in diabetic nephropathy patients: far to go.Front Cell Infect Microbiol. 2024 May 8;14:1359432. doi: 10.3389/fcimb.2024.1359432. eCollection 2024. Front Cell Infect Microbiol. 2024. PMID: 38779567 Free PMC article. Review.
-
Gut microbiota and its metabolites - molecular mechanisms and management strategies in diabetic kidney disease.Front Immunol. 2023 Jan 19;14:1124704. doi: 10.3389/fimmu.2023.1124704. eCollection 2023. Front Immunol. 2023. PMID: 36742307 Free PMC article. Review.
-
Emerging Vistas for the Nutraceutical Withania somnifera in Inflammaging.Pharmaceuticals (Basel). 2024 May 7;17(5):597. doi: 10.3390/ph17050597. Pharmaceuticals (Basel). 2024. PMID: 38794167 Free PMC article. Review.
-
Capsaicin Reduces Obesity by Reducing Chronic Low-Grade Inflammation.Int J Mol Sci. 2024 Aug 18;25(16):8979. doi: 10.3390/ijms25168979. Int J Mol Sci. 2024. PMID: 39201665 Free PMC article.
References
-
- Barchetta I., Alessandri C., Bertoccini L., Cimini F. A., Taverniti L., Di Franco M., et al. (2016). Increased circulating osteopontin levels in adult patients with type 1 diabetes mellitus and association with dysmetabolic profile. Eur. J. Endocrinol. 174 187–192. 10.1530/EJE-15-0791 - DOI - PubMed
LinkOut - more resources
Full Text Sources
Miscellaneous