. 2022 Nov 19;12(1):19921.
doi: 10.1038/s41598-022-21171-x.

Hnf1b renal expression directed by a distal enhancer responsive to Pax8

Affiliations

Hnf1b renal expression directed by a distal enhancer responsive to Pax8

L Goea et al. Sci Rep. .

Abstract

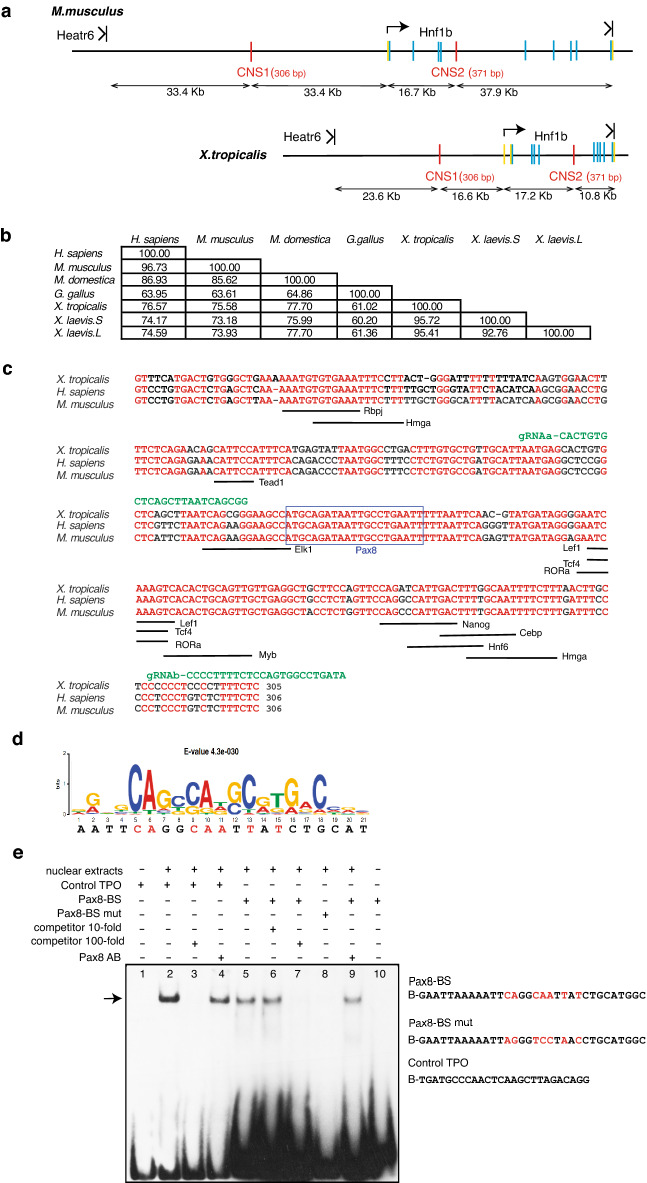
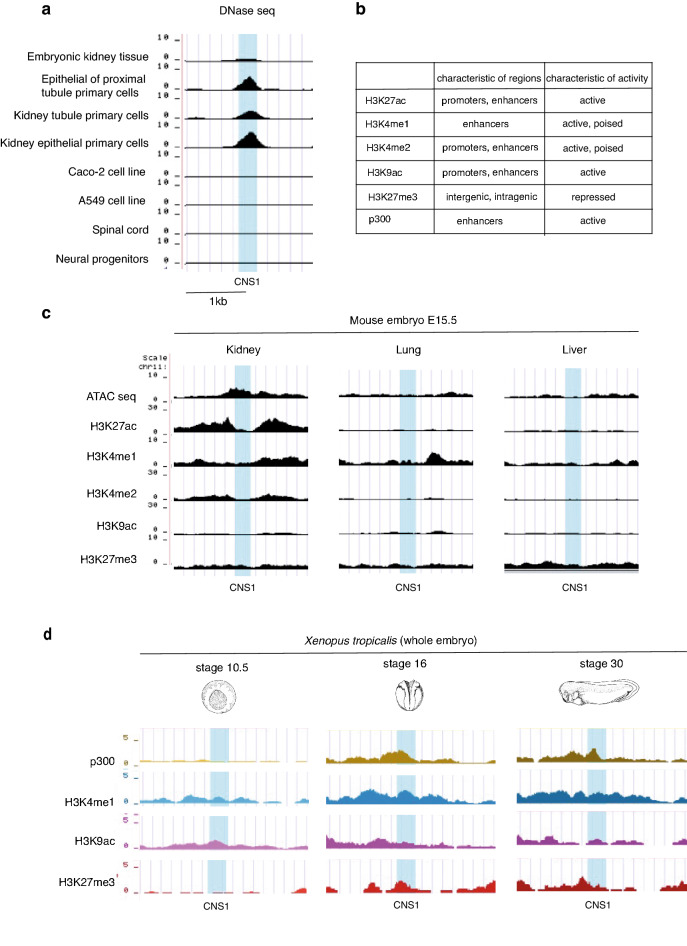
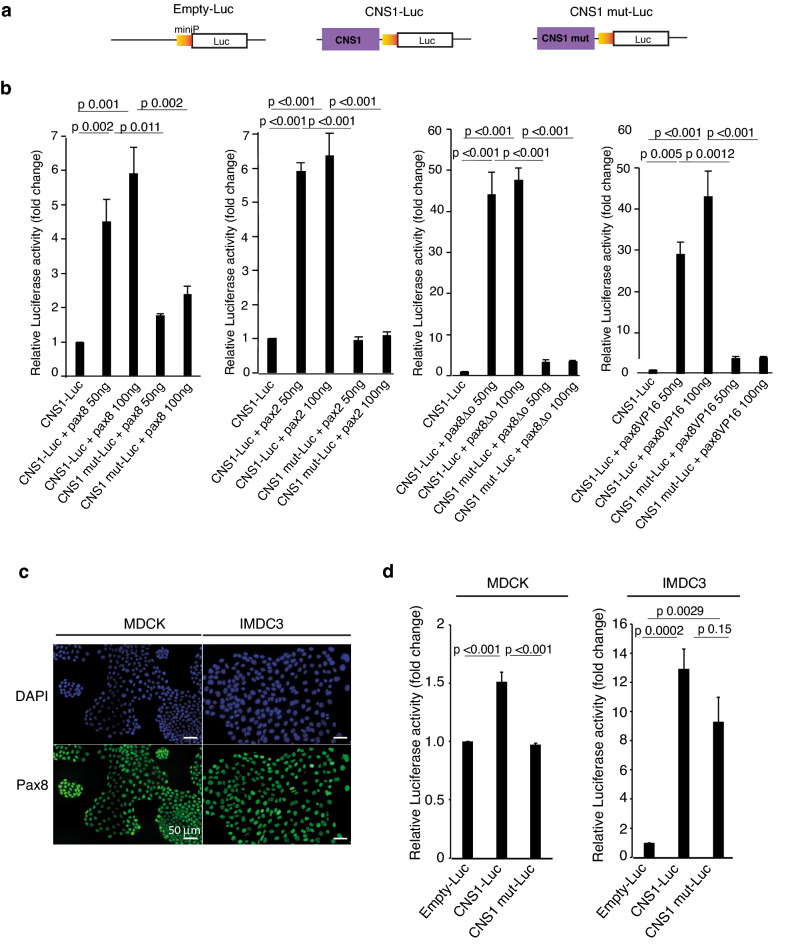
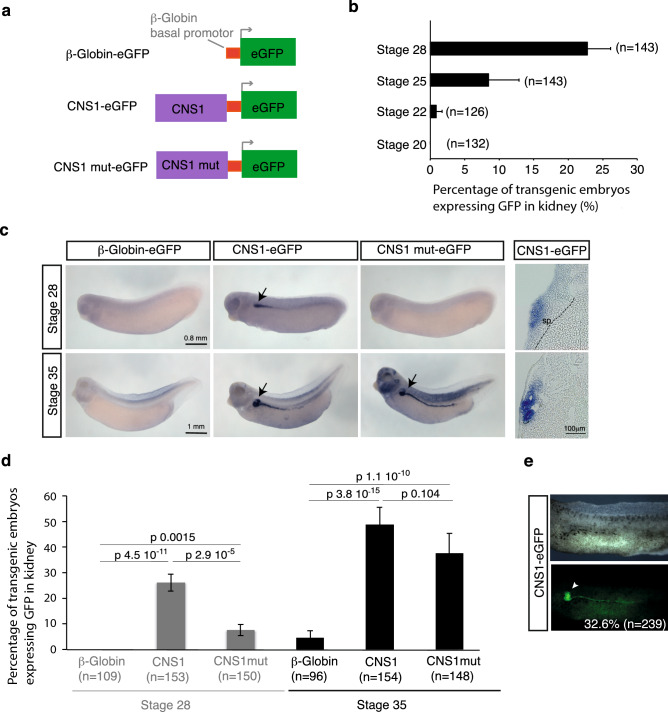
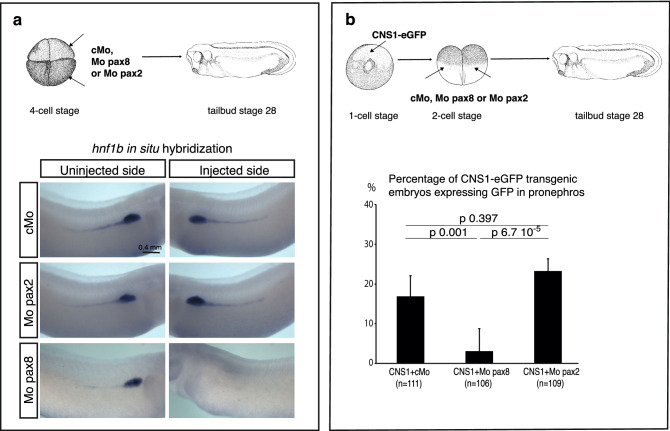
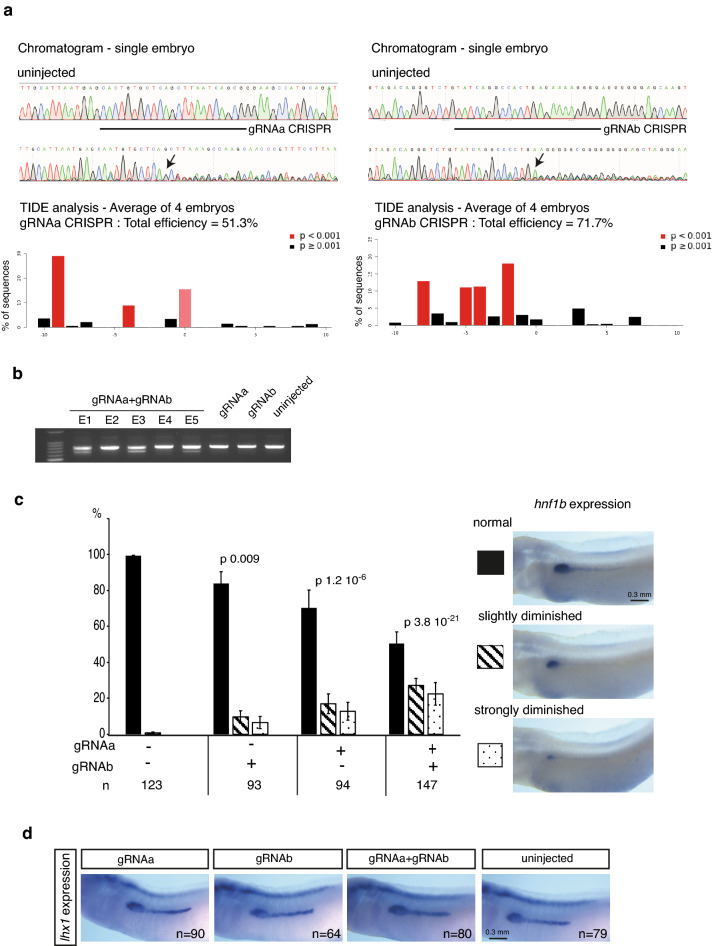
Xenopus provides a simple and efficient model system to study nephrogenesis and explore the mechanisms causing renal developmental defects in human. Hnf1b (hepatocyte nuclear factor 1 homeobox b), a gene whose mutations are the most commonly identified genetic cause of developmental kidney disease, is required for the acquisition of a proximo-intermediate nephron segment in Xenopus as well as in mouse. Genetic networks involved in Hnf1b expression during kidney development remain poorly understood. We decided to explore the transcriptional regulation of Hnf1b in the developing Xenopus pronephros and mammalian renal cells. Using phylogenetic footprinting, we identified an evolutionary conserved sequence (CNS1) located several kilobases (kb) upstream the Hnf1b transcription start and harboring epigenomic marks characteristics of a distal enhancer in embryonic and adult renal cells in mammals. By means of functional expression assays in Xenopus and mammalian renal cell lines we showed that CNS1 displays enhancer activity in renal tissue. Using CRISPR/cas9 editing in Xenopus tropicalis, we demonstrated the in vivo functional relevance of CNS1 in driving hnf1b expression in the pronephros. We further showed the importance of Pax8-CNS1 interaction for CNS1 enhancer activity allowing us to conclude that Hnf1b is a direct target of Pax8. Our work identified for the first time a Hnf1b renal specific enhancer and may open important perspectives into the diagnosis for congenital kidney anomalies in human, as well as modeling HNF1B-related diseases.


Conflict of interest statement

The authors declare no competing interests.

Figures

Figure 1
Figure 1
Identification of a conserved non-coding sequence as candidate for Hnf1b enhancer regulated by Pax8. (a) Localization of two conserved non-coding sequence (CNS1 and CNS2, red bars) in M. musculus and X. tropicalis. CNS1 is localized in the intergenic region between Hnf1b and the upstream gene Heatr6. CNS2 is localized in the 4th intron of Hnf1b. Arrows indicate the transcription initiation of Hnf1b. Protein coding exons are represented by blue bars, exonic sequences corresponding to 5ʹ and 3ʹ UTRs are in yellow. (b) Nucleotide sequence comparison of CNS1 in different species. The table indicates the % of conserved nucleotides. (c) Nucleotide sequence alignment of CNS1 in X. tropicalis, H. sapiens and M. musculus. Conserved nucleotides are in red. Underlined are conserved putative binding sites of TFs known to be expressed in the developing kidney according to (https//sckidney.flatironinstitute.org), GUDMAP (https://www.gudmap.org), or Xenbase (https://www.xenbase.org/entry/). The blue box highlights the conserved Pax8 putative binding site. Sequences targeted by the gRNAa and gRNAb used for CRISPR editing in Fig. 6 are shown in green. (d) Pax8 binding site sequence identified in CNS1 and Pax8 binding consensus sequence as defined by Ref. shown as sequence logo. For each position, the size of the characters represents the relative frequency of the corresponding position. The lower sequence is the Pax8 binding sequence in CNS1. Nucleotides mutated in the Pax8-BS mut oligonucleotide used for Electrophoretic Mobility Shift Assay (EMSA), and in plasmids CNS1 mut-Luc and CNS1 mut-eGFP are labelled in red. (e) EMSA. Biotin-labelled oligonucleotide probes were incubated with nuclear extracts from MDCK as indicated: Pax8-BS, Pax8-BS mut and Control TPO (Pax8 binding site identified in the thyroperoxidase promoter, used as a positive control). An arrow marks the Pax8 specific complexes. Specificity of the Pax8 complex was demonstrated by competition with 10- and 100-fold molar excesses of unlabelled Pax8-BS oligonucleotide (compare lanes 5 and 7) as well as incubation with 1 μg of Pax8 monoclonal antibodies (Pax8 AB) leading to a decrease in the Pax8 complex signal (compare lanes 5 with 9). The figure is representative of 3 independent experiments. Original uncropped autoradiography of the whole membrane is presented in Supplementary Fig. S5.
Figure 2
Figure 2
Chromatin signature of CNS1 region in Homo sapiens, Mus musculus and Xenopus tropicalis. (a) Snapshots of representative DNase-seq tracks from ENCODE database in human (https://www.encodeproject.org),. The overall profiles spanning a larger region including CNS2 and the description of the biological materials are shown in Fig. S1a. Open chromatin state is clearly detected at CNS1 level in embryonic kidney tissue and renal cells. In contrast, CNS1 is not accessible to DNase in non-renal cells expressing HNF1B (Caco-2 and A549 cells) as well as in spinal cord or neural progenitors where HNF1B is not expressed. (b) Characteristics of enrichment patterns for histone modifications and p300. (c) Snapshots of representative ATAC-seq and histone modifications tracks as indicated from ENCODE database (https://www.encodeproject.org), in kidney, lung and liver of E15.5 mouse embryo. The overall profiles spanning a larger region including CNS2 is shown in Fig. S2b. Although Hnf1b is expressed in developing kidney, liver and lung, CNS1 shows characteristics of an active enhancer only in the developing kidney. (d) Snapshots of representative p300 and histone modifications tracks as indicated from the epigenome reference maps in Ref. in Xenopus tropicalis embryos at stages 10.5, 16 and 30. The overall profiles spanning a larger region including CNS2 is shown in Fig. S1c. CNS1 is associated with active enhancer marks (p300, H3K4me1) in embryos at neurula and tailbud stages (stage 16 and 30, respectively) when hnf1b is expressed in the developing pronephros but not at early gastrula (stage 10.5). In (a,c,d), the blue box indicates the 306-bp CNS1 location.
Figure 3
Figure 3
CNS1 is specifically activated by ectopic expression of pax8 and pax2 and functions as an enhancer in mammalian renal cells. (a) Reporter constructs used in luciferase assay experiments. The backbone plasmid pGL4.23[luc2miniP] was used either unmodified (Empty-Luc) or modified by insertion of the wild type CNS1 (CNS1-Luc) or CNS1 mutated in the Pax8 binding site (CNS1 mut-Luc) upstream of the minimal promoter. (b) Exogenous pax8 and pax2 are able to activate CNS1 enhancer activation in HEK293 cells. Expression vectors for pax8, pax2, pax8ΔO or pax8VP16 were co-transfected with CNS1-Luc or CNS1mut-Luc, and a control Renilla luciferase vector for normalization. Normalized luciferase activity was determined as the Firefly over Renilla luciferase activity. Fold change is expressed as the ratio of normalized values on the normalized value for CNS1-Luc vector alone. Expression of pax8, pax8ΔO, pax8VP16 and pax2, all result in an increase of reporter activation. In every case, this increase is abolished when the mutant construct, CNS1mut-Luc, is used instead of CNS1-Luc. Combined results from three (pax8, pax8ΔO and pax8VP16) or four (pax2) independent experiments. Statistical significance was determined using One-Way ANOVA followed by Tuckey’s multiple comparison test. P-values are annotated on the figure (c) Pax8 immunofluorescence staining in MDCK and IMCD3 cells and counterstaining of nuclei with DAPI. Pax8 is detected in MDCK and IMCD3 cell nuclei. Scale bar: 50 μm. (d) Analysis of CNS1 activity in luciferase reporter assay in MDCK and IMCD3 cell lines. Histograms show the relative luciferase activities in MDCK and IMCD3 cells transfected with Empty-Luc, CNS1-Luc or CNS1 mut-Luc together with a control Renilla luciferase vector for normalization. Fold change is expressed as the ratio of normalized values on the normalized value for Empty-Luc. Combined results from four independent experiments. Statistical significance was determined using One-Way ANOVA followed by Tuckey’s multiple comparison test. P-values are annotated on the figure.
Figure 4
Figure 4
Analysis of CNS1 activity in transgenesis assay in Xenopus laevis. (a) Reporter constructs used in transgenesis. Wild type CNS1 or CNS1 mutated in the Pax8 binding site (CNS1 mut) was cloned upstream of the β-globin basal promoter and the eGFP reporter gene. (b) Percentage of F0 CNS1-eGFP transgenic embryos generated by the I-SceI meganuclease method showing GFP expression detected by in situ hybridization in the developing pronephros at stages 20, 22, 25 and 28. Results corresponding to three independent experiments. (c) GFP expression detected by in situ hybridization in representative F0 transgenic embryos at stages 28 and 35 generated with reporter constructs as indicated. Transverse cryostat section (16 μm) of CNS1-eGFP transgenic embryos showing GFP reporter gene expression at the level of the proximal part of the pronephros are shown on the right. At stage 28, the dotted line delineates the mesoderm-endoderm frontier. sp splanchnic mesoderm. (d) Percentage of F0 transgenic embryos generated with the indicated reporter constructs expressing GFP in pronephros at stages 28 and 35. Results from three independents experiments. Statistical significance was determined using Fisher’s exact test. P-values are annotated on the figure. (e) Representative stage 40 F0 transgenic tadpole obtained by the REMI method with the CNS1-eGFP construct. Arrowhead indicates the fluorescent pronephros. In (b,d,e), n indicates the total number of analysed embryos.
Figure 5
Figure 5
Endogenous pax8, but not pax2, is required for hnf1b expression and CNS1 activity in the pronephros at tailbud stage. (a) Pax2 depletion does not affect hnf1b expression at stage 28. 4-cell stage embryos were injected into the two left blastomeres with either a control Mo (cMo), a mix of two morpholinos, Mo Pax8 and Mo Pax8.B, (named Mo pax8 for simplicity) or Mo Pax2.2 (named Mo pax2). They were further cultured until tailbud stage 28 and processed for hnf1b whole-mount in situ hybridization. Hnf1b pronephric expression is strongly inhibited in 80% (n = 24) of pax8 depletion. In contrast, pax2 depletion has no significant effect on hnf1b pronephric expression (n = 60), as embryos injected with cMo (n = 71) (three independent experiments). (b) Pax2 depletion does not affect CNS1-driven GFP expression in the pronephros. F0 CNS1-eGFP transgenic embryos were generated by the I-SceI meganuclease method at the 1-cell stage. At the 2-cell stage, same mixes of Mo as in (a) were injected into every blastomeres. GFP expression was monitored by whole-mount in situ hybridization in embryos cultured until the tailbud stage 28. The histogram indicates the percentage of CNS1-eGFP transgenic embryos showing GFP expression in controls, or upon depletion of pax2 or pax8. In contrast to pax8 depletion, pax2 depletion has no significant effect on CNS1 activity. Statistical significance was determined using Fisher’s exact test. P-values are annotated on the figure. Combined results from three independent experiments. n indicates the total number of analysed embryos.
Figure 6
Figure 6
CNS1 CRISPR editing inhibits endogenous hnf1b pronephric expression in Xenopus tropicalis embryos. (a) GRNAa and gRNAb efficiently edit Xenopus tropicalis embryo DNA in two different locations in CNS1. Embryos were injected at the 1-cell stage with Cas9 protein and gRNAa or gRNAb and cultured until neurula stage. The target sequences of gRNAa and gRNAb are depicted in Fig. 1 (see also “Methods” section). Top panels: chromatogram showing CRISPR editing by gRNAa and gRNAb in single embryos. Lower panels: TIDE analysis of sequence trace degradation at the expected Cas9 site of DNA cleavage. Percentage of CNS1 sequence containing insertions and deletions (Indels) represented as the mean from four embryos. The use of gRNAa and gRNAb resulted in 51.3% and 71.7% editing efficiency, respectively. (b) The use of gRNAa and gRNAb together efficiently leads to nucleotide sequence deletion into CNS1. Embryos were injected at the 1-cell stage with Cas9 protein, together with gRNAa, gRNAb or both. At tailbud stage, their DNA were analysed by PCR using primers allowing amplification of a DNA fragment containing the entire CNS1. Electrophoresis of amplified fragments from single embryos. A band corresponding to the wild type sequence is observed in all embryos. An additional lower band is present in 3 out of 5 embryos co-injected with gRNAa and gRNAb, indicating that a deletion occurred (c) Hnf1b pronephric expression in gRNAa, gRNAb and gRNAa–gRNAb CRISPR embryos analyzed by in situ hybridization at tailbud stage 28. Embryos were classified into three groups according to their hnf1b pronephric expression (normal, slightly diminished, strongly diminished). The histogram shows the percentage of embryos for each group. Average values from four independent experiments. Statistical significance was determined using Fisher’s exact test (comparison to the uninjected control embryos). P-values are annotated on the figure. n indicates the total number of analysed embryos. (d) Lhx1 pronephric expression in gRNAa, gRNAb and gRNAa-gRNAb CRISPR embryos analyzed by in situ hybridization at tailbud stage 28. No significant effect on lhx1 expression is observed. n indicates the total number of embryos analysed from three independent experiments.

Similar articles

Cited by

References

    1. Desgrange A, et al. HNF1B controls epithelial organization and cell polarity during ureteric bud branching and collecting duct morphogenesis. Development. 2017;144:4704–4719. - PubMed
    1. Gresh L, et al. A transcriptional network in polycystic kidney disease. EMBO J. 2004;23:1657–1668. doi: 10.1038/sj.emboj.7600160. - DOI - PMC - PubMed
    1. Heliot C, et al. HNF1B controls proximal-intermediate nephron segment identity in vertebrates by regulating notch signalling components and Irx1/2. Development. 2013;140:873–885. doi: 10.1242/dev.086538. - DOI - PubMed
    1. Lokmane L, Heliot C, Garcia-Villalba P, Fabre M, Cereghini S. vHNF1 functions in distinct regulatory circuits to control ureteric bud branching and early nephrogenesis. Development. 2010;137:347–357. doi: 10.1242/dev.042226. - DOI - PubMed
    1. Massa F, et al. Hepatocyte nuclear factor 1β controls nephron tubular development. Development. 2013;140:886–896. doi: 10.1242/dev.086546. - DOI - PubMed

Publication types