Genetically determined gut microbial abundance and 2-year changes in central adiposity and body composition: The POUNDS lost trial
- PMID: 36402008
- PMCID: PMC9722600
- DOI: 10.1016/j.clnu.2022.11.002
Genetically determined gut microbial abundance and 2-year changes in central adiposity and body composition: The POUNDS lost trial
Abstract
Background and aim: Growing evidence has linked gut microbiota with regulation of adiposity. We aimed to examine whether the genetically determined relative abundance of gut microbial taxa was associated with long-term changes in adiposity and body composition among individuals who were overweight or obese in weight-loss diet interventions.
Methods: The study included 692 participants with overweight or obese from the POUNDS Lost trial. We created a genetic risk score (GRS) for the relevant abundance of gut microbial taxa using 20 single nucleotide polymorphisms identified from a recent genome-wide association study. Body composition was assessed using dual-energy X-ray absorptiometry.
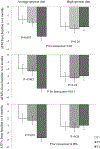
Results: Higher GRS for the relative abundance of gut microbial taxa was significantly associated with greater reductions in waist circumference, total fat mass (FM), whole-body total percentage of fat mass (FM%), and percentage of trunk fat (TF%) at 2 years (p = 0.022, 0.034, 0.023, 0.023, respectively). In addition, dietary protein significantly modified the association between GRS for gut microbial abundance and changes in total FM, FM%, and TF% (p-interactions = 0.04, 0.013, and 0.006, respectively) at 6-month, when the maximum weight loss was achieved, even though such interactions were attenuated at 2 years. In the average-protein diet group, a higher microbial abundance GRS was associated with greater reductions in total FM (p = 0.007), FM% (p = 0.002), and TF% (p < 0.001) at 6 months, while no associations were found in the high-protein diet group (p > 0.05).
Conclusion: Our results suggest that the higher genetically determined relative abundance of gut microbial taxa may be related to long-term improvement of whole-body and central fatness and body composition in response to low-calorie diet interventions.
Keywords: Body composition; Central adiposity; Diet intervention; Gut microbiome.
Copyright © 2022 Elsevier Ltd and European Society for Clinical Nutrition and Metabolism. All rights reserved.
Conflict of interest statement
Conflicts of interest All authors declare no conflict of interest.
Figures


Similar articles
-
Toward Precision Weight-Loss Dietary Interventions: Findings from the POUNDS Lost Trial.Nutrients. 2023 Aug 21;15(16):3665. doi: 10.3390/nu15163665. Nutrients. 2023. PMID: 37630855 Free PMC article. Review.
-
Macronutrient Intake-Associated FGF21 Genotype Modifies Effects of Weight-Loss Diets on 2-Year Changes of Central Adiposity and Body Composition: The POUNDS Lost Trial.Diabetes Care. 2016 Nov;39(11):1909-1914. doi: 10.2337/dc16-1111. Epub 2016 Aug 31. Diabetes Care. 2016. PMID: 27581055 Free PMC article.
-
Gut-microbiome-related LCT genotype and 2-year changes in body composition and fat distribution: the POUNDS Lost Trial.Int J Obes (Lond). 2018 Sep;42(9):1565-1573. doi: 10.1038/s41366-018-0046-9. Epub 2018 Feb 26. Int J Obes (Lond). 2018. PMID: 29568104 Free PMC article. Clinical Trial.
-
Genetic variation in lean body mass, changes of appetite and weight loss in response to diet interventions: The POUNDS Lost trial.Diabetes Obes Metab. 2020 Dec;22(12):2305-2315. doi: 10.1111/dom.14155. Epub 2020 Aug 20. Diabetes Obes Metab. 2020. PMID: 32734691 Free PMC article. Clinical Trial.
-
Beverage Consumption and Growth, Size, Body Composition, and Risk of Overweight and Obesity: A Systematic Review [Internet].Alexandria (VA): USDA Nutrition Evidence Systematic Review; 2020 Jul. Alexandria (VA): USDA Nutrition Evidence Systematic Review; 2020 Jul. PMID: 35349233 Free Books & Documents. Review.
Cited by
-
Is There an Ideal Diet? Some Insights from the POUNDS Lost Study.Nutrients. 2024 Jul 20;16(14):2358. doi: 10.3390/nu16142358. Nutrients. 2024. PMID: 39064800 Free PMC article. Review.
-
Toward Precision Weight-Loss Dietary Interventions: Findings from the POUNDS Lost Trial.Nutrients. 2023 Aug 21;15(16):3665. doi: 10.3390/nu15163665. Nutrients. 2023. PMID: 37630855 Free PMC article. Review.
References
-
- Clemente JC, Ursell LK, Parfrey LW, Knight R. The Impact of the Gut Microbiota on Human Health: An Integrative View. Cell 2012;148:1258–70. https://doi.org/10.1016/j.cell.2012.01.035. - DOI - PMC - PubMed
Publication types
MeSH terms
Substances
Grants and funding
LinkOut - more resources
Full Text Sources
Miscellaneous

