

Fndc5/irisin is regulated by myogenesis stage, irisin, muscle type and training
- PMID: 36398256
- PMCID: PMC9641476
Fndc5/irisin is regulated by myogenesis stage, irisin, muscle type and training
Abstract
Objectives: Irisin, a novel myokine that responds to exercise, was initially identified as a regulator of fat tissue metabolism. We aimed to investigate fibronectin type III domain-containing protein 5 (Fndc5)/irisin, auto/para-crine role in different muscle fibers, different activities, and muscle cell differentiation.
Methods: Using in-vitro, ex-vivo, and in-vivo muscle models, Fndc5 was studied at the physiological and molecular levels.
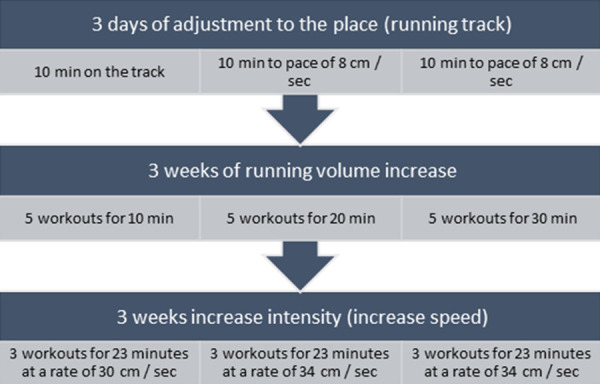
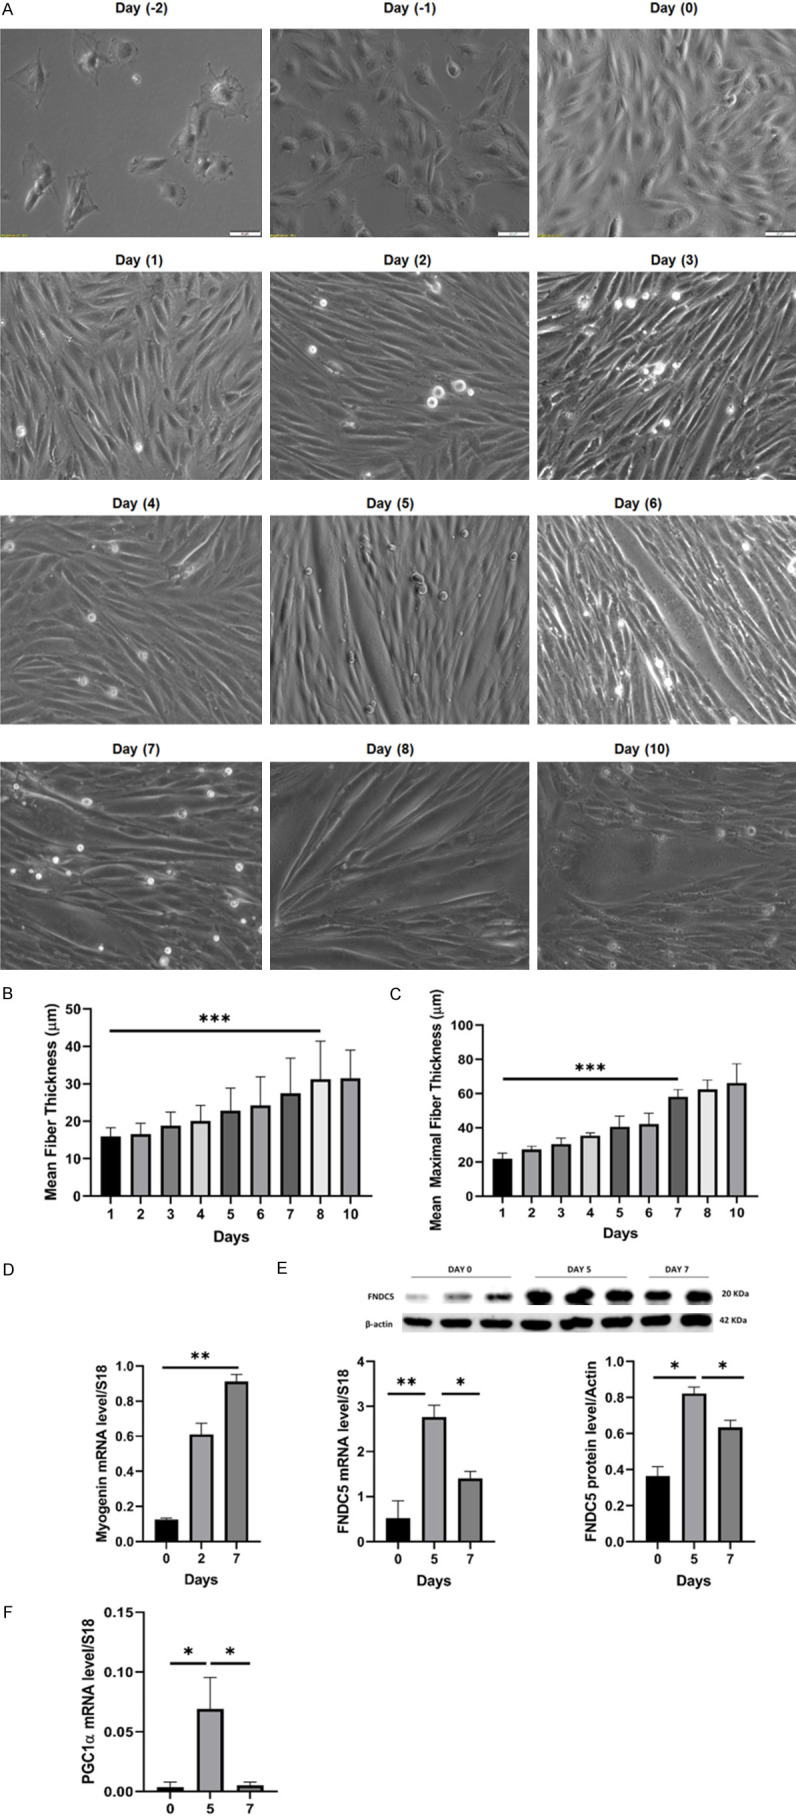
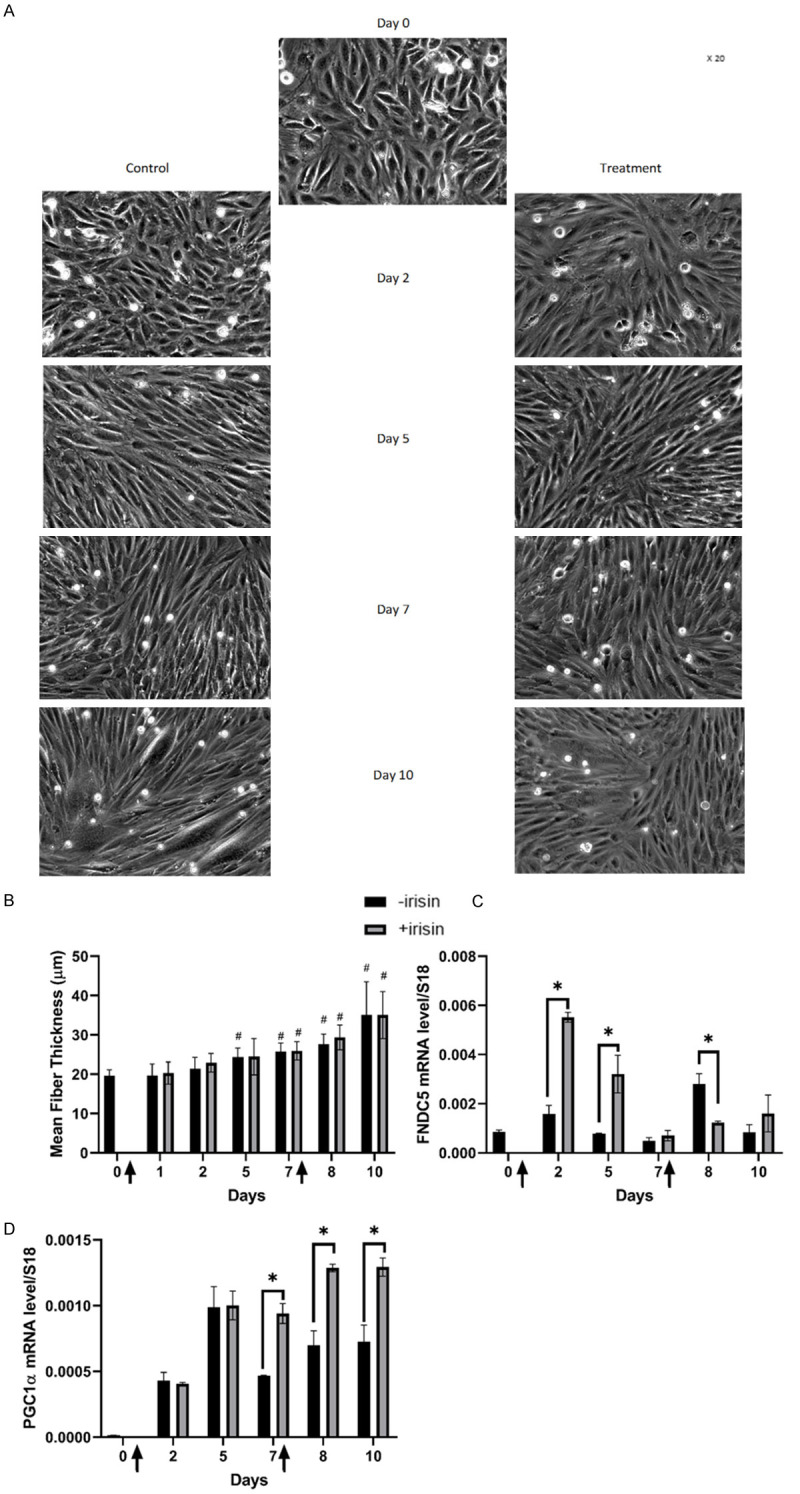
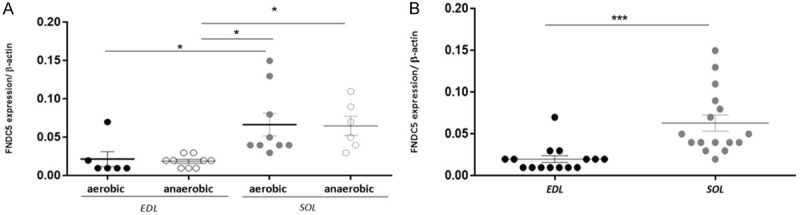
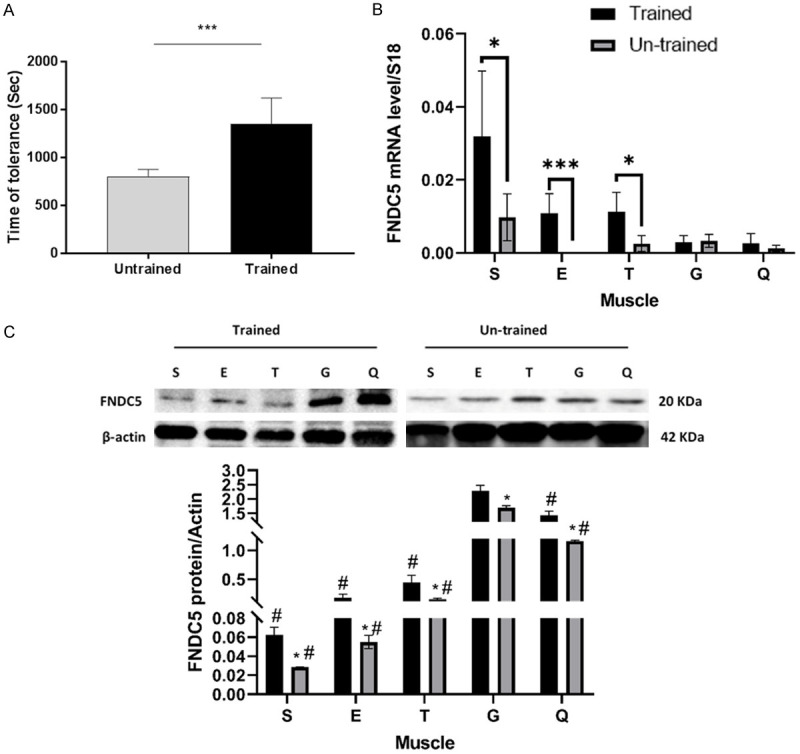
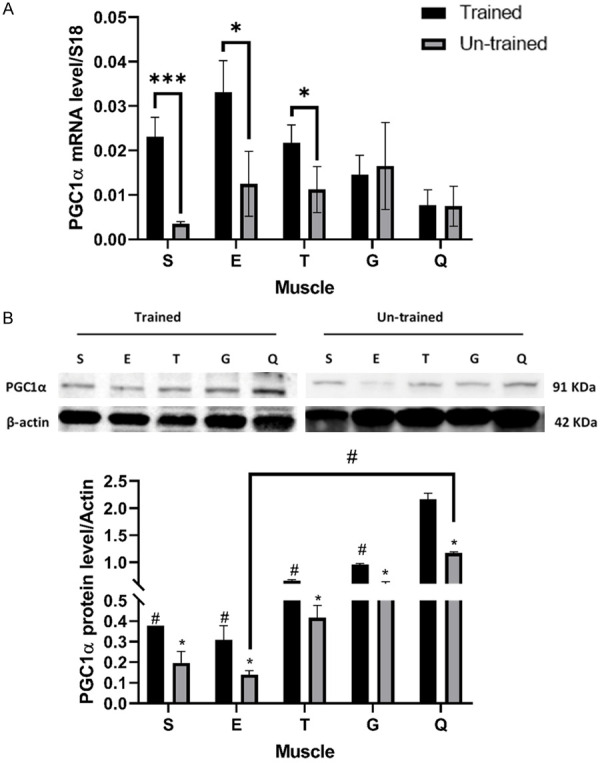
Results: Following training, C57BL/6 mice (n=10) were subject to fast and slow-twitch muscles dissection and molecular analysis. Isolated mice (C57BL/6, n=14) slow and fast-twitch muscles were subject to electrical aerobic and anaerobic pulses stimulation (EPS). L6 muscle cells differentiation was characterized by Fndc5 differentiation-depended expression pattern parallel with significant hypertrophy, Myogenin elevation, and overlapping Peroxisome proliferator-activated receptor-gamma coactivator-1 alpha (Pgc-1α) expression pattern. Exogenous irisin significantly altered Fndc5 expression; augmented at early differentiation (3-4-fold, P<0.05) and decreased (2-fold, P<0.05) at late differentiation. Training induced a significant elevation in Fndc5/irisin and Pgc-1α expression levels in all muscle types compared to the sedentary state, where soleus muscle (slow) Fndc5 expression levels were significantly higher compared to levels in all other fast muscles (3-140-fold, P<0.001). Similarly, following EPS, Fndc5 expression levels were significantly augmented in the soleus slow muscle following both aerobic and anaerobic activity (3-3.5-fold, P<0.05) compared to extensor digitorum longus (fast) muscle.
Conclusions: Muscle cell's Fndc5 expression has a differentiation-depended pattern paralleling Pgc-1α expression and hypertrophy. Irisin autocrinally and significantly regulate Fndc5 and Pgc-1α in a differentiation-depended manner. Muscle Fndc5 expression levels are dependent on fiber type and activity type.
Keywords: FNDC5; Irisin; Pgc-1α; muscle; myogenesis.
AJTR Copyright © 2022.
Conflict of interest statement
None.
Figures
Similar articles
-
Time-Dependent Changes in Increased Levels of Plasma Irisin and Muscle PGC-1α and FNDC5 after Exercise in Mice.Tohoku J Exp Med. 2018 Feb;244(2):93-103. doi: 10.1620/tjem.244.93. Tohoku J Exp Med. 2018. PMID: 29415899
-
Are skeletal muscle FNDC5 gene expression and irisin release regulated by exercise and related to health?J Physiol. 2013 Nov 1;591(21):5393-400. doi: 10.1113/jphysiol.2013.263707. Epub 2013 Sep 2. J Physiol. 2013. PMID: 24000180 Free PMC article.
-
Interaction of CREB and PGC-1α Induces Fibronectin Type III Domain-Containing Protein 5 Expression in C2C12 Myotubes.Cell Physiol Biochem. 2018;50(4):1574-1584. doi: 10.1159/000494655. Epub 2018 Oct 25. Cell Physiol Biochem. 2018. PMID: 30359971
-
Role of irisin in physiology and pathology.Front Endocrinol (Lausanne). 2022 Sep 26;13:962968. doi: 10.3389/fendo.2022.962968. eCollection 2022. Front Endocrinol (Lausanne). 2022. PMID: 36225200 Free PMC article. Review.
-
FNDC5/Irisin System in Neuroinflammation and Neurodegenerative Diseases: Update and Novel Perspective.Int J Mol Sci. 2021 Feb 5;22(4):1605. doi: 10.3390/ijms22041605. Int J Mol Sci. 2021. PMID: 33562601 Free PMC article. Review.
Cited by
-
Impact of Exercise Intensity on Cerebral BDNF Levels: Role of FNDC5/Irisin.Int J Mol Sci. 2024 Jan 19;25(2):1213. doi: 10.3390/ijms25021213. Int J Mol Sci. 2024. PMID: 38279218 Free PMC article.
-
Myokines Produced by Cultured Bovine Satellite Cells Harvested from 3- and 11-Month-Old Angus Steers.Animals (Basel). 2024 Feb 24;14(5):709. doi: 10.3390/ani14050709. Animals (Basel). 2024. PMID: 38473094 Free PMC article.
-
Recent Advances in Nutraceuticals for the Treatment of Sarcopenic Obesity.Nutrients. 2023 Sep 4;15(17):3854. doi: 10.3390/nu15173854. Nutrients. 2023. PMID: 37686886 Free PMC article. Review.
-
Irisin: An anti-inflammatory exerkine in aging and redox-mediated comorbidities.Front Endocrinol (Lausanne). 2023 Feb 10;14:1106529. doi: 10.3389/fendo.2023.1106529. eCollection 2023. Front Endocrinol (Lausanne). 2023. PMID: 36843614 Free PMC article. Review.
-
Treadmill exercise with nanoselenium supplementation affects the expression of Irisin/FNDC5 and semaphorin 3A in rats exposed to cigarette smoke extract.3 Biotech. 2024 Jan;14(1):4. doi: 10.1007/s13205-023-03849-9. Epub 2023 Dec 4. 3 Biotech. 2024. PMID: 38058362 Free PMC article.
References
-
- Wolfe RR. The underappreciated role of muscle in health and disease. Am J Clin Nutr. 2006;84:475–482. - PubMed
-
- Pedersen BK, Febbraio MA. Muscles, exercise and obesity: skeletal muscle as a secretory organ. Nat Rev Endocrinol. 2012;8:457–465. - PubMed
-
- Huh JY. The role of exercise-induced myokines in regulating metabolism. Arch Pharm Res. 2018;41:14–29. - PubMed
-
- Serrano AL, Baeza-Raja B, Perdiguero E, Jardí M, Muñoz-Cánoves P. Interleukin-6 is an essential regulator of satellite cell-mediated skeletal muscle hypertrophy. Cell Metab. 2008;7:33–44. - PubMed
LinkOut - more resources
Full Text Sources